


Just like the check engine light on your car, there are definitely warning lights that you need to pay close attention to in the home lab. If you have been running Proxmox hypervisor for any length of time, you have probably opened the web interface and noticed a warning about something in the past. Maybe you have an indicator that a storage pool is filling up, or maybe a failed backup. What about Ceph warnings/errors? Check out the warning lights that I pay attention to every single time I log into my Proxmox environment and which ones you should too.
Ceph health warnings
If you are running Ceph storage in your Proxmox cluster for shared storage across your cluster nodes, keeping an eye on the health of your Ceph datastore is one of the primary things that you want to do in terms of monitoring. This is probably the first thing I check every morning outside of checking any notifications that I may have received.
A HEALTH_WARN status doesn’t always mean something is broken, but it almost always means something deserves investigation or attention at the very least. A warning can become a critical error if it is something that will continue to degrade.
Also, the warning are good I think since it can alert you to things that YOU may have done on purpose and forgot to “undo”. Things like intentionally setting Ceph to “noout” or “norebalance” for your OSDs. I typically do this when I am performing maintenance on PVE hosts or applying updates across the board.
This makes sure that if I keep a host down for longer than I think, that Ceph won’t start trying to rebalance or set a disk as out since it is out of the mix too long. But these flags on your OSDs will show up as a warning when they are set. So, I like this as I have forgotten to unset these flags after maintenance in the past.
Aside from warnings, here are a few things that will immediately get my attention with Ceph:
- Slow operations
- Degraded placement groups
- Down OSDs
- Near-full OSDs
- Clock skew warnings
- Scrubbing errors
The nice thing about Ceph is that it usually tells you exactly what it’s unhappy about. I always start by running:
ceph status

##then

ceph health detail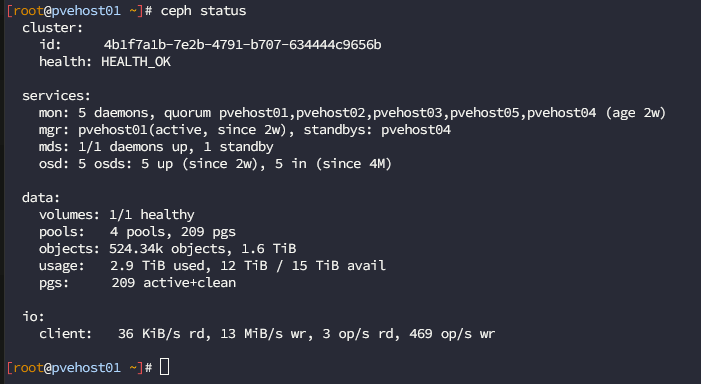
These commands will usually give me enough useful information on specifically what Ceph is having an issue with. One lesson I’ve learned is that Ceph problems usually don’t resolve themselves. They generally get worse until you address the underlying issue. So, this is why I try to start checking things out as soon as I can if you see warnings or errors.
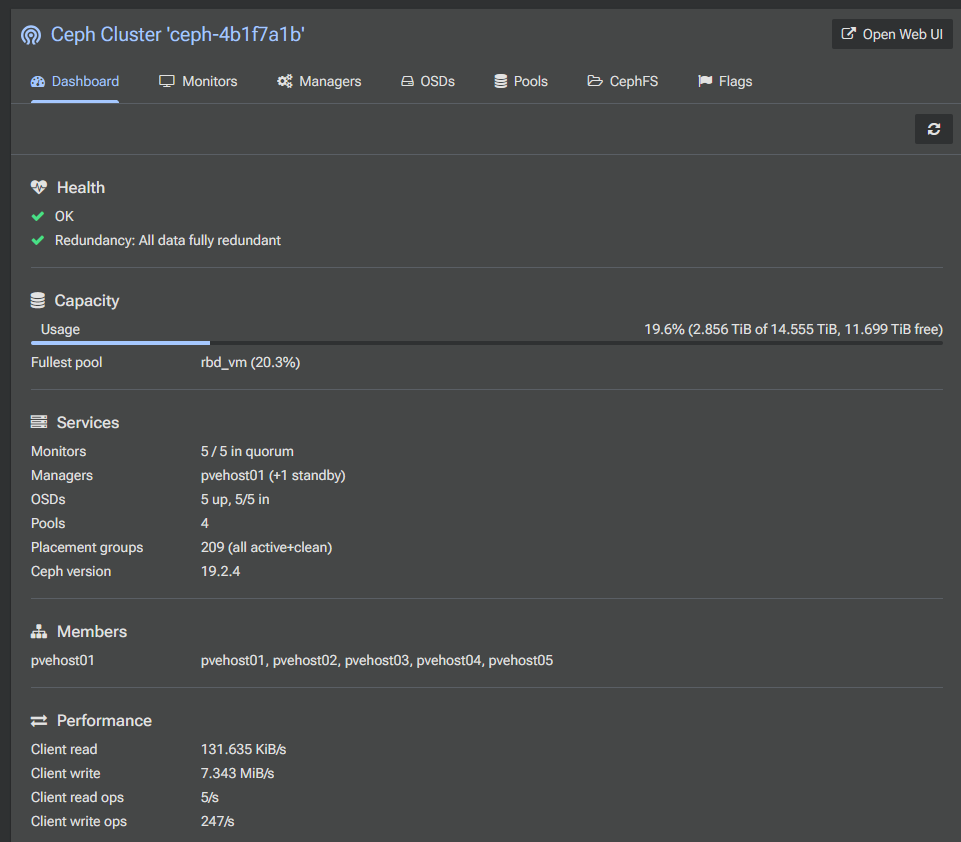
You can also get a good health overview of Ceph in Proxmox Datacenter Manager:
Storage running out of space
When you have a “warning light” that storage is running out of space, this is definitely one to give attention to as it can lead to bad things happening. This is common to happen in home labs as well since we typically overprovision things like crazy and may have thin pools that may have suddenly written a lot of blocks.
When you have storage space that gets low, this will cause a cascade effect in your Proxmox VE environment. Things like:
- snapshots stop working
- backups will start failing
- VM disks can’t expand
- Containers may become read only
Definitely keep an eye on things in the storage backend like:
- local-lvm
- ZFS pools
- NFS storage
- Ceph storage
- Backup repositories
One of the first commands I run is:
pvesm status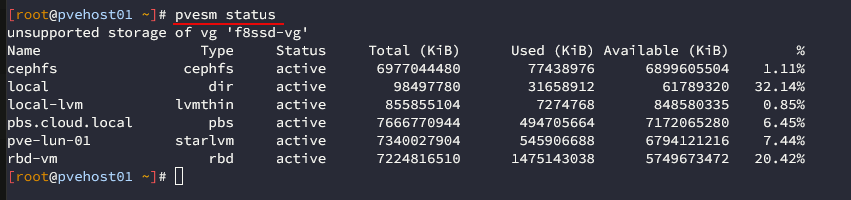
If I’m using LVM Thin storage, I’ll also check utilization with:
lvsFor ZFS systems:
zpool listYou might be surprised at how quickly storage can fill up when you’re experimenting with templates, ISOs, snapshots, and backup jobs and other projects.
One habit I’ve developed is cleaning up old templates and ISO images every few weeks. Take a look at my cleanup routines on things in the home lab as this is something I have written about recently.
SMART and disk health alerts
This is another one that can fall under the radar. Physical disk health is definitely one that you want to keep an eye on for sure. Drives usually warn you before they fail. SMART errors are the built-in mechanism that modern hard drives use to warn you that a failure could be imminent.
I usually take a look every so often at the SMART statistics on a drive to see if these values are increasing over time. If you start to see things incrementing pretty quickly, then you may have a drive that is giving you the tell tale signs that it is about to fail.
What are some of the attribute values to look for?
- Reallocated sectors
- Pending sectors
- Uncorrectable errors
- CRC errors
- NVMe media errors
- Temperature trends
On Linux, smartctl remains one of my favorite tools.
For example:
smartctl -a /dev/nvme0n1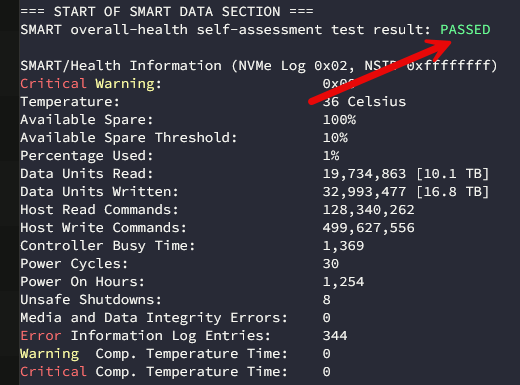
or
smartctl -a /dev/sdaI’ve had drives continue operating for months after reporting early warning signs. That doesn’t mean they were healthy. It simply gave me time to replace them on my schedule instead of during an emergency.
Cluster communication problems
When you run more than one machine in a Proxmox VE cluster, one of the warning lights that you need to watch out for is cluster communication problems. In a Proxmox VE cluster, each node communicates with each other and exchanges information about the cluster so the nodes in the cluster all know they are in agreement or quorum.
Corosync is the means that Proxmox VE Server uses as its cluster communication service. It is really reliable on its own, but it is also sensitive to network issues or other problems preventing the nodes from communicating properly. I’ve seen switch problems, VLAN configuration mistakes, and network congestion create issues for corosync where it doesn’t synchronize things properly.
There are some warning signs that I never ignore when it comes to cluster communication. These include:
- Lost quorum
- Nodes that keep leaving and rejoining
- Time synchronization issues
- Unexpected fencing events
- High latency between nodes
When something looks suspicious, I usually start with the basic command for Proxmox:
pvecm status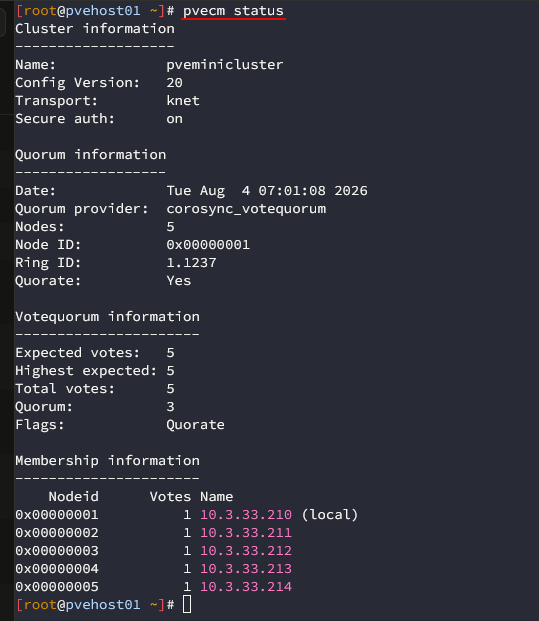
This command will tell you if the cluster thinks everything is healthy and working as expected between the cluster nodes. If I recently made networking changes, I’ll keep an eye out on the latency between every node. Small network problems can show up in this way before virtual machines start to experience issues.
Backup failures
This is another one to take seriously. While a failing backup doesn’t take things offline due to a backup failure, this is usually our safety net against losing data or having something catastrophic wipe out everything we have done in the home lab, all of our data.
Treat this one with zero tolerance. A backup failure doesn’t necessarily mean you’ve lost data today. The reason I say this is it is very easy to just say to yourself, “I will fix that tomorrow”. But if you are like me, things come up and you get busy and you never get around to checking the backup issue. Then, you forget about it. The next time you remember it, you may be in a situation where you were depending on your backups to recover only to remember you never got the backups working again. Yikes!
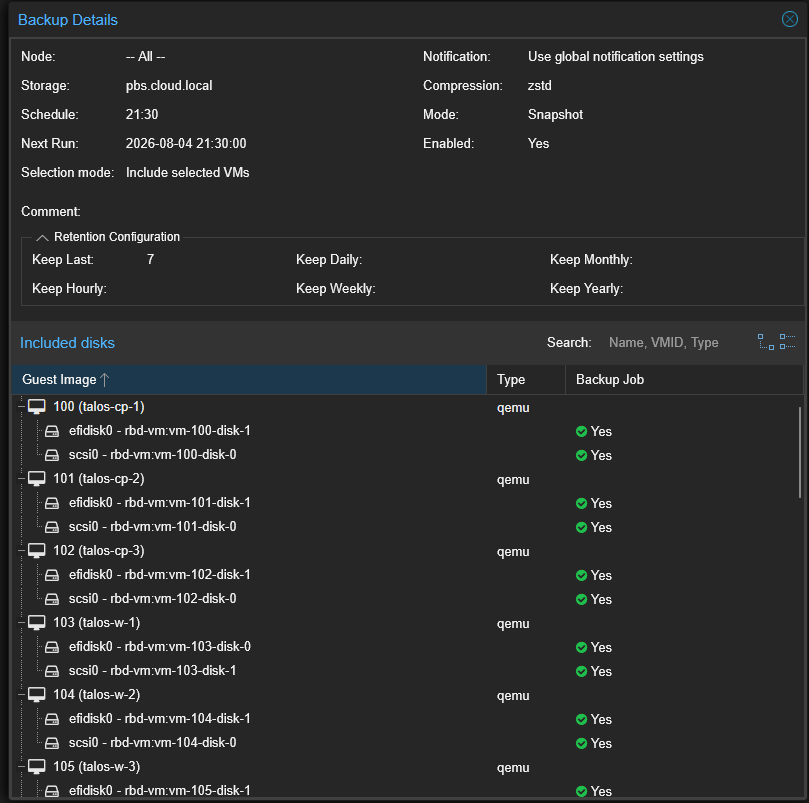
If you see issues with backup jobs, there are a few things that you can start asking yourself. Usually between a few simple questions, you can start narrowing in on the issue.
- Did authentication change?
- Is the destination storage available?
- Did a snapshot fail?
- Is there enough repository space?
- Is a VM locked?
- Did network connectivity change?
Sometimes I have found the issue to be simple like I have a VM added to a backup job that I have since deleted and it is no longer there and the PBS backup fails due to that. Other times, I have seen VMs be in a locked state for one reason or another and the backup fails for that reason.
Either way, I’d much rather discover the issue immediately than during a restore.
Replication failures
Like a backup failure, treat replication failures with deliberate next steps. You don’t want to have your offsite backup not working and let you down when you least expect it. Like backup jobs, replication is usually a pretty stable operation that doesn’t run into issues too often, but they do happen.
You might see replication failures due to the following reasons:
- Network problems
- Snapshot problems
- ZFS issues
- Storage space problems
- Issues on your target node
- Configuration problems
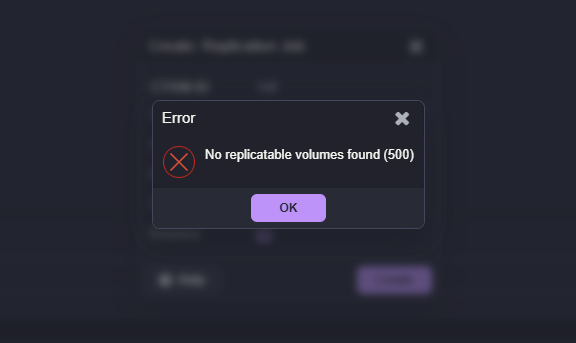
Try to review your replication jobs as often as you can and make sure that you have your notifications setup in your Proxmox environment so you get notified on these types of failures.
I periodically review replication jobs even when there aren’t active warnings. Verifying that jobs are completing successfully only takes a minute and provides a lot of peace of mind.
Failed tasks in the task history
If you are like me, I don’t typically check through the task history unless there is an immediate issue that I have seen happen or a task that I just kicked off fail. But, using Proxmox Datacenter Manager (PDM), I like to use the “Remotes” view to take a look at the tasks log on all of the nodes.
The nice thing about the PDM tasks view is that it aggregates the tasks from all of the nodes and displays these together in a view that can be filtered for various warning and error levels so you can see any critical errors across all of your nodes.
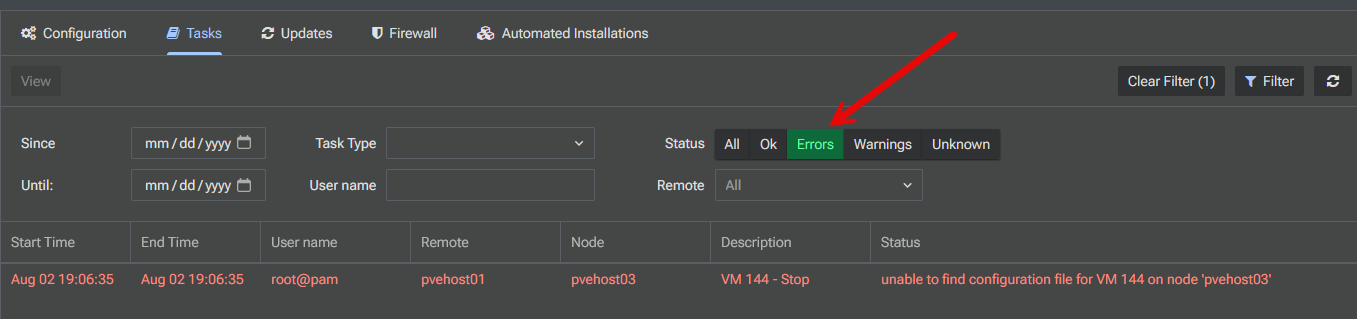
I like to look through the tasks to make sure I don’t see any of the following errors:
- Failed snapshot jobs
- Migration failures
- Storage timeout errors
- VM shutdown problems
- Authentication failures
If I find errors I start triaging these to see if I can get to the bottom of the error and find the root cause. One of the coolest things nowadays is to use AI to help narrow in on certain issues in the environment. Check out my post on using Proxmox MCP server to connect to your Proxmox cluster environment and troubleshoot, get health reports, etc here: I Connected AI to My Proxmox Cluster Using MCP and It Was Better Than I Expected.
My daily Proxmox health routine
I have been asked before how long I spend checking my infrastructure each day. Honest, not too long, but I have a good handle on what to check. Again, AI has helped with this also. Since I can ask natural language questions using my various MCP servers, like “Give me a health overview of my Proxmox environment and narrow in on any errors or issues that need to be surfaced.” This helps me to get a good overview and also a list of any issues found.
Once I find issues if there are any, I can also use AI to help troubleshoot. Or it may be something that is easy enough to get to the bottom of using my normal troubleshooting tasks.
My normal routine usually looks something like this for my Proxmox environment:
- Check node status
- Review Ceph health
- Verify backups completed
- Review storage utilization
- Look for failed tasks
- Check replication jobs
- Scan system notifications
- Verify monitoring dashboards are green
Check out my recent post here where I detailed my daily home lab checklist: My Daily Home Lab Checklist That Prevents Most Problems.
Wrapping up
As the old saying goes, “an ounce of prevention is worth a pound of cure.” This is definitely true when it comes to keeping a check on your Proxmox environment. Don’t dismiss “warning lights” and other signals that something might not be quite right. This can lead to more major issues down the road that can cause you a lot of downtime or grief later. I like to find problems as early as possible and head these off as this is much better to find problems this way than waiting until the system goes down. How about you? What warning lights do you look for? Please share with us in the comments.
More in this topic



Google is updating how articles are shown. Don’t miss our leading home lab and tech content, written by humans, by setting Virtualization Howto as a preferred source.
About The Author