
When it comes to keeping problems headed off in the home lab, it often comes down to the small things. Most problems are not random. They build up slowly and they start showing warning signs. They give little hints before turning into major outages or weird performance issues. Keeping these small problems from building up is not necessarily difficult. It requires a routine and small checks that take just a few minutes each day. This is the daily checklist I follow in my home lab. I think that it is simple, practical, and based on real issues I have run into with Proxmox, Ceph, Docker, and Kubernetes environments.
Check cluster and node health first
For me, I like to start at the foundation of the home lab. This includes my Proxmox cluster and the physical nodes in the environment. So, everything I can touch is what I start taking a few quick minutes on. The reason for this is that if you start too high up in the chain, problems you see there may just be noise from problems at a much lower level in the stack.
For Proxmox checks, this is pretty straightforward. I start by making sure that all nodes are online and responsive. A node that is slow or impaired can be related to a hardware issue or maybe even a networking problem. If you are running Ceph as part of your Proxmox cluster this needs to be included as part of the checks from the physical cluster perspective. You need to make sure your OSDs are all IN and HEALTHY.
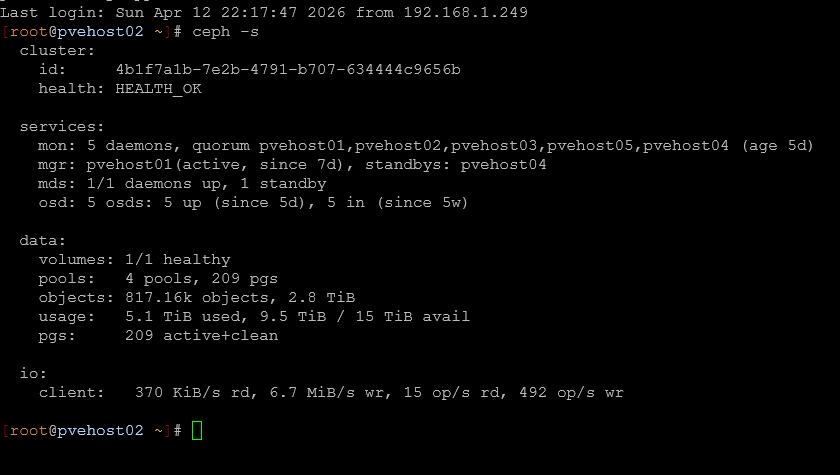
Also pay attention to quorum. If your cluster is on the edge of losing quorum, you are one failure away from a much bigger problem.
Daily checks as part of your checklist for your cluster and nodes:
| Category | Check | How to check | What to look for |
|---|---|---|---|
| Physical nodes | Node availability | Proxmox UI or pvecm status | All nodes online and responsive |
| Performance | Node responsiveness | Proxmox UI, SSH into nodes | Slow UI, lag, high CPU or IO |
| Cluster health | Cluster status | pvecm status | No errors, stable cluster state |
| Ceph overall health | Ceph status | ceph -s | HEALTH_OK |
| Ceph data health | Object state | ceph -s | No degraded or misplaced objects |
| Ceph OSD status | OSD availability | ceph osd tree or ceph -s | All OSDs are IN and UP |
| Ceph warnings | Cluster warnings | ceph health detail | Any HEALTH_WARN messages |
| Quorum status | Cluster quorum | pvecm status | All expected nodes in quorum |
Look for storage latency and weird performance
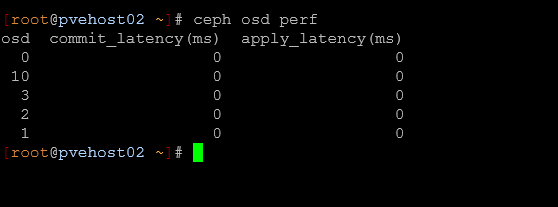
Storage issues can be one of the hardest problems to troubleshoot after the fact. The key is to catch these when they first start showing up. In a Ceph cluster that is part of your Proxmox cluster, there are several Ceph commands that you can use to troubleshoot and get visibility into Ceph performance.
- ceph osd perf for latency across OSDs
- Any outliers where one OSD is significantly slower than others
- General responsiveness of the cluster or workloads maybe hanging
Even if everything is technically healthy, latency spikes can indicate underlying problems like:
- A failing drive
- Network congestion
- Resource contention on a node
On the host side, a quick look at iostat or similar tools can help you spot anything that is out of the ordinary. If something feels slower than usual, I have found to trust my instincts and dig a little bit deeper into the issue. One thing I have learned is that storage performance usually doesn’t fail all at once. It usually slows down over time due to certain issues. Catching it early can save you from a much larger issue later.
Check containers and services for failures or issues
I run most of my self-hosted services inside containers or Kubernetes pods. But due to their very small and efficient nature, you could have a container that has become unstable, and it may not even be something you catch when you have a restart happen every so often.
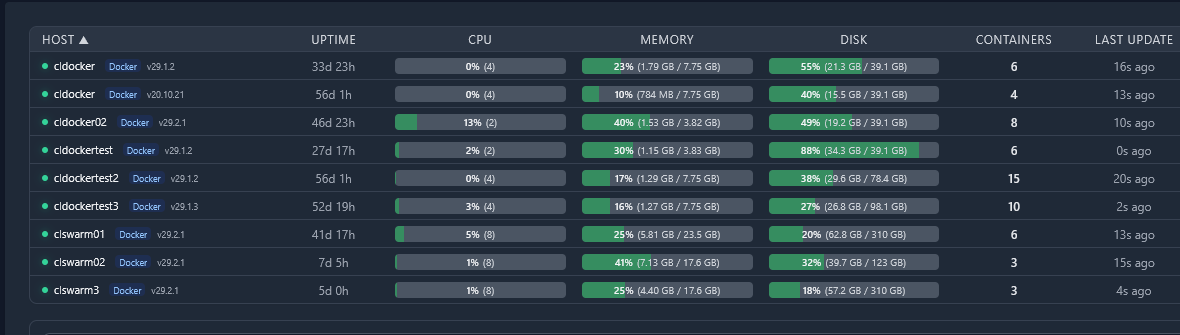
I use Pulse in the home lab to keep an eye on all my running containers and get a good high level view on resource usage on those. It tells me quickly things like uptime, CPU, memory, disk usage, containers running, last update, etc.
If you are not running something like pulse, you can also run something simple from the command line like docker ps or podman ps. If you are running Portainer or Komodo or something else, these tools
- docker ps or podman ps
- Portainer dashboard if I want a quick visual overview
Here are some things to look for in your quick checklist of things with your containers:
| Category | What to look for | Why it matters | Examples |
|---|---|---|---|
| Stability | Containers that are in restart loop | You have a bad config, missing data, bad perms, etc | Any containerized app |
| Availability | Stopped services | Other services may be impacted | Reverse proxies, APIs |
| Health | Health checks failing | Services may be degraded | Monitoring stacks, auth services |
| Dependencies | Failures across connected services | Problems may impact other services | Internal APIs, authentication services |
Verify backup jobs ran
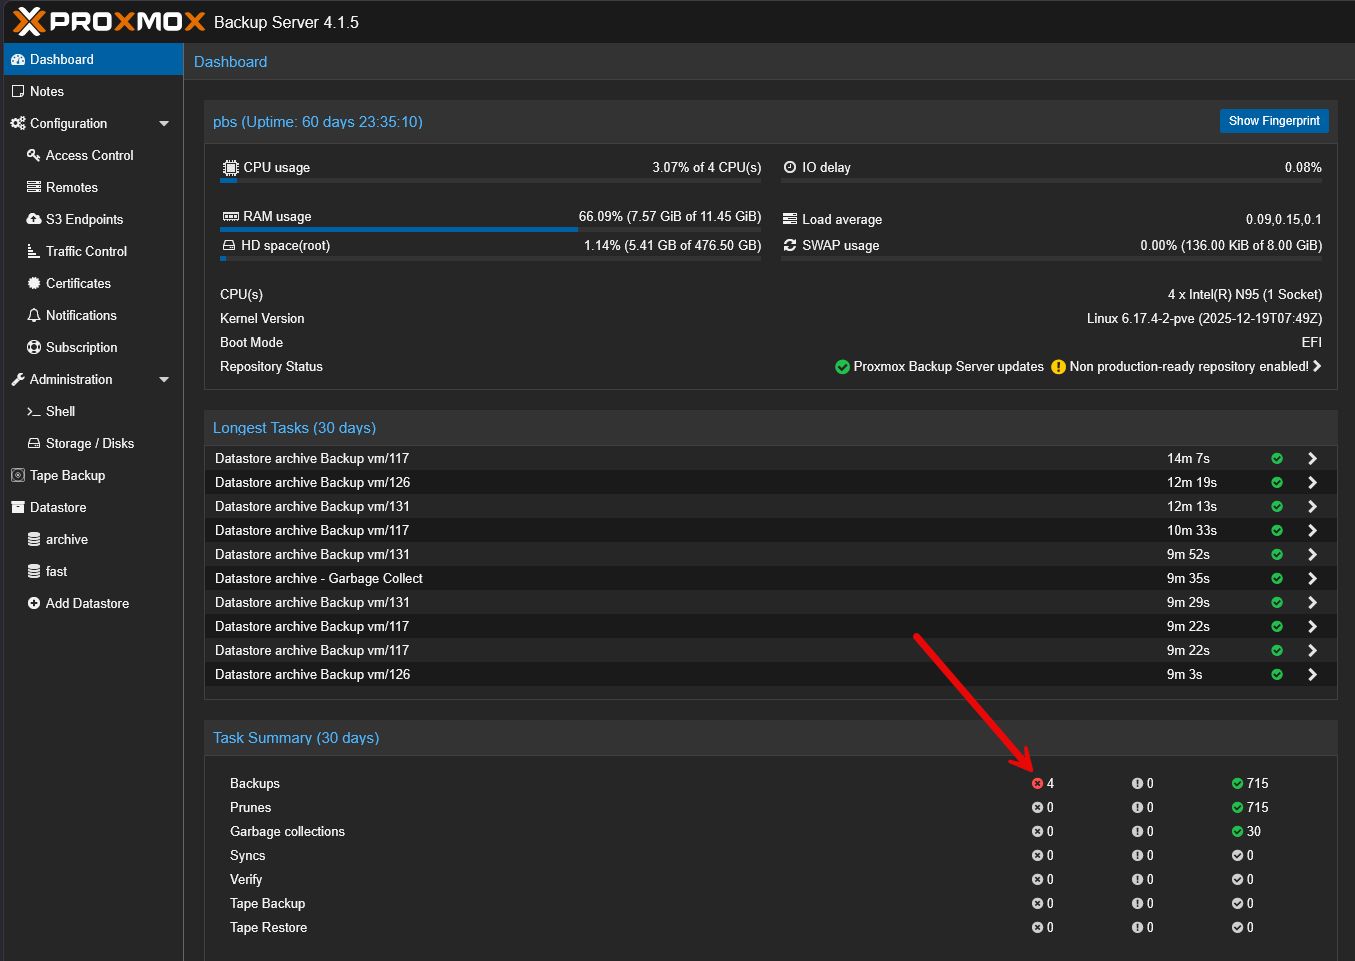
This is one that is super important. You want to make sure that your home lab backups have ran and they were successful. We all know this that backups can be successful and may not be able to be restored successfully. So, that is another check you need to make. But, first, it is still a good idea to make sure you aren’t getting error messages on your backups.
You need to check if the backup ran successful and the data size is similar to what you expect. If you are backing up 20 gigs worth of data, and your backup file is only 5 MB, there is probably something wrong there.
Again, make sure you test that even successful backups can restore. That is something that I learned the hard way with Kubernetes backups recently. Everything looked fine until I needed to restore something. But I still think the quick spot checks are the first line of defense.
Check out the following checks that you should do daily:
| Category | Check | How to check | What to look for |
|---|---|---|---|
| Jobs | Job is success | Backup UI or logs | Jobs completed without errors |
| Errors | Failure messages | Backup logs or alerts | Authentication failures, job errors |
| Storage capacity | Backup storage usage | Storage dashboard or CLI | Enough free space, no full volumes |
| Snapshots | Snapshot creation | Backup tool or storage system | Snapshots being created on schedule |
| Retention | Retention policies | Backup configuration and logs | No unexpected deletions |
| Backup size | Data size consistency | Look at backup sizes | Backup size is in line with expected data |
| Recoverable? | Test restores | Test one of your backups to restore them | Data can be successfully restored |
Check disk space and resource creep
When it comes to a predictable problem in a home lab, disk space issues are always up there as one of the most common. This issue almost always comes up due to the slow accumulation of old VM disks, unused container volumes, logs growing over time, backup retention not applying when it needs to or as expected.
I make it a habit to check:
- Ceph pool usage
- Local disk usage on hosts
- Any volumes that are unexpectedly large
In container environments, this is especially important. Docker can accumulate unused images and volumes quickly if you are testing and iterating often. But, resource creep is not just about disk space. It also includes things like:
- Memory use
- CPU usage
- VMs or containers that are no longer needed
Catching this early helps you avoid sudden issues where something stops working because a disk filled up or a node ran out of resources. Check out the following daily checks as part of your checklist:
| Category | Check | How to check | What to look for |
|---|---|---|---|
| Ceph storage | Pool usage | ceph df or Proxmox UI | Pools are close to capacity or uneven |
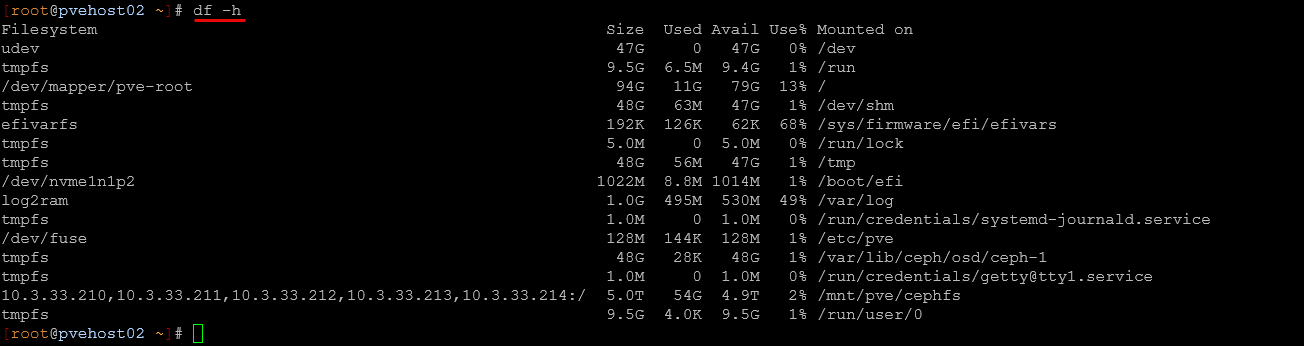
| Host storage | Local disk usage | df -h on hosts | High usage or disks close to full |
| Container storage | Docker usage | docker system df | Unused images, volumes, or excessive usage |
| Log growth | Log file size | /var/log, journald, or logging tools | Logs consuming excessive space |
| Backup storage | Retention behavior | Backup UI or storage view | Old backups not being cleaned up |
| Memory usage | RAM consumption | Proxmox UI, free -h, or monitoring tools | High or steadily increasing usage |
| CPU usage | CPU load | Proxmox UI, top, or htop | Constant high CPU or spikes |
| Resource cleanup | Unused workloads | Proxmox UI or container tools | VMs or containers no longer needed |
Quick network checks
Another issue can be networking problems. These are some of the worst sometimes to troubleshoot. But quick little sanity checks every day can help you catch issues before these are difficult to find or diagnose. Most of us have uptime monitors that help us know if services go down when we don’t expect them to and that helps us to be proactive. But I still perform a few quick sanity checks like:
- Can I reach key services
- Are there any obvious latency issues or speed issues
- Does everything feel normal or sluggish?
With VLANs, bonds, or more advanced networking, this becomes even more important. Misconfigurations or partial failures can cause issues that are hard to trace later. Sometimes this step just means opening up your Gitlab instance, or your HomeAssistant dashboard and make sure things come up and are populated.
Daily checklist of your network:
| Category | Check | How to check | What to look for |
|---|---|---|---|
| Reachable? | Uptime Kuma or manually look at services | Browser, curl, or ping | Services respond as expected |
| Connectivity | Network reachability | ping, traceroute, or mtr | No packet loss or routing issues |
| Latency | Response times | ping or monitoring tools | Higher than normal latency |
| Throughput | Network speed | iperf, file transfers, or monitoring | Slower than expected speeds |
| User experience | General responsiveness | Access apps and dashboards | Sluggish or delayed responses |
| VLAN configuration | VLAN health | Switch config, Proxmox bridge settings | Correct tagging, no misconfigurations |
| Monitoring alerts | Uptime checks | Monitoring system dashboards | Any recent outages or alerts |
Wrapping up
Most problems in the home lab come from little issues that go unnoticed until they are bigger. I like having a daily checklist of things like this to go from being reactive to proactive. Then, you will likely catch things as they are a much smaller problem and before they grow to be major and take things offline or services down. If you are running a mix of Proxmox, Ceph, containers, or other technologies, having a routine is key. It doesn’t have to be complicated, but consistent. how about you? Do you have a routine checklist like this you do in your home lab environment? Let me know in the comments.
Google is updating how articles are shown. Don’t miss our leading home lab and tech content, written by humans, by setting Virtualization Howto as a preferred source.
About The Author


Hello,
I have a quick question: why not have your various checks performed by a monitoring tool?
Between Centreon, Zabbix, and other similar tools, this could be practical and allow you to visually access all the information.
Tarlak,
Thank you for the comment and you are right, good monitoring is essential for keeping a check on things. I am old school. No matter how much monitoring I have on environments, I have found that my gut instinct is usually better than monitoring tools. When you get to know your environment, going through some of these routine quick checks has actually surfaced things that monitoring missed. But definitely a great shout here. Good monitoring and good routine checks I think go hand in hand.
Brandon