



A fresh installation of Proxmox is very complete out of the box and you definitely won’t have any problems with your server just sticking with the default installation. However, there are some additional packages that I find that are super helpful for me to install on my new Proxmox installations. If I were building a new Proxmox server this weekend, these are the 7 packages I would install.
1. lm-sensors
One of the first things I want visibility into on any physical Proxmox host is temperature. For most of us with a home lab, we don’t have a temperature controlled data center that is properly cooled and controlled like an enterprise environment. Also, even though mini PCs are compact and efficient, they usually have very small enclosures where heat can still build up. So, with that said, keeping an eye on our physical hardware temps is super important.
So, there is a package that is needed for us to keep an eye on the temps across the board. That package is the lm-sensors package. Getting it installed is as easy as the following two commands:
apt update
apt install lm-sensors -y
After installing it, I normally run the command below to detect sensors, but I think it also is ran automatically after the installation:
sensors-detectThen you can run sensors:
sensors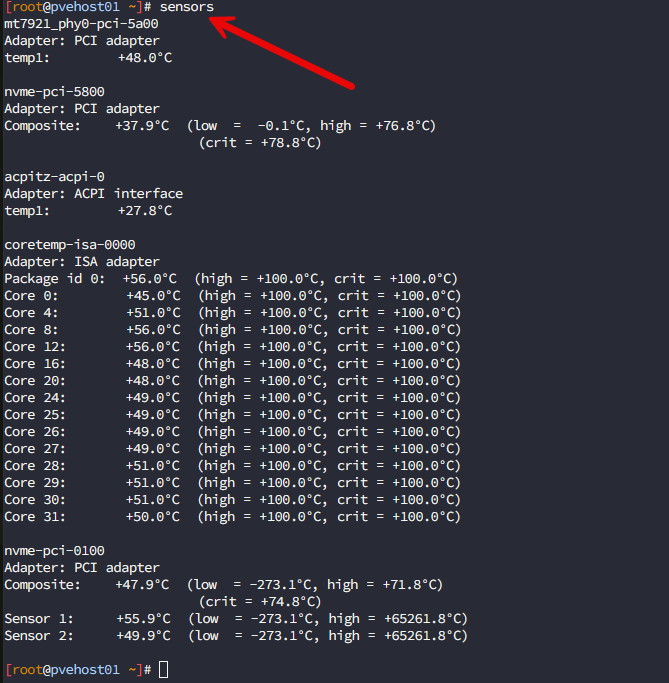
As a note. I also use Pulse for my Proxmox monitoring. With Pulse, if you have the lm-sensors package installed, it will be able to also pull in this information into your monitoring dashboard. And, more importantly, this will allow you to alert on your temperatures of your Proxmox hosts if these pass any thresholds you define.
This kind of information is also really good to see as well if you notice that your mini PC seems to be throttling unexpectedly. Sometimes performance issues aren’t related as much to the CPU being inadequate, but could be due to throttling happening with high temperatures.
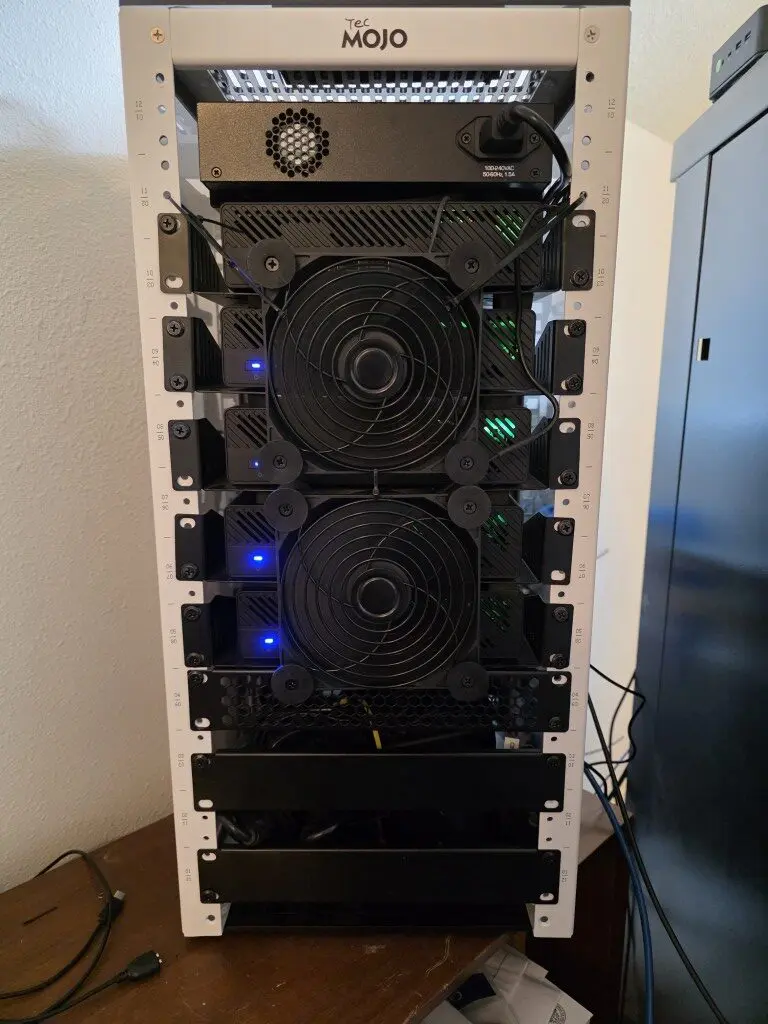
For my compact Proxmox nodes in the home lab, I consider temperature visibility to be a mandatory metric that I want to have visibility to. Check out my mini rack cooling mod that I have in place which helps quite a bit to make sure heat doesn’t build up and linger: How I Fixed Heat Buildup in My 10-Inch Mini Rack with a Simple Cooling Mod.
2. nvme-cli
If you have NVMe drives installed into your Proxmox VE Server host, then there is another tool that I like to have available on my Proxmox hosts: nvme-cli. This is a handy tool for viewing information about your NVMe drives in your Proxmox host.
Install it with:
apt install nvme-cli -yThen I can start by listing the NVMe devices:
nvme list
You can also take a look at the details for the NVMe drive directly and query the SMART information from the drive. For example
nvme smart-log /dev/nvme0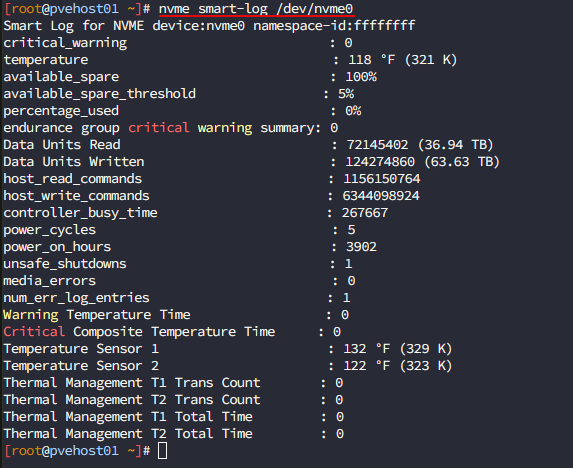
As you can tell from the output of the above command, you can see a lot of useful things here. These include stats like the temperature, percentage used, data written, power-on hours, unsafe shutdowns. You can also see media errors and other warnings that might be critical.
I bought some Micron 7300 MAX drives for my Ceph configuration. This command is great when you purchase used drives from eBay or other sources as you can confirm the seller was honest about the life of drives if they advertise this as part of their listing.
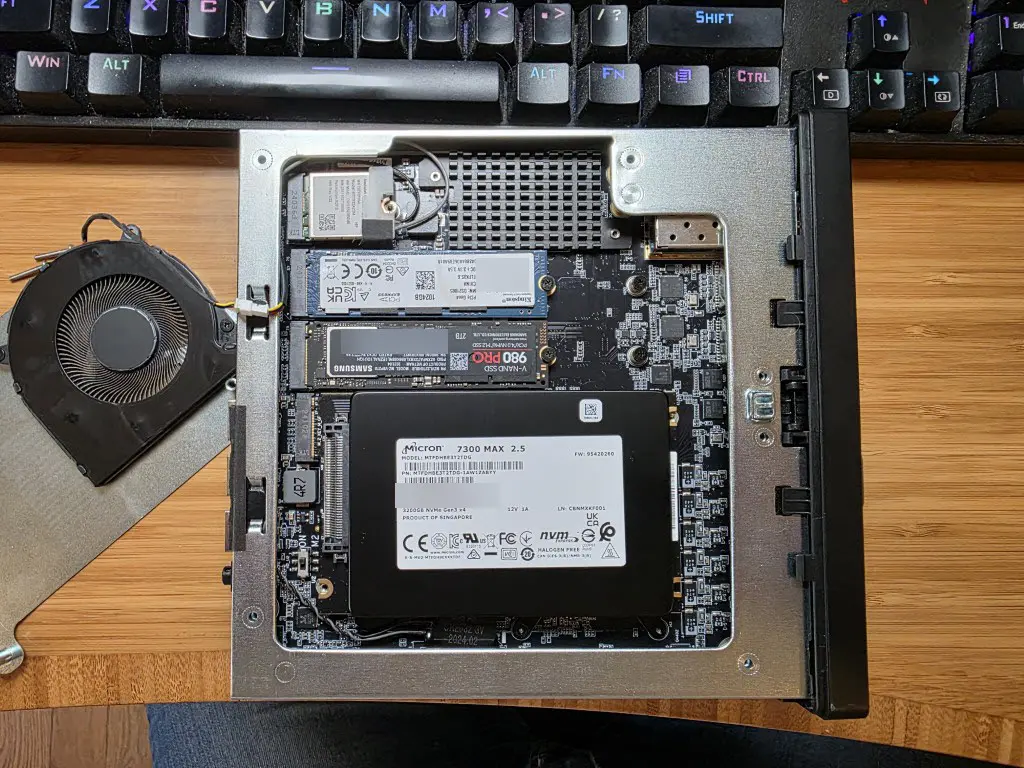
Also, I like to keep a baseline on systems with this command. If you have for instance a Proxmox node that is baselining 15-20 degress higher than all the other Proxmox nodes in your cluster, there may be something going on there. It could have an issue with airflow or a heatsink that has come loose, etc.
3. smartmontools
So, the next command provides additional tools for your hard drives in your Proxmox environment on your host. While the nvme-cli tool is great for NVMe drives, you may have spindles or something else installed in your Proxmox host. That is where the toolset found in smartmontools comes into play.
You may have SATA SSDs, spindles, boot drives, passthrough disks, or some other type of local hard drive storage in your PVE host that you want to see SMART data on. You can install it with this command:
apt install smartmontools -yThe particular command that I use constantly is the following
smartctl -a /dev/sdaBelow is me runnning the command on /dev/sda but you can replace that with any other drive identifier.
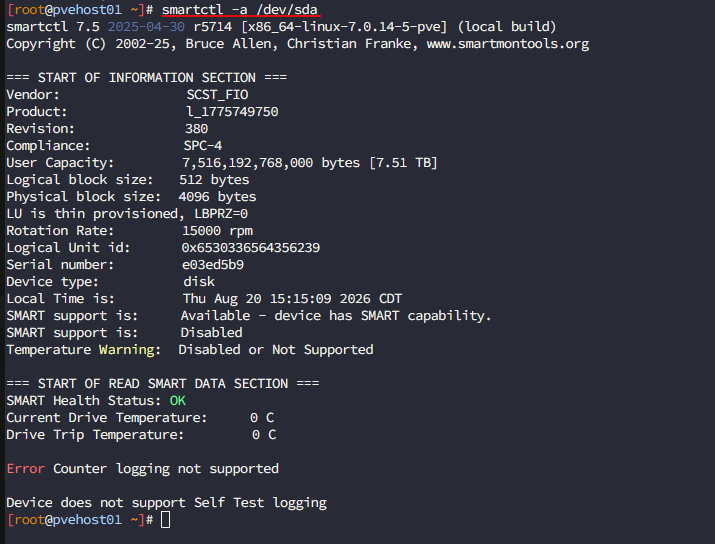
This command will give you SMART information from the drive. You will see things like health status, temperature, hours of operation, errors, and other attributes.
You can also run tests with the “-t” flag and tell it whether or not you want to run a short or long test.
smartctl -t short /dev/sdaor:
smartctl -t long /dev/sdaSo this is a great one to keep in the back pocket since it allows you to make sure you have visibility on the health of your drives in the Proxmox host. If you have IO delay that is creeping up or some other weird performance issues, you could have a storage drive that is flaking out on you. This is a great tool to start with.
4. iperf3
Keeping a check on network performance is also super important. I don’t think I have ever had or operated a home lab for very long without launching and using the iperf for network performance testing and troubleshooting.
apt install iperf3 -yIts job is simple. It measures network performance between two systems. On one server, I can start an iperf3 server using this command:
iperf3 -sThen from another system, I can use this command to connect to the “server” part of the iperf configuration and test performance in between.
iperf3 -c 10.10.10.20This is a great command to validate a lot of different things in the environment from a network perspective. Especially if you are using HCI storage with Ceph, iperf is a great way to make sure that you can validate you are getting the full amount of bandwidth in your environment.
Also, a healthy network is the key behind things like Live migration, cluster communication, and traditional storage communication like iSCSI and NFS storage. This helps to validate that once you start using 2.5 GbE or 10 GbE that you are getting the full amount of throughput that you think you are. If I have two Proxmox hosts that just “feel” like they are suspiciously slow when they shouldn’t be on the networking side, a quick iperf3 test can validate at least the problem is not with the network.
5. ethtool
If you do suspect something is wrong on the networking side of things, installing the ethtool on your Proxmox host is a great way to dive a bit deeper on the network side and make sure you see the settings and configuration on your interface that you expect. You can use ethtool to inspect the interface and make sure you don’t spot any problems with things like:
- Speed
- Duplex
- Auto-negotiation
You can install it with the following:
apt install ethtool -yThen I can inspect an interface by feeding it the interface you want to inspect:
ethtool nic3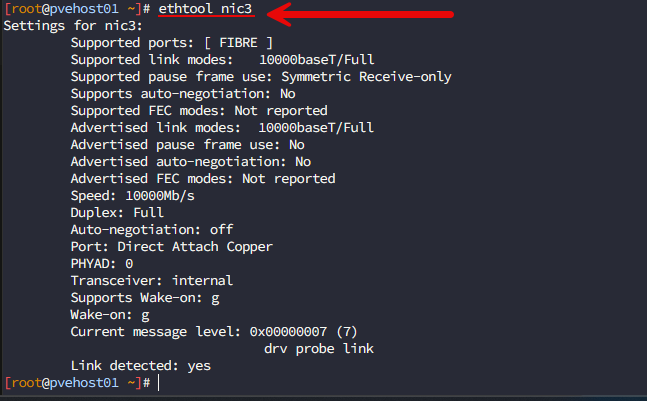
As a quick scenario where this is super helpful is when you may suspect your connection may have negotiated down in speed. If you have a 10 gig interface you can quickly use the ethtool to see if it negotiated down to 1 Gbps.
You can also add the “-i” parameter to get the driver and firmware information for your connection:
ethtool -i nic3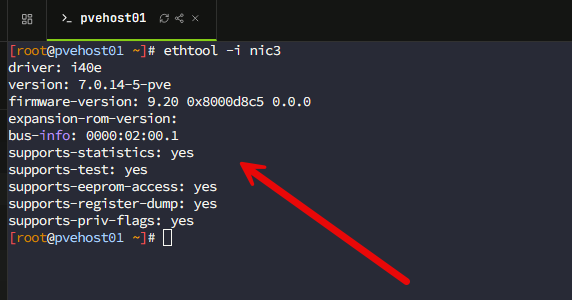
Offload settings are another critical component when you are troubleshooting network performance or need to validate the configuration. You can see offload information with the “-k” parameter:
ethtool -k nic3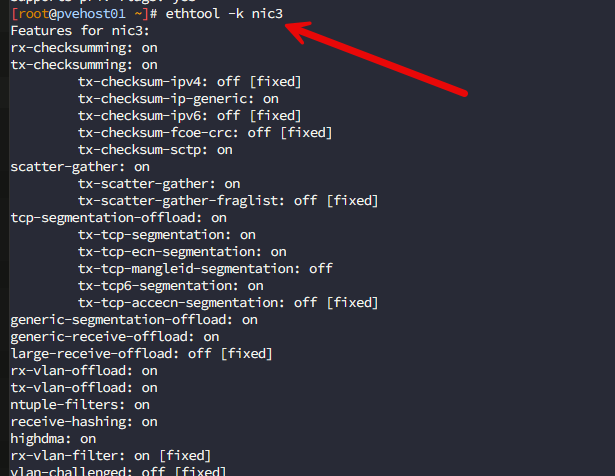
With this command, you can see things like checksum offloading, TCP offload, generic segmentation offload, etc. I don’t recommend randomly disabling offload features because somebody on a forum said it fixed their network. But if you are troubleshooting a very specific performance issue, this might be helpful.
6. NUT if the server is connected to a UPS
Like many of us in the home lab, you may have your Proxmox VE Server host connected to a UPS. If that is the case, you probably want some form of UPS monitoring and automated shutdown capability. One of the best ways to accomplish this in Linux is by using Network UPS Tools or NUT.
You can install it using:
apt install nut -yThis is probably one of those tools and installs that you might think is unnecessary right up until the first power outage you experience in your home lab. Proxmox VE is different from a basic desktop PC. If you have an unexpected shutdown, it may take down multiple VMs, your containers, DBs, storage, etc.
We like to say the “blast radius” is much larger when you are running multiple servers or workstations on a single piece of hardware. But this is both the strength and weakness associated with virtualization. Also, when you have consumer grade NVMe drives and other storage, these generally don’t have any kind of power loss protection built-in. That means they aren’t nearly as robust when it comes to flushing data to disk. What this boils down to is that you are WAY more likely to have data corruption if things just go down all of the sudden and “dirty”.
So, think of it this way, backups protect your data when you lose something or something gets corrupted. But, a UPS and proper shutdown automation can help you to prevent the problem in the first place, at least associated with power events.
7. ProxMenux
There is one final thing that I always install on a fresh Proxmox host that is different from everything else on this list. That something is ProxMenux. This tool is not just another diagnostic command. But, instead, it is an open-source, menu-driven solution that allows you to have a lot of visibility locally on things like your Proxmox host, hardware health, VMs and containers, and other performance metrics and data.
Check out my full blog post on how to get ProxMenux installed and how to use it here: Meet ProxMenux Monitor: The New Way to Monitor Proxmox Servers.
Once you have ProxMenux installed, you can run it with the simple command:
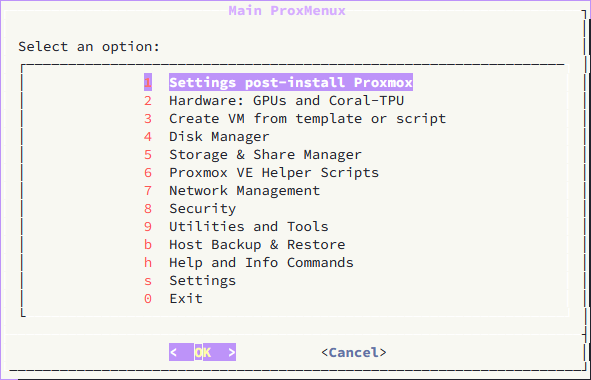
menuIt gives you a TUI of sorts that you can work through to do various things from:
- Settings post-install configuration
- Hardware GPUs and Coral-TPU
- Create VM from template or script
- Disk Manager
- Storage and Share Manager
- Proxmox VE Helper Scripts
- Network Management
- Security
- Utilities and Tools
- Host Backup & Restore
Also, you get a pretty slick monitoring interface that runs on port 8008 after you install the ProxMenux solution on your Proxmox VE Server.
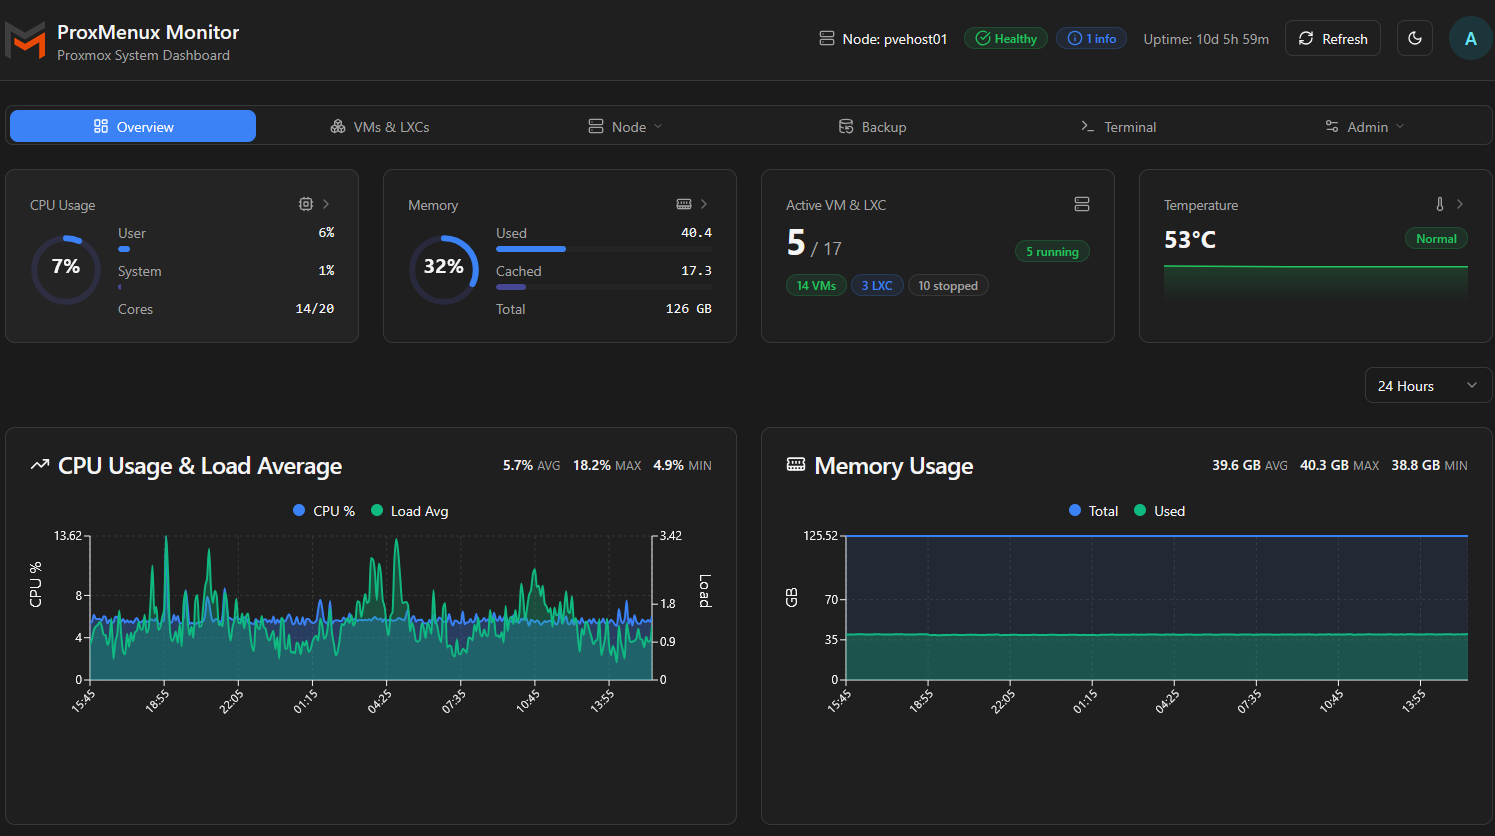
I know that many may be reluctant to install something like this on your production Proxmox hosts and I probably wouldn’t install this on a prod host, but for home lab, I have found it to be helpful and useful across various fronts. It is super convenient to have something locally like this that gives you all of these capabilities locally. It is actively maintained and developed which I really like as well.
Wrapping up
Hopefully, these 7 things I’d install first on a brand new Proxmox VE Server might get you to thinking about what tools are actually helpful when you install a new Proxmox host. Linux has a lot of great commands already built in, but these are a few that I have found come in super handy in the home lab managing things and keeping an eye on the health of my servers or when troubleshooting. What about you? Do you install any tools in particular in Proxmox? Let me know in the comments.
More in this topic


Google is updating how articles are shown. Don’t miss our leading home lab and tech content, written by humans, by setting Virtualization Howto as a preferred source.
About The Author

Excellent article. Extremely useful!
I follow your work and think it’s amazing!
Keep it up!
Best regards
Marcos,
Thank you so much for the kind words! It means a lot and honestly the community is what keeps me going creating content. Thank you again Marcos and take care!
Brandon