Many great free and open-source monitoring solutions are available for monitoring your servers and applications. In case you have not heard about the free and open-source monitoring solution, Prometheus, we will look at the Prometheus node exporter to scrape metrics and monitor both Linux system metrics and Windows system metrics. Let’s take a look at server monitoring with Prometheus and Grafana.
What is Prometheus?
First, what is Prometheus, and how can we use it for monitoring? Prometheus is an open-source monitoring and alerting solution originally built at SoundCloud. Since the development of Prometheus, many have adopted the solution, and it is actively being developed along with a strong user community.
The project is solely free and open source and is no longer associated with any organization. Prometheus is now part of the Cloud Native Computing Foundation as of 2016 as the second hosted project, after Kubernetes.
It can be used to monitor all types of infrastructure – Linux, Windows, Docker, containers, Kubernetes cluster environments, batch jobs, etc.
Setup Node Exporter on Kubernetes cluster
You can monitor arguably anything with Prometheus and Node Exporter. It is an especially popular solution to monitor Kubernetes cluster environments by installing the Kubernetes components and Node Exporter daemonset. You can create a Node Exporter namespace, etc, and install the components using Kubernetes manifests.
What is the Prometheus Node Exporter?
Prometheus Node Exporter is written for Linux systems and NIX kernels and exposes hardware and kernel-related metrics so these can be scraped with Prometheus for monitoring purposes. So, Node Exporter is only written for Linux server systems, including 32-bit and 64-bit Linux amd64. With the Prometheus Node Exporter metrics, you can expose the following example metrics specific to the system:
CPU load
Node metrics
Network statistics
Memory usage
TCP resources
Boot time
CPU time spent
There are default-enabled collectors that are defined in the monitoring spec and metrics related to many different areas of the system.
Node exporter can be run as a Docker container or installed on the remote Linux systems you want to manage. Configuring Node Exporter is fairly easy as well and is referenced in the Prometheus configuration file.
See the official documentation here: Monitoring Linux host metrics with the Node Exporter | Prometheus
What can you monitor with Node Exporter?
There are many different “versions” of Node Exporter. While the primary version is written for NIX systems, a Windows Exporter allows you to export key performance indicators for your Windows Systems.
How to enable collectors
Collectors define which data you can pull from the target operating system. This also varies by the operating system itself.
Collectors are enabled by providing:
a –collector.<name> flag.
Collectors that are enabled by default can be disabled by providing a –no-collector.<name> flag.
To enable only some specific collector(s), use –collector.disable-defaults –collector.<name> …
How can Prometheus metrics be used in Splunk?
This Splunk add-on provides two modular inputs to ingest Splunk metrics from Prometheus:
A scraping input which polls a Prometheus exporter and indexes all exposed metrics in Splunk.
It is also designed to be able to poll a Prometheus servers for metrics gathering
Look at the official documentation here: GitHub – lukemonahan/splunk_modinput_prometheus: A Splunk modular input for ingesting Prometheus metrics
What is Grafana Server monitoring?
Grafana is an open source solution that works with Prometheus server to take data source and display these as a beautiful dashboard to easily create an open source monitoring system. You can take multiple data sources from Prometheus server or even the same server and present all the metrics as charts and graphs.
With Grafana, you can graph the following from your Linux server or Windows Server, using the installed Prometheus and Node Exporter installations.:
Disk space
memory utilization
OS metrics
Existing metrics
Configure Prometheus and Node Exporter metrics cAdvisor Grafana
Let’s look at how to install Prometheus and Node Exporter metrics along with cAdvisor and Grafana. To configure both Prometheus, install Grafana, and Node Exporter using Docker, we can use a Docker Compose file to do this:
version: '3.8'
networks:
  monitoring:
    driver: bridge
volumes:
  prometheus_data: {}
services:
  node-exporter:
    image: prom/node-exporter:latest
    container_name: node-exporter
    restart: unless-stopped
    volumes:
      - /proc:/host/proc:ro
      - /sys:/host/sys:ro
      - /:/rootfs:ro
    command:
      - '--path.procfs=/host/proc'
      - '--path.rootfs=/rootfs'
      - '--path.sysfs=/host/sys'
      - '--collector.filesystem.mount-points-exclude=^/(sys|proc|dev|host|etc)($$|/)'
    ports:
      - 9100:9100
    networks:
      - monitoring
  prometheus:
    image: prom/prometheus:latest
    user: "1001"
    environment:
      - PUID=1001
      - PGID=1001
    container_name: prometheus
    restart: unless-stopped
    volumes:
      - ~/promgrafnode/prometheus/prometheus.yml:/etc/prometheus/prometheus.yml
      - ~/promgrafnode/prometheus:/prometheus
    command:
      - '--config.file=/etc/prometheus/prometheus.yml'
      - '--storage.tsdb.path=/prometheus'
      - '--web.console.libraries=/etc/prometheus/console_libraries'
      - '--web.console.templates=/etc/prometheus/consoles'
      - '--web.enable-lifecycle'
    ports:
      - 9090:9090
    networks:
      - monitoring
  grafana:
    image: grafana/grafana:latest
    user: "1001"
    container_name: grafana
    ports:
      - 3000:3000
    restart: unless-stopped
    volumes:
      - ~/promgrafnode/grafana/provisioning/datasources:/etc/grafana/provisioning/datasources
      - ~/promgrafnode/grafana:/var/lib/grafana
    networks:
      - monitoring
  cadvisor:
    image: gcr.io/cadvisor/cadvisor:latest
    container_name: cadvisor
    ports:
      - 8081:8080
    networks:
      - monitoring
    volumes:
      - /:/rootfs:ro
      - /var/run:/var/run:rw
      - /sys:/sys:ro
      - /var/lib/docker/:/var/lib/docker:ro
    depends_on:
      - redis
  redis:
    image: redis:latest
    container_name: redis
    ports:
      - 6379:6379
    networks:
      - monitoring
There are many ways to setup and configure node exporter. It can be provisioned as a Docker container running on your Linux host. It can also be installed as a single Prometheus binary you can install via the Linux amd64 tar.gz tarball and run a Prometheus service, using a Prometheus sudo systemctl. Download, extract, and run the installation with the following command:
wget https://github.com/prometheus/node_exporter/releases/download/v*/node_exporter-*.*-amd64.tar.gz
tar xvfz node_exporter-*.*-amd64.tar.gz
cd node_exporter-*.*-amd64
./node_exporter
Starting Prometheus Server
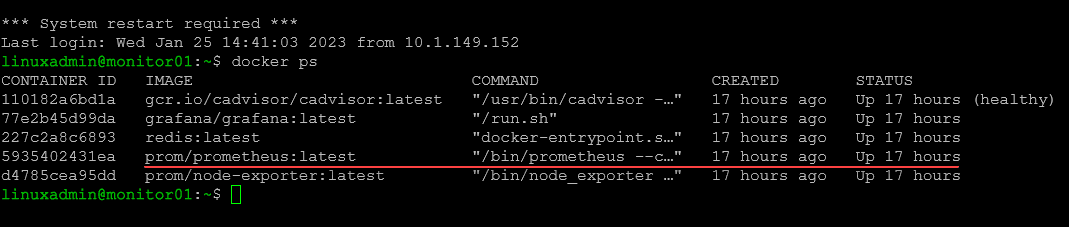
If you are running Prometheus server as a Docker container (which I highly recommend) starting the Prometheus Server is as simple as starting your Prometheus Server Docker container.
Running Node Exporter as a Service (Optional)
If you want to create a systemd service to run Node Exporter, you can do that. Create a new service file:
sudo vi /etc/systemd/system/node_exporter.serviceIn the service file, add the following:
[Unit]
Description=Node Exporter
After=network.target

[Service]
User=node_exporter
Group=node_exporter
Type=simple
ExecStart=/usr/local/bin/node_exporter

[Install]
WantedBy=multi-user.target
Prometheus configuration file
Your Prometheus configuration file is the file that directs Prometheus to the nodes you want to monitor with Node Exporter installed.
global:

  scrape_interval: 1m

scrape_configs:

  - job_name: "prometheus"

    scrape_interval: 1m

    static_configs:

    - targets: ["localhost:9090"]

  - job_name: "node"

    static_configs:

    - targets: ["node-exporter:9100"]

  - job_name: "cadvisor"

    scrape_interval: 5s

    static_configs:

    - targets: ["10.1.149.19:8081"]

  - job_name: "hvhost01"

    scrape_interval: 5s

    static_configs:

    - targets: ["10.1.149.191:9182"]
Prometheus and Node Exporter architecture
Prometheus and Node Exporter work together. You can run Prometheus and Node Exporter on the same box as one another. However, most likely you will want to run Node Exporter on many other remote Linux hosts.
Once you have Node Exporter installed, you reference the Node Exporter instance in your Prometheus configuration file and all the nodes you want to monitor. These may be Linux virtual machines running in your environment.
Prometheus will collect data from the Node Exporter http endpoint located on your remote Prometheus instances. You can enabled additional collectors and gather the metric needed and access these with Prometheus.
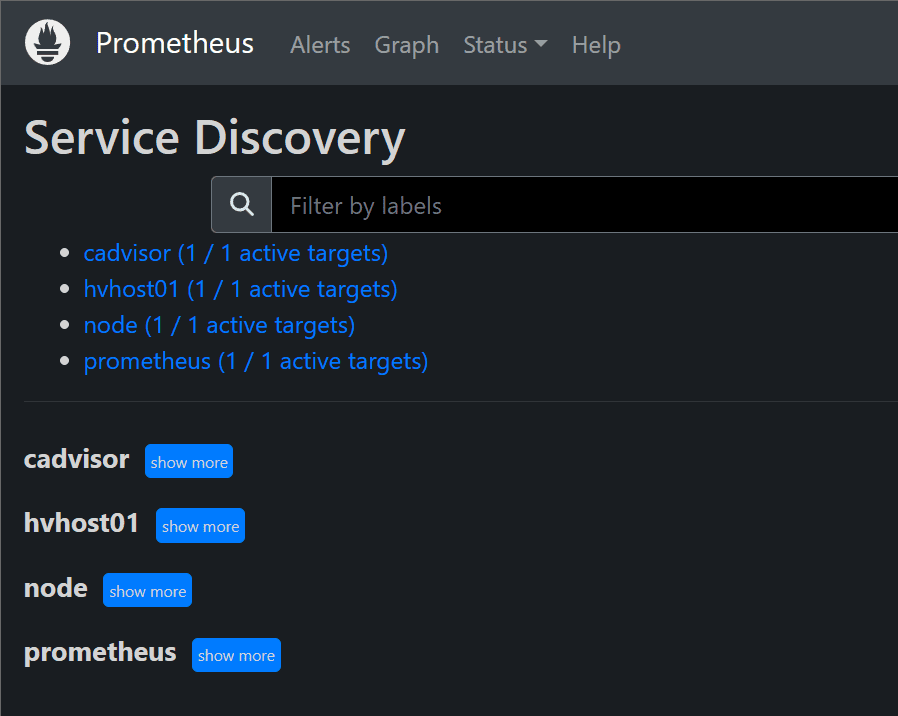
The Prometheus UI allows you to view your service discovery and test your targets added to the Prometheus config. In the Prometheus configuration file, you define the endpoint and the port for connecting your Prometheus server to the Node Exporter instance configured. Again, you can verify your connection in the Prometheus user interface.
Below is the service discovery screen in the Prometheus UI.
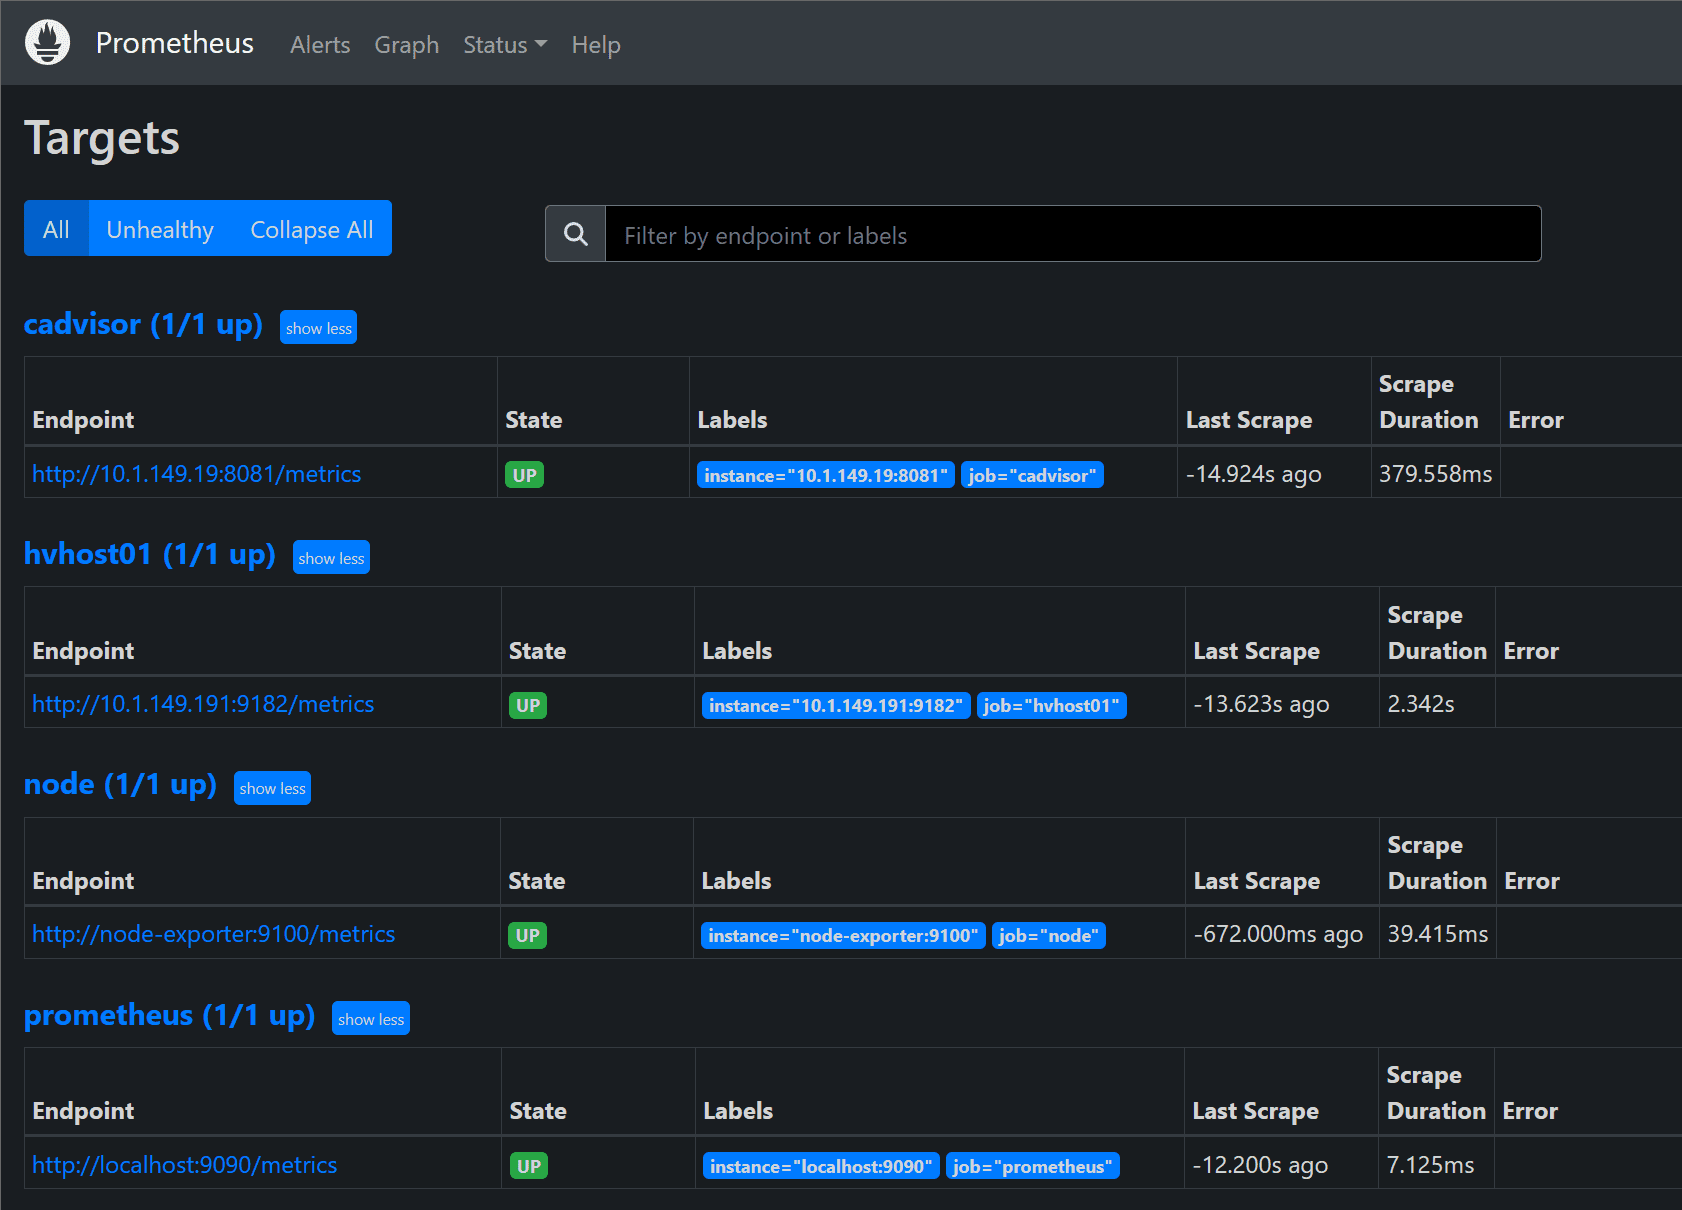
The targets screen is great for troubleshooting connectivity to your Node Exporter endpoints. The State shows the state of the connection. You will see the status of the last scrape attempt.
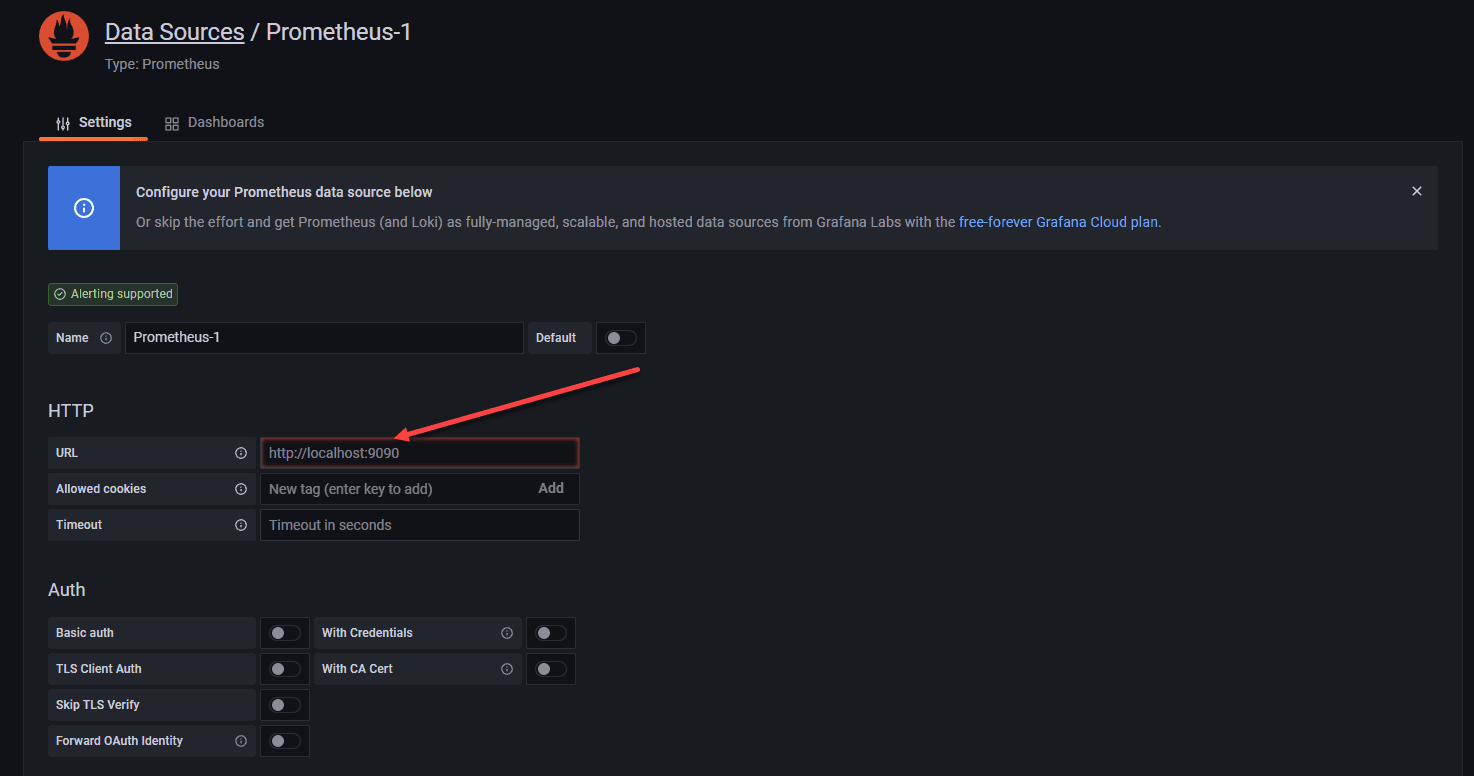
Configuring Grafana with the Prometheus Server monitoring URL
Once your containers are up and running, you must add your Prometheus data source to Grafana. Open Grafana, and click the settings cog in the lower left-hand corner. Then click Prometheus to configure Grafana with the URL of the Prometheus server.
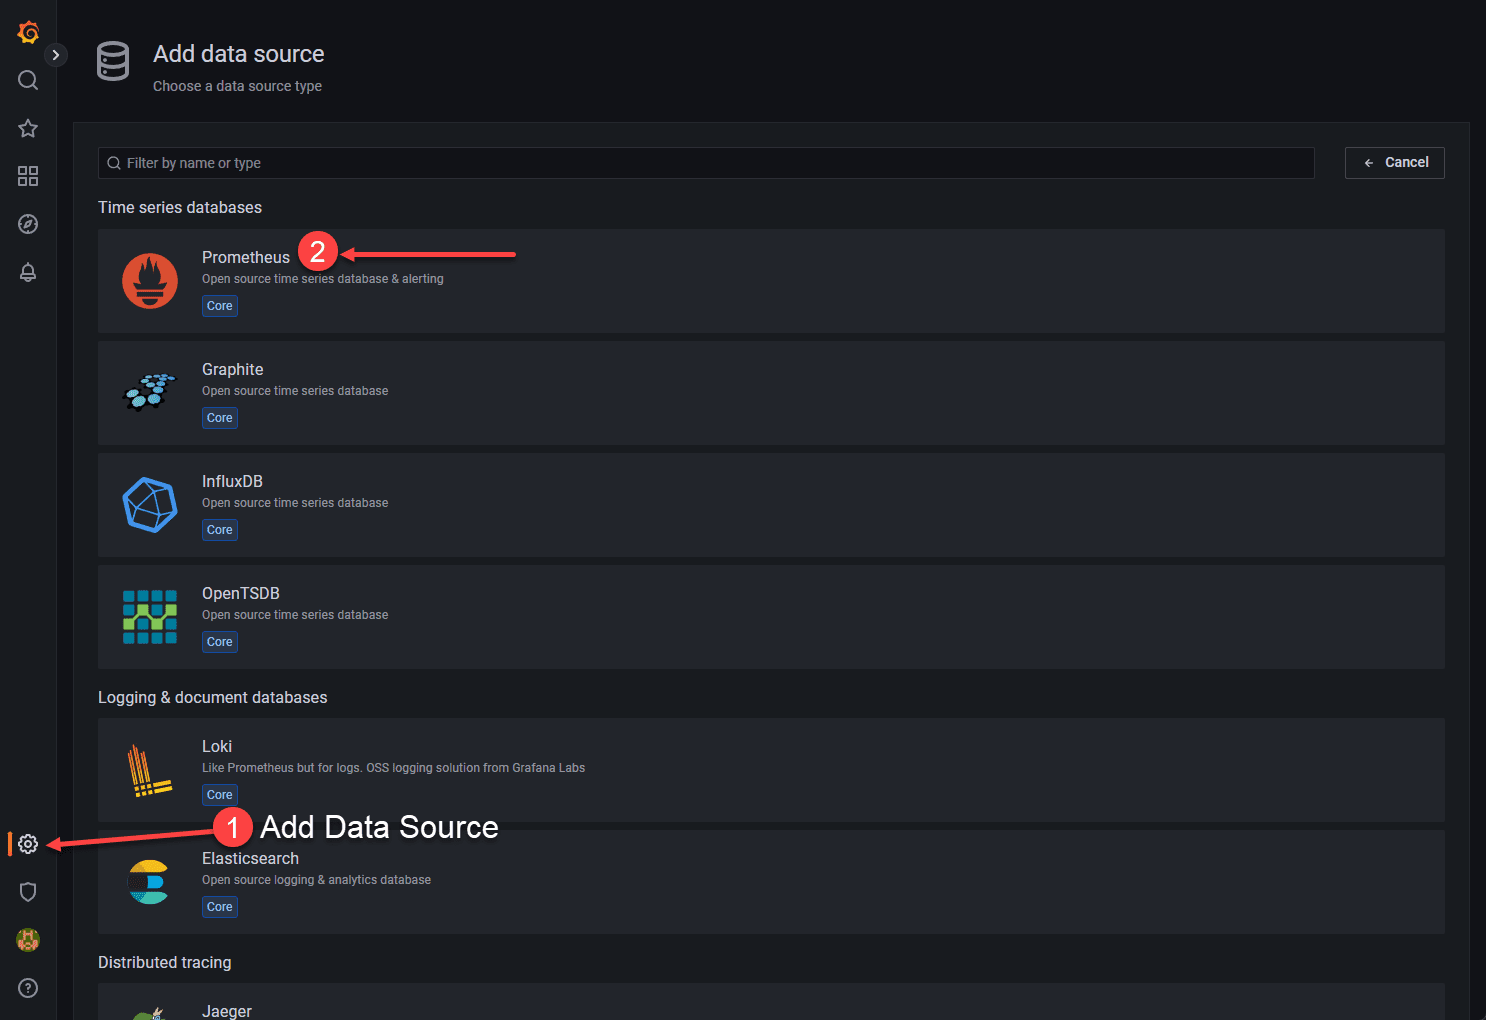
Add the IP and port of your Prometheus Server URL which pulls the metrics in the Prometheus format.
Visualizing Prometheus Node Exporter Metrics as Grafana Dashboards
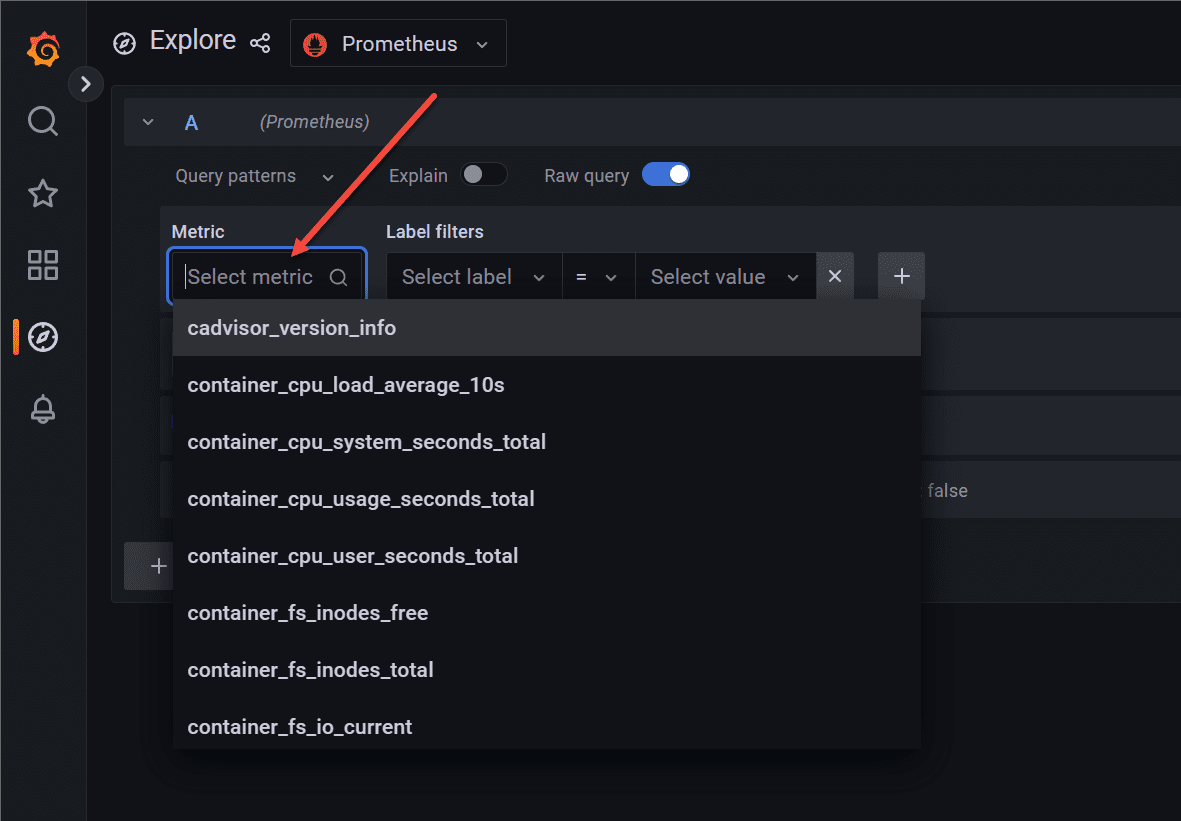
Using Prometheus Node Exporter with Grafana is a very popular way to easily create beautiful dashboards and use Grafana’s main expression bar to build Promql expressions to query the data ingested to Grafana by the Prometheus server. Dashboards allow you to easily visualize the output of the data you are collecting using the Node Exporter metrics.
Once you add your Prometheus instance, you will see metrics populated and use the powerful query language to write queries from the scraped metrics from your Linux machine.
Grafana allows you to view time series data view beautiful dashboards you can easily download from Grafana.com or git clone https repo. Below is the Node Exporter Full dashboard you can download from the link I have listed below.
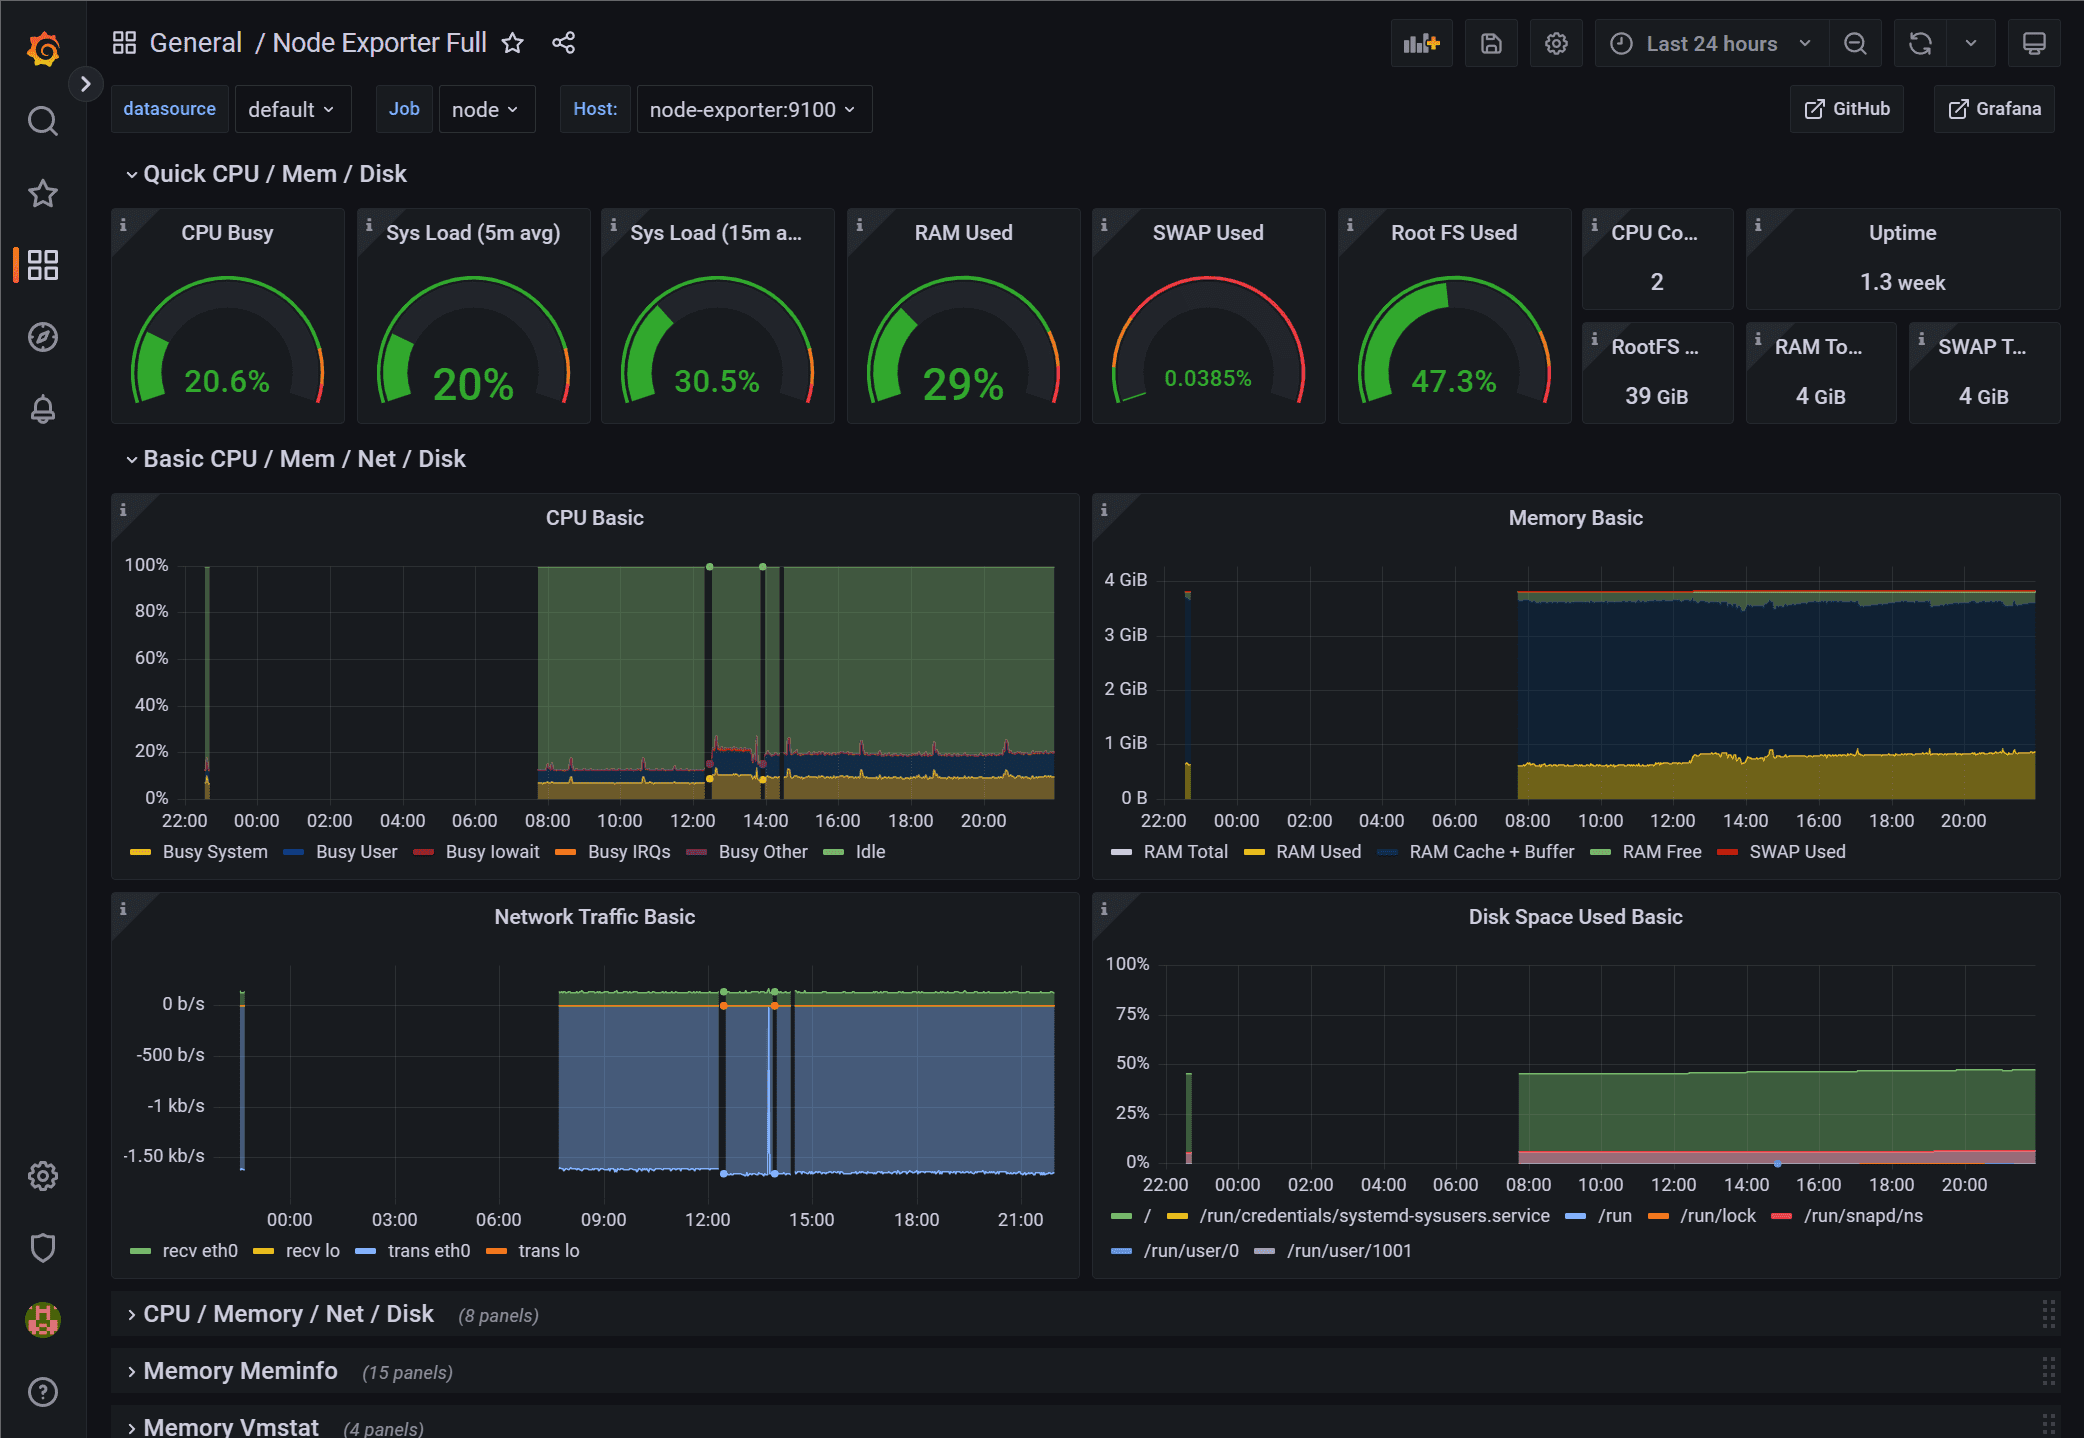
On Grafana.com, you can download IDs or JSON templates to create quick and easy dashboards, as it takes the heavy lifting out of the manual dashboard creation process. The dashboards are free to download, and generally, you can find what you are looking for using the Grafana dashboard search here:
https://grafana.com/grafana/dashboards/
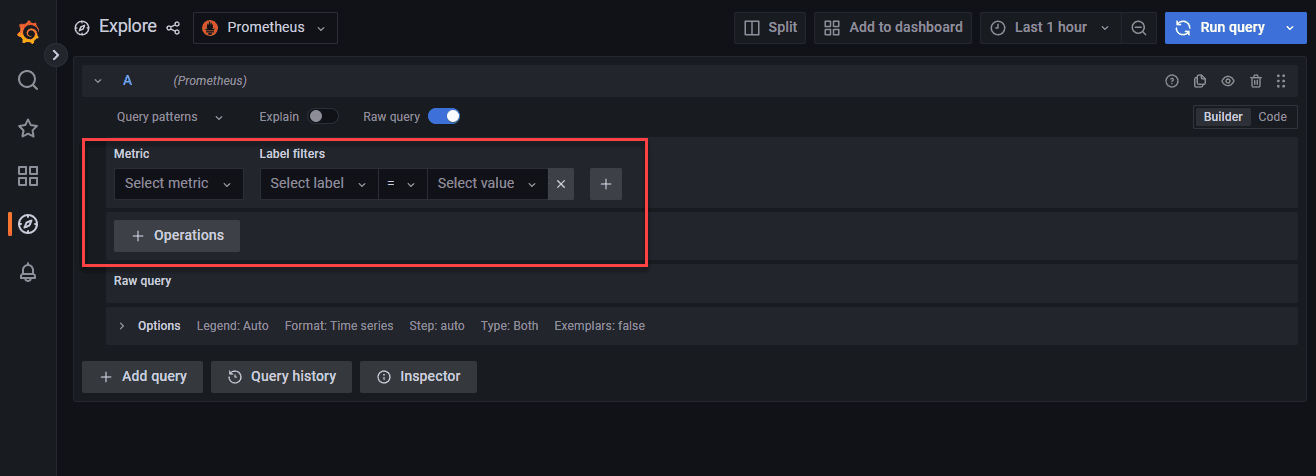
Expression Browser, Console Templates, and Grafana
Grafana has an expression browser that allows querying data.
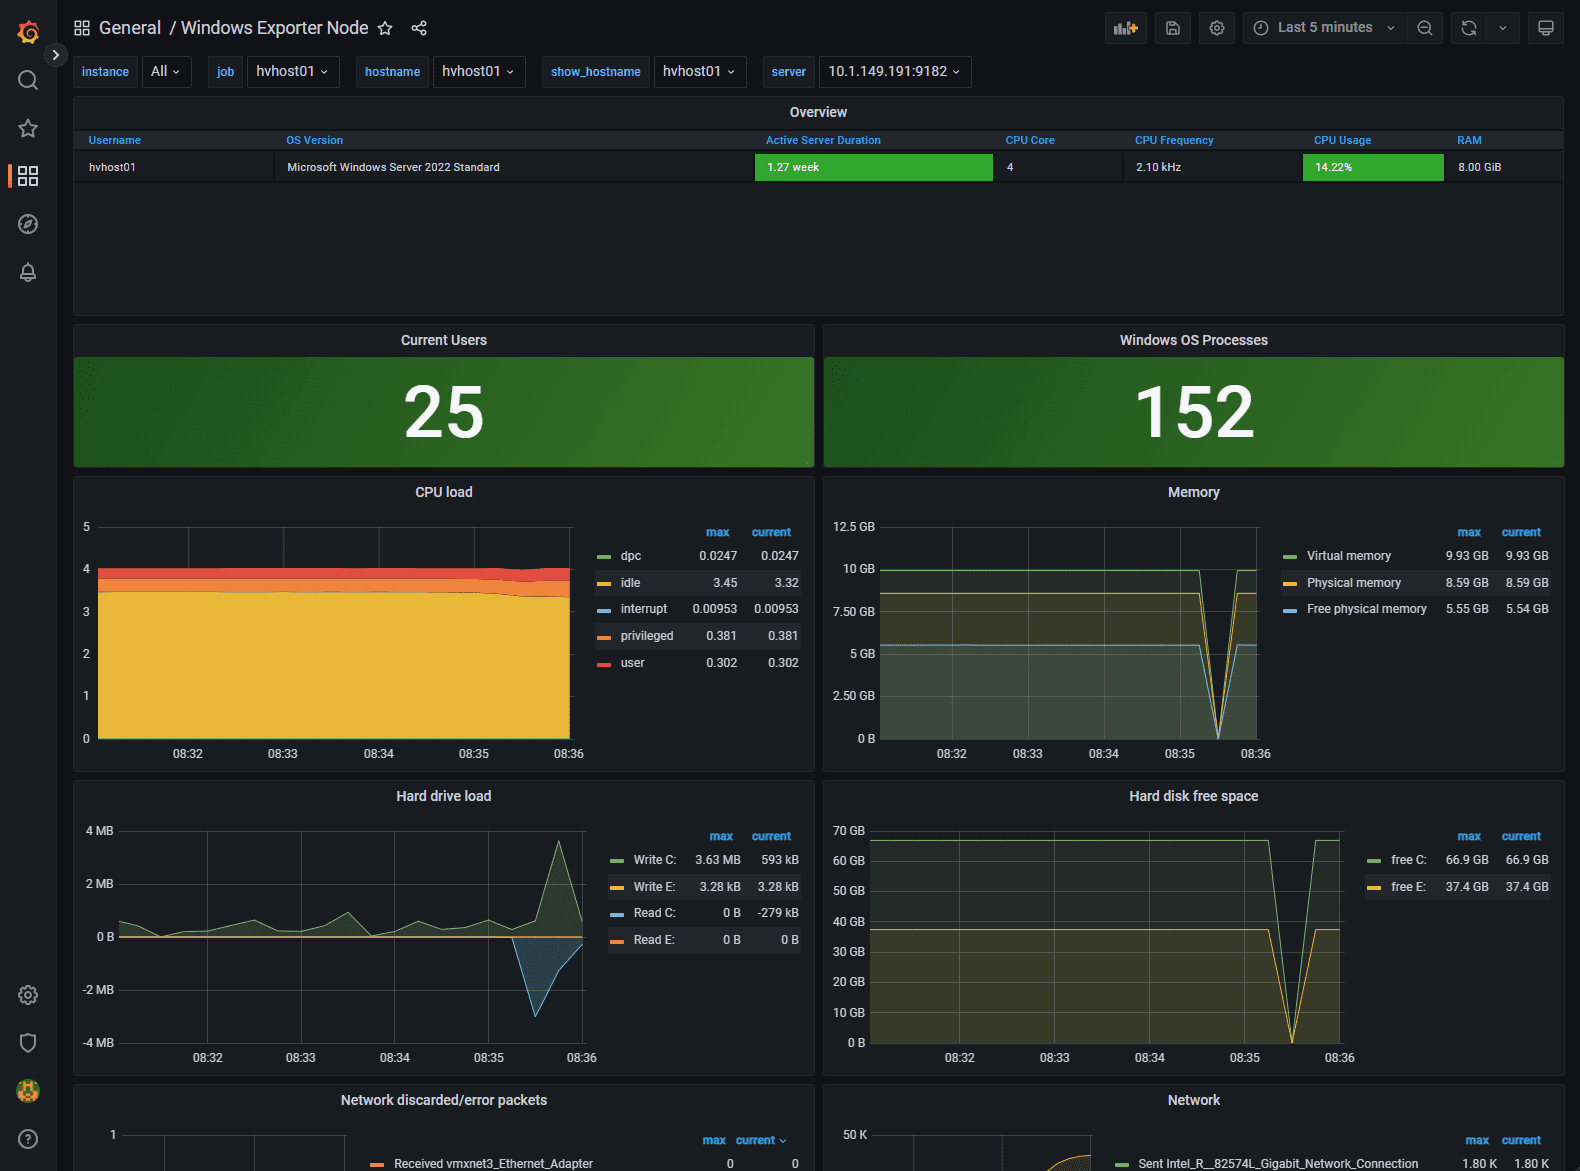
Windows Exporter
There is also a project to add the Node Exporter functionality to Windows. It is called Windows Exporter. It is an open-source project to add similar exporter features for the Windows operating system and allow you to have this capability in Grafana to visualize Windows metrics.
GitHub – prometheus-community/windows_exporter: Prometheus exporter for Windows machines
Below, we have added a Windows Server to Prometheus monitoring by installing the Windows Exporter.
Monitoring Docker
To Monitor Docker along with the general system metrics, you need to use an additional solution called cAdvisor. cAdvisor (Container Advisor) provides container resource usage and performance metrics for running containers.
It does this by collecting, aggregating, processing, and exporting information about running containers. For each container, it keeps resource parameters, resource usage (including historical), histograms, and network statistics. This data is exported by container and machine-wide.
You can Download cAdvisor here: google/cadvisor: Analyzes resource usage and performance characteristics of running containers. (github.com)
Below is the Docker compose code to spin up the cAdvisor containers needed, included Redis.
cadvisor:
    image: gcr.io/cadvisor/cadvisor:latest
    container_name: cadvisor
    ports:
      - 8081:8080
    networks:
      - monitoring
    volumes:
      - /:/rootfs:ro
      - /var/run:/var/run:rw
      - /sys:/sys:ro
      - /var/lib/docker/:/var/lib/docker:ro
    depends_on:
      - redis
  redis:
    image: redis:latest
    container_name: redis
    ports:
      - 6379:6379
    networks:
      - monitoring
Wrapping Up
Prometheus Node Exporter is a great tool to export key performance indicators for your Linux Servers, Docker containers, Kubernetes clusters, etc. You can also use the Windows Exporter tool to expose the performance and other metrics of Windows Servers to Prometheus and then have all of these visualized in Grafana.
With the expression browser, console templates, and Grafana, you can create a free and open source monitoring environment to monitor your servers.
Google is updating how articles are shown. Don’t miss our leading home lab and tech content, written by humans, by setting Virtualization Howto as a preferred source.
About The Author


Hi there,
I’m getting the following error:
Starting prometheus ... error
ERROR: for prometheus Cannot start service prometheus: failed to create shim task: OCI runtime create failed: runc create failed: unable to start container process: error during container init: error mounting "/root/promgrafnode/prometheus/prometheus.yml" to rootfs at "/etc/prometheus/prometheus.yml": mount /root/promgrafnode/prometheus/prometheus.yml:/etc/prometheus/prometheus.yml (via /proc/self/fd/6), flags: 0x5000: not a directory: unknown: Are you trying to mount a directory onto a file (or vice-versa)? Check if the specified host path exists and is the expected type
ERROR: for prometheus Cannot start service prometheus: failed to create shim task: OCI runtime create failed: runc create failed: unable to start container process: error during container init: error mounting "/root/promgrafnode/prometheus/prometheus.yml" to rootfs at "/etc/prometheus/prometheus.yml": mount /root/promgrafnode/prometheus/prometheus.yml:/etc/prometheus/prometheus.yml (via /proc/self/fd/6), flags: 0x5000: not a directory: unknown: Are you trying to mount a directory onto a file (or vice-versa)? Check if the specified host path exists and is the expected type
ERROR: Encountered errors while bringing up the project.
I’m getting the same error message. Did you ever figure out what the issue is?