In thinking through my monitoring needs and a few projects I have coming up in mind, I wanted to spin up a fresh monitoring stack using the “Tick” stack. Let’s look at the Tick Stack with Docker Compose example and see how you can easily spin up a monitoring stack.
Table of contents
What is a TICK Stack?
First of all, what is the Tick stack? The TICK stack is a suite of open-source tools that, when put together, allow processing and analyzing time-series data. It is a stack that was developed by InfluxData, known as InfluxDB. It is made up of four core components and associated technologies, which is where the acronym comes from:
Telegraf – agent for collecting and reporting metrics and events from various systems
InfluxDB – time-series efficient database store optimized for fast and efficient storage and retrieval of time-stamped data processing engine. It has a SQL-like query language that allows easy analyzing batch data. In InfluxDB you can delete unwanted data using InfluxQL commands such as DELETE or by dropping entire series, measurements, or databases.
Chronograf – provides an interface for visualizing and exploring data stored in InfluxDB, facilitating monitoring and alerting
Kapacitor – the native data processing engine for both stream and batch loads, is designed to process, stream, and analyze data in real time, enabling complex event processing and process alerts based on custom-defined rules and thresholds. It can also compute statistical anomalies in the data. Users can also provide user defined functions in the form of scripts match metrics. Kapacitor can use TICKscripts to tie sequential data and join and process multiple data streams, enabling complex event processing and correlation.
Together, these tools form a highly capable platform for handling time-series data for many different applications.
Why is the TICK stack helpful?
It provides a complete “stack” that handles various aspects of monitoring needs. When you put the four components together you can monitor and alert on just about anything. Also, the TICK stack is complemented with Grafana, which provides beautiful dashboards to help visualize the data contained in the TICK stack.
Docker Compose files
Now, let’s look at the Docker Compose file we need to bring up the TICK stack. You will see the configuration for each container in the stack. Note for the volumes, I am using a directory in my home directory called homelabservices and then created child folders for each component service.
Also, you will notice my network is nginxproxy as for me, I am connecting the stack to an Nginx Proxy Manager instance for SSL certs. You can change this to what you need it to be.
services:
  telegraf:
    image: "telegraf:latest"
    hostname: "telegraf"
    container_name: telegraf
    volumes:
        - "~/homelabservices/telegraf/etc/telegraf.conf:/etc/telegraf/telegraf.conf"
    networks:
        - nginxproxy

  influxdb:
    image: influxdb:latest
    container_name: influxdb
    restart: always
    ports:
        - 8086:8086
        - 8089:8089/udp
    networks:
        - nginxproxy
    volumes:
         - "~/homelabservices/influxdb/influxdb-volume:/var/lib/influxdb"

  chronograf:
    image: "chronograf:latest"
    hostname: "chronograf"
    container_name: chronograf
    user: "1001"
    ports:
        - "8888:8888"
    volumes:
        - "~/homelabservices/chronograf/chronograf-data:/var/lib/chronograf"
    networks:
        - nginxproxy

  kapacitor:
    image: "kapacitor:latest"
    hostname: "kapacitor"
    container_name: "kapacitor"
    user: "1000"
    volumes:
        - "~/homelabservices/kapacitor/kapacitor-data:/var/lib/kapacitor"
        - "~/homelabservices/kapacitor/kapacitor-data/etc/kapacitor.conf:/etc/kapacitor/kapacitor.conf"
    networks:
        - nginxproxy
Telegraf config
You will see in the above Docker Compose code, that I have a config file for Telegraf. What does that contain? Enter your InfluxDB user and password for Telegraf, or you can configure this in the GUI.
# Global tags can be specified here in key="value" format.
[global_tags]
  # Example: environment="dev"

# Configuration for telegraf agent
[agent]
  interval = "10s"
  round_interval = true
  metric_batch_size = 1000
  metric_buffer_limit = 10000
  collection_jitter = "0s"
  flush_interval = "10s"
  flush_jitter = "0s"
  precision = ""
  debug = false
  quiet = false
  logfile = ""

# Input Plugins
[[inputs.cpu]]
  percpu = true
  totalcpu = true
  collect_cpu_time = false
  report_active = false

[[inputs.mem]]
  # no configuration

[[inputs.swap]]
  # no configuration

[[inputs.system]]
  # no configuration

[[inputs.disk]]
  ignore_fs = ["tmpfs", "devtmpfs", "devfs"]

[[inputs.net]]
  # no configuration

# Output Plugin InfluxDB
[[outputs.influxdb]]
  urls = ["http://influxdb:8086"] # URL of your InfluxDB instance
  database = "telegraf"
  retention_policy = ""
  write_consistency = "any"
  timeout = "5s"
  username = "your_username" # your InfluxDB username
  password = "your_password" # your InfluxDB password

# Enable other plugins as necessary
Kapacitor config
As we have done with the Telegraf config, we are also mounting a configuration file for Kapacitor. Note the following vanilla configuration I am using in my Kapacitor config. I have left my user, password, and test token in place fo you to see where I have placed these.
hostname = "kapacitor"
data_dir = "/var/lib/kapacitor"
skip-config-overrides = false
default-retention-policy = ""

[alert]
  persist-topics = true
  topic-buffer-length = 5000

[auth]
  enabled = false
  cache-expiration = "0s"
  bcrypt-cost = 0
  meta-addr = ""
  meta-username = ""
  meta-password = ""
  meta-internal-shared-secret = ""
  meta-use-tls = false
  meta-ca = ""
  meta-cert = ""
  meta-key = ""
  meta-insecure-skip-verify = false

[http]
  bind-address = ":9092"
  auth-enabled = false
  log-enabled = true
  write-tracing = false
  pprof-enabled = false
  https-enabled = false
  https-certificate = "/etc/ssl/kapacitor.pem"
  https-private-key = ""
  shutdown-timeout = "10s"
  shared-secret = ""

[replay]
  dir = "/var/lib/kapacitor/replay"

[storage]
  boltdb = "/var/lib/kapacitor/kapacitor.db"

[task]
  dir = "/var/lib/kapacitor/.kapacitor/tasks"
  snapshot-interval = "1m0s"

[fluxtask]
  enabled = false
  task-run-influxdb = ""
  task-run-bucket = "kapacitor_fluxtask_logs"
  task-run-org = ""
  task-run-orgid = ""
  task-run-measurement = "runs"
  default-influxdb = ""

[load]
  enabled = false
  dir = "/var/lib/kapacitor/.kapacitor/load"

[[influxdb]]
  enabled = true
  name = "default"
  default = false
  urls = ["http://influxdb:8086"]
  username = "influxuser"
  password = "password"
  token = "9pXZk5K9YkZuIAgWWqaOdOdoFpw03XWsZdSVS1N6lveF1VZgAlxz0w0D1q5ifUJgLrJZ_qVxu5itDrTrSrQ3Sg=="
  http-shared-secret = false
  ssl-ca = ""
  ssl-cert = ""
  ssl-key = ""
  insecure-skip-verify = false
  timeout = "0s"
  disable-subscriptions = false
  subscription-protocol = "http"
  subscription-mode = "cluster"
  kapacitor-hostname = ""
  http-port = 0
  udp-bind = ""
  udp-buffer = 1000
  udp-read-buffer = 0
  startup-timeout = "5m0s"
  subscriptions-sync-interval = "1m0s"
  subscription-path = ""
  compression = "gzip"
  [influxdb.excluded-subscriptions]
    _kapacitor = ["autogen"]

[logging]
  file = "STDERR"
  level = "DEBUG"

[config-override]
  enabled = true

[tls]
  min-version = ""
  max-version = ""


[reporting]
  enabled = false
  url = "https://usage.influxdata.com"

[stats]
  enabled = true
  stats-interval = "10s"
  database = "_kapacitor"
  retention-policy = "autogen"
  timing-sample-rate = 0.1
  timing-movavg-size = 1000

[udf]

[deadman]
  interval = "10s"
  threshold = 0.0
  id = "{{ .Group }}:NODE_NAME for task '{{ .TaskName }}'"
  message = "{{ .ID }} is {{ if eq .Level \"OK\" }}alive{{ else }}dead{{ end }}: {{ index .Fields \"emitted\" | printf \"%0.3f\" }} points/INTERVAL."
  global = false
Configuration after bringing up the TICK stack
After you have brought up the TICK stack, you need to login to a couple of the administrative user interface GUIs to finish out some configuration.
InfluxDB configuration
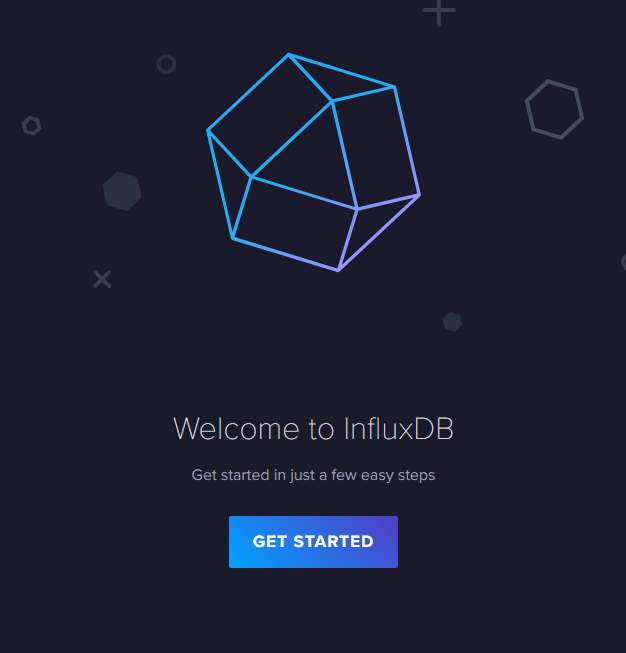
Browse to your Docker container host on port 8086 and you will see the initial configuration wizard for InfluxDB.
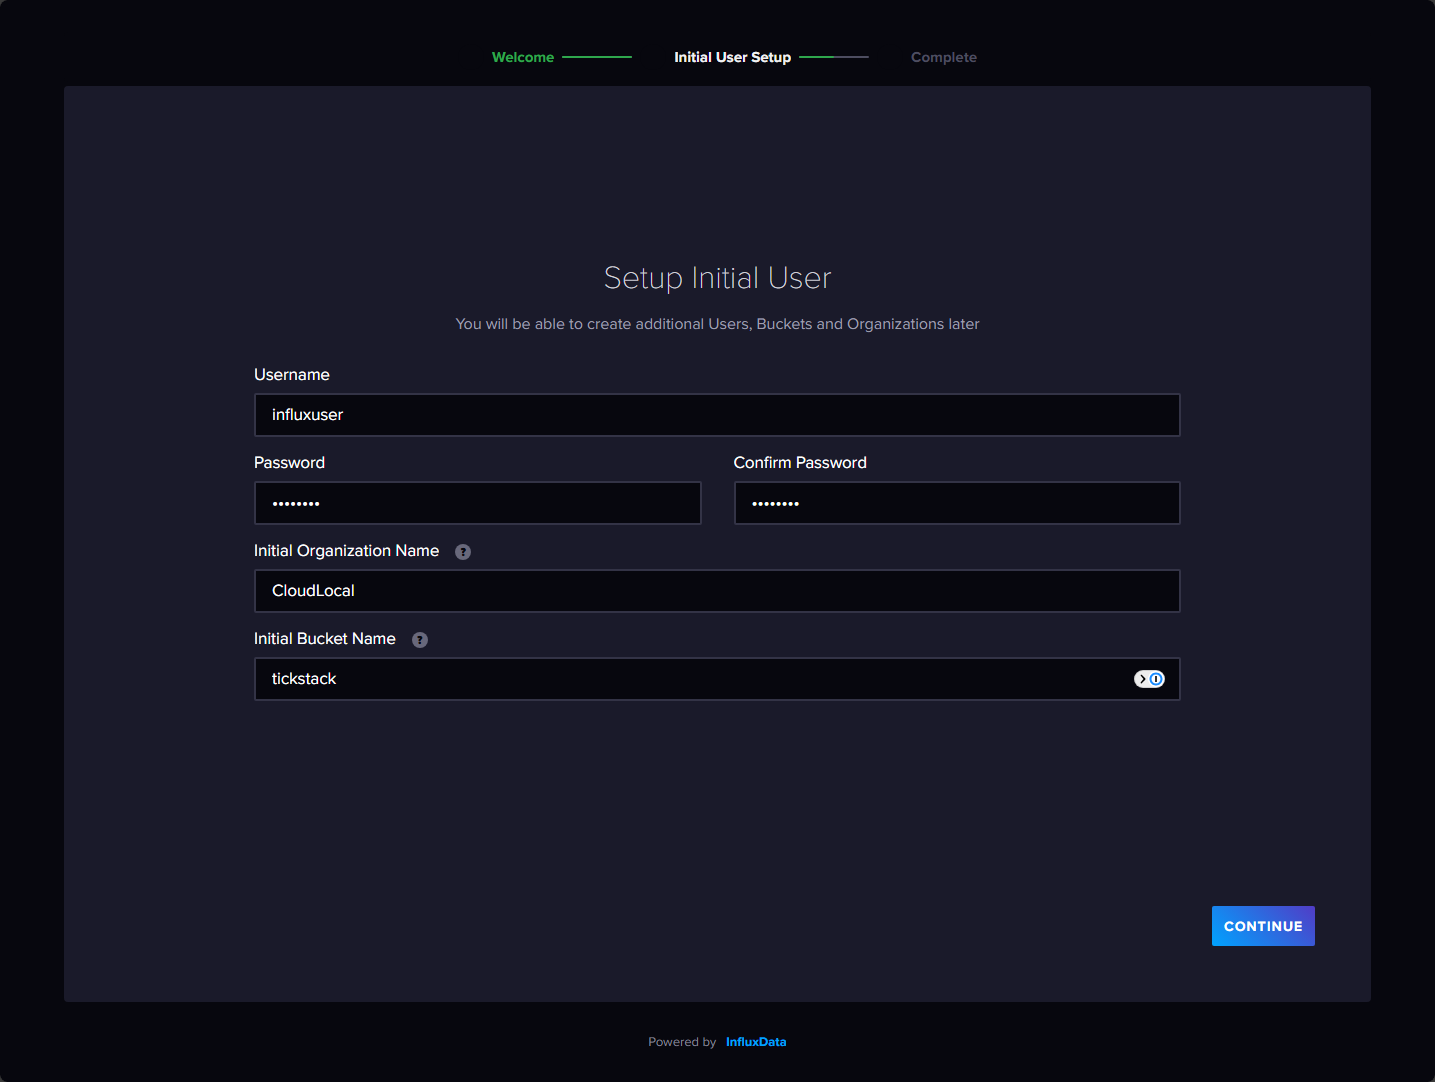
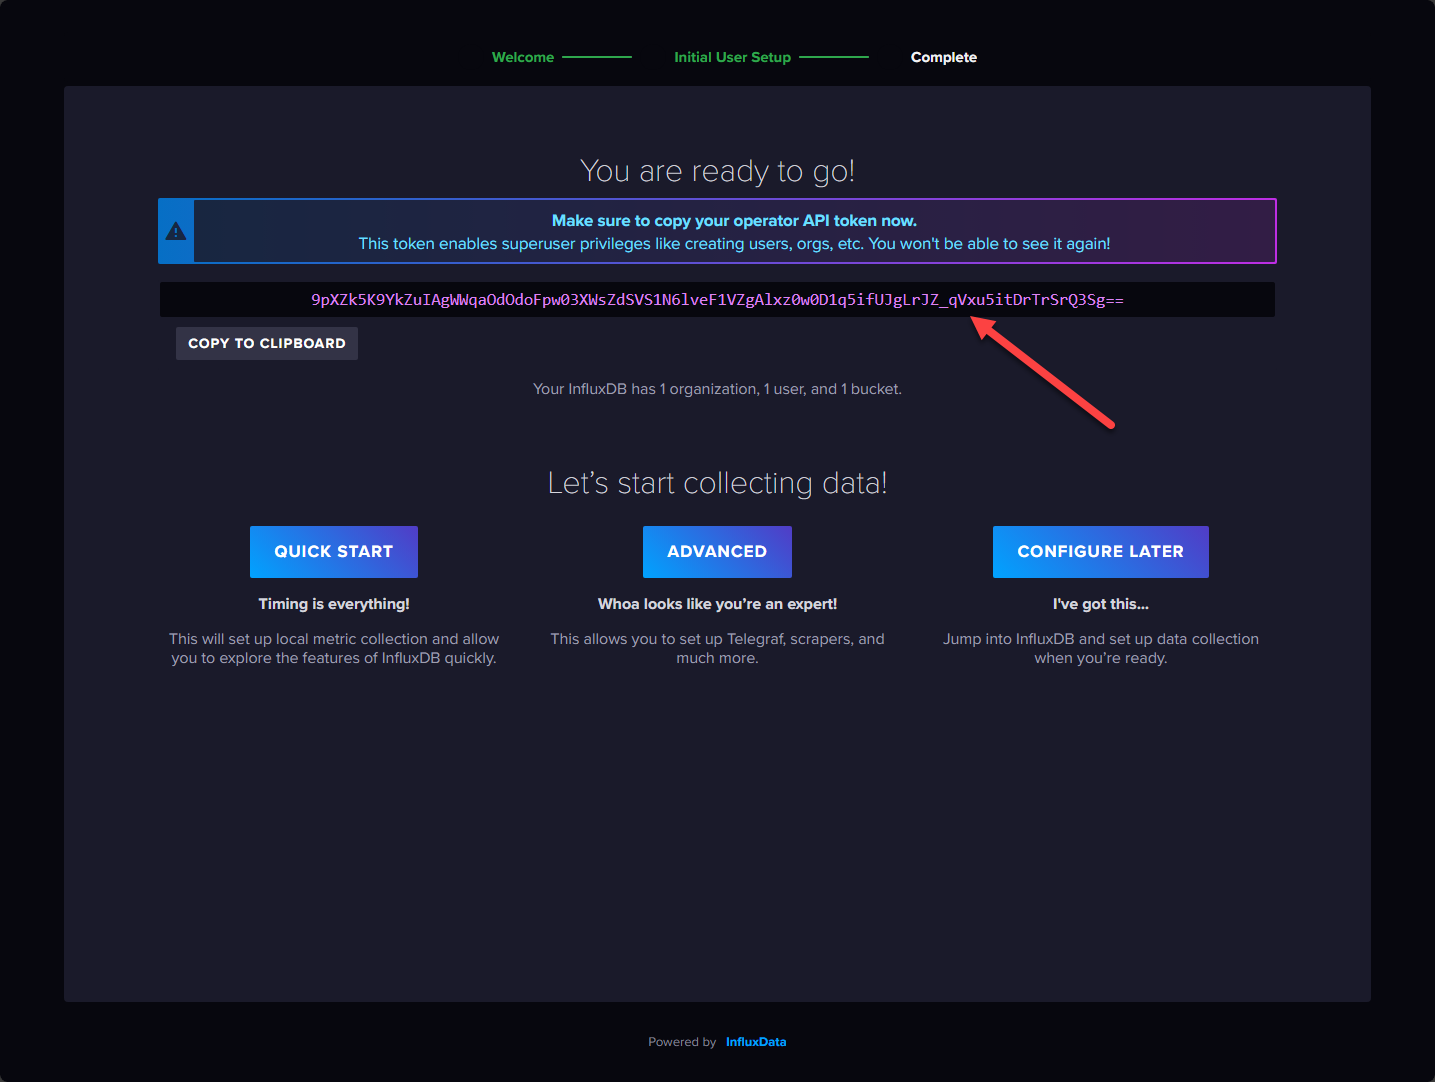
Next, you will configure the user, password, organization, and the initial bucket name.
The dashboard of InfluxDB.
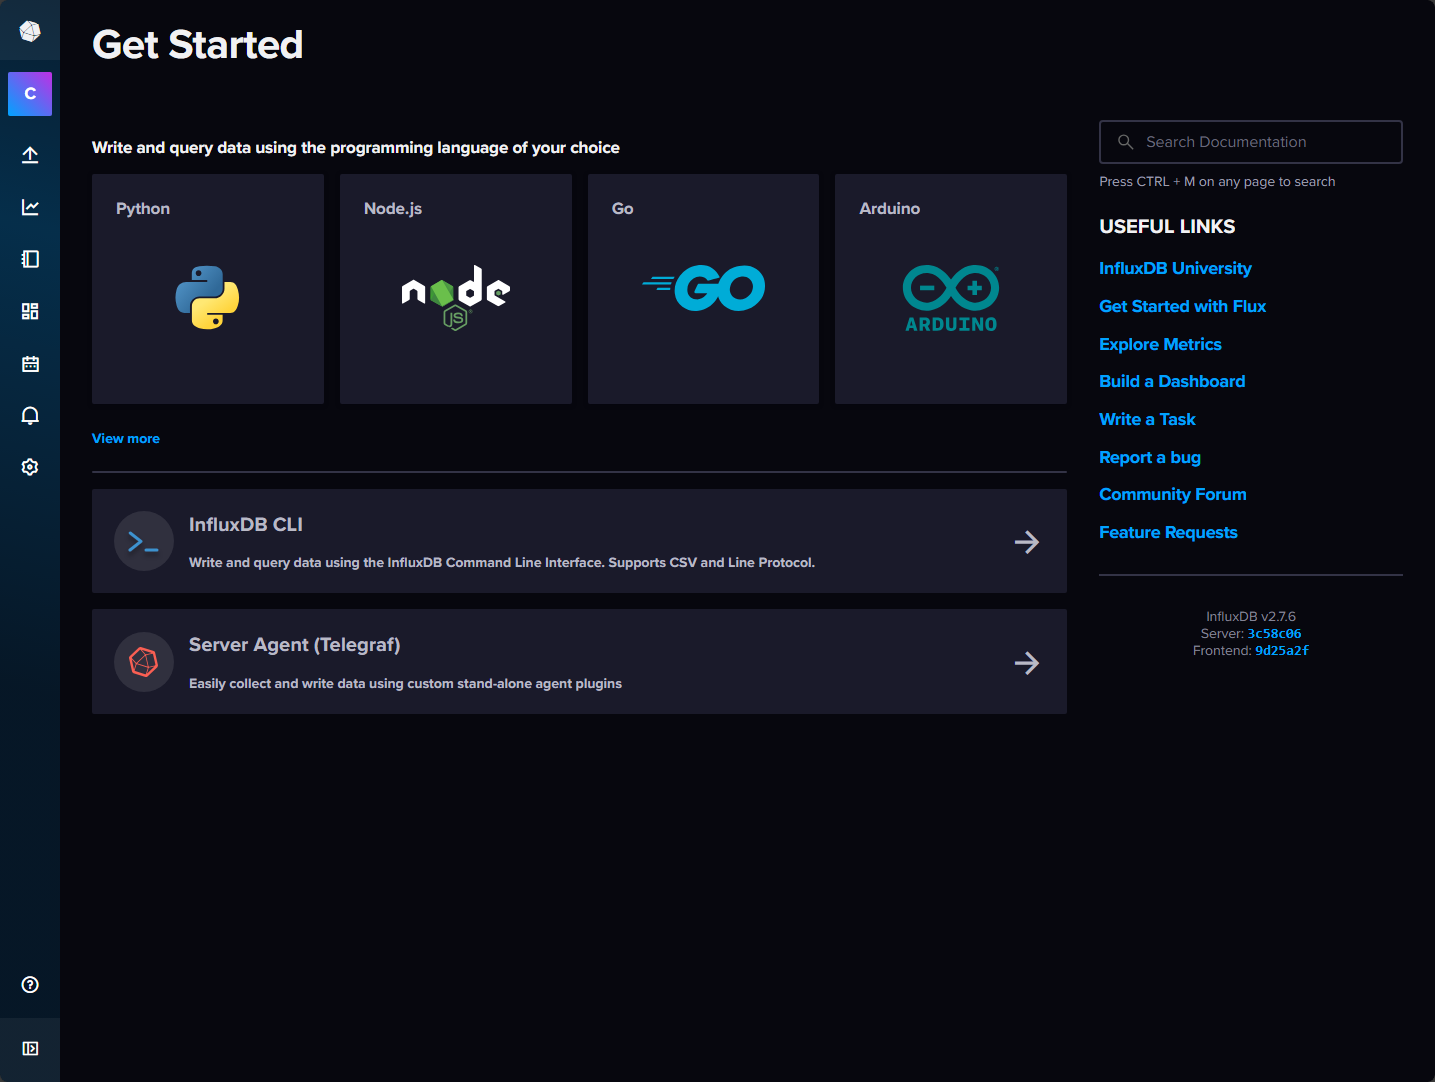
Chronograf
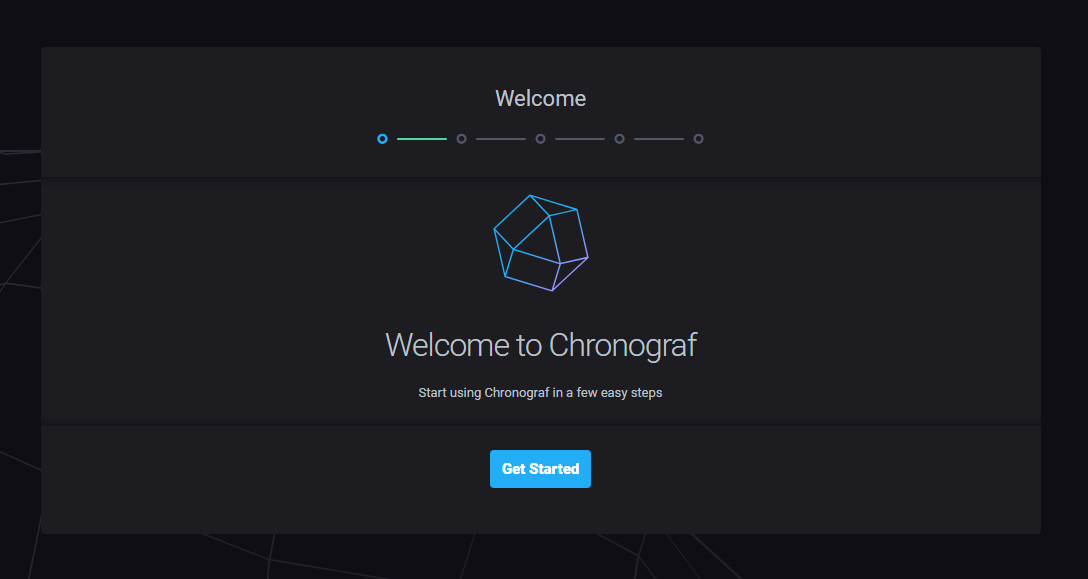
Login to the Chronograf web interface at port 8888.
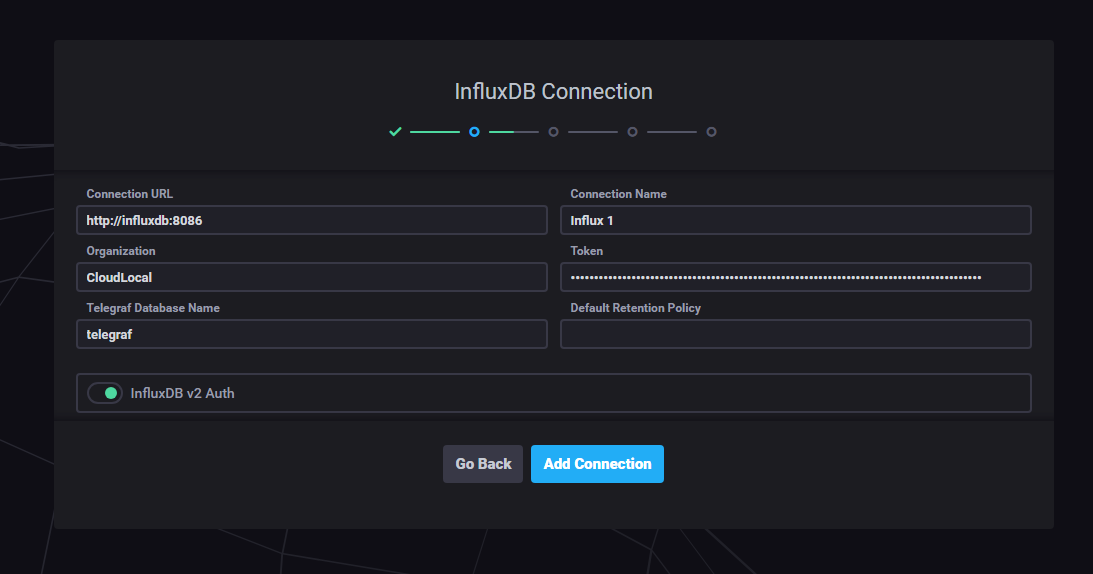
Configure your connection to InfluxDB from Chronograf. Here I am using the InfluxDB v2 configuration with token auth.
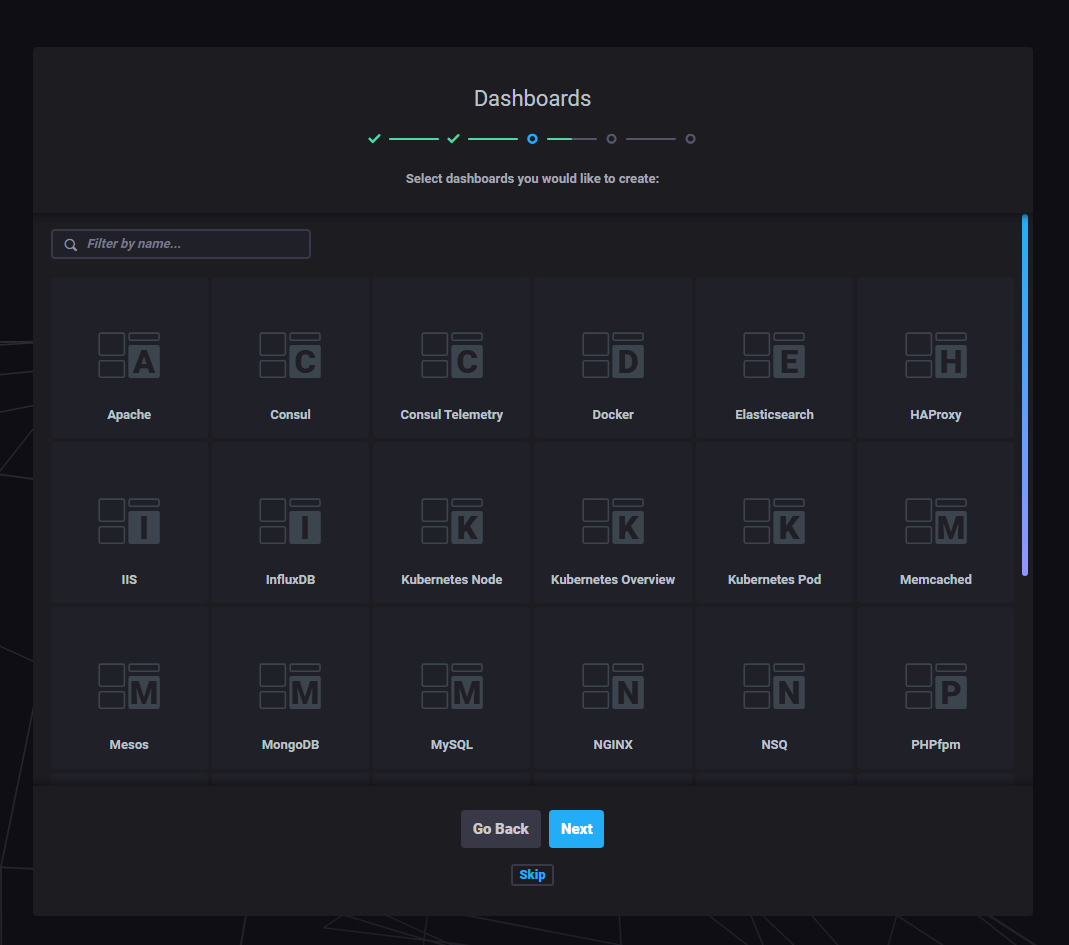
Dashboards.
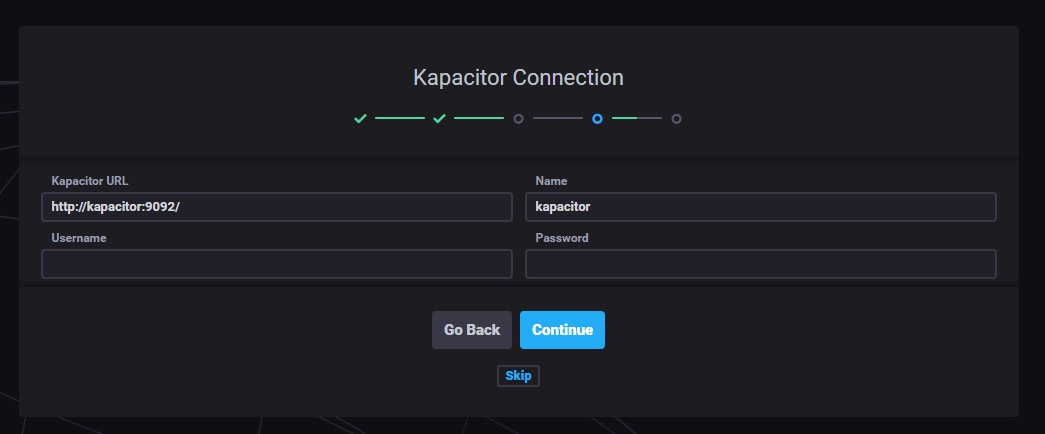
Kapacitor connection.
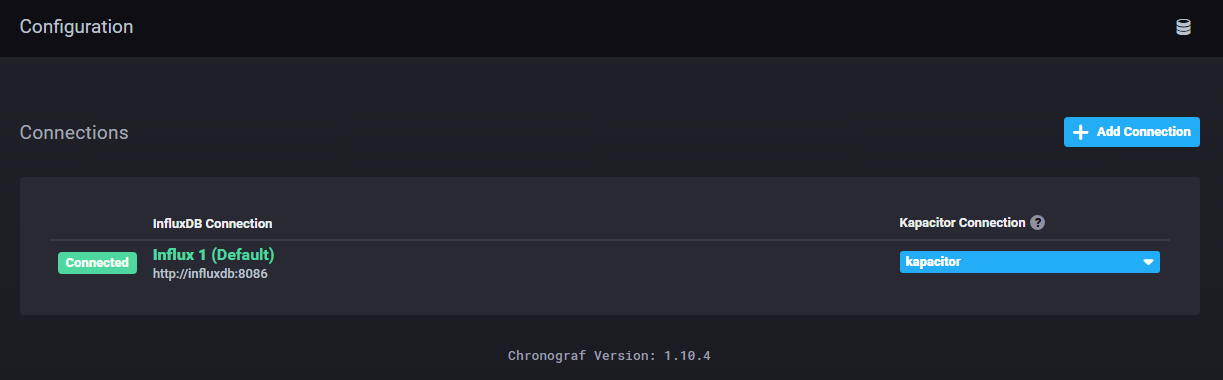
Viewing the connections in Chronograf.
What should you do next?
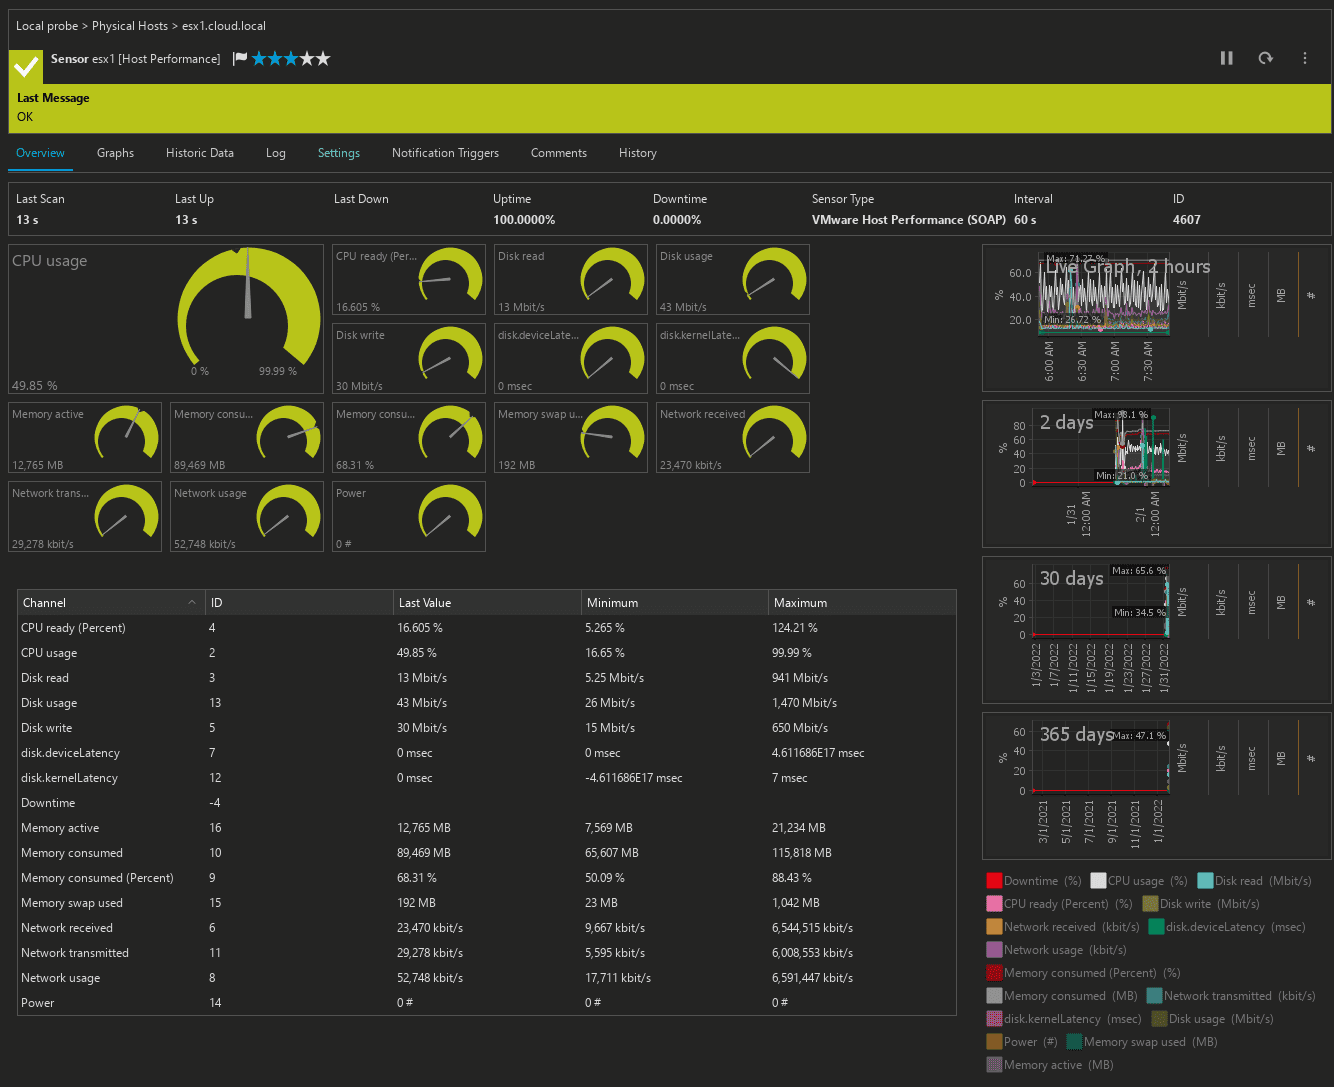
Now that we have the TICK stack up and running, we can get started ingesting data from various sources.
Take the files I have given as examples above, customize them for your environment, and spin them up on your own Docker host to start playing around with the TICK stack configuration.
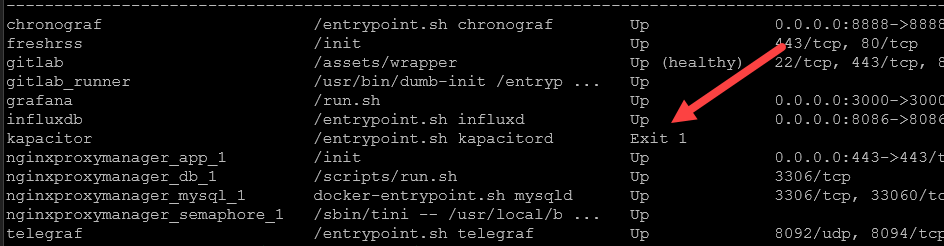
Troubleshooting
If you have any containers that don’t come up, view the docker logs for that specific container to pinpoint the root cause of the error.
Often you will find permissions errors or configuration file errors/syntax as the common culprits.
Wrapping up
Hopefully the above TICK stack Docker Compose example will help any who want to make use of the TICK stack in their home lab or production environment for ingesting and analyzing data. Let me know in the comments if you are currently using TICK for monitoring or analyzing data from your lab, home automation, or other use cases.
Google is updating how articles are shown. Don’t miss our leading home lab and tech content, written by humans, by setting Virtualization Howto as a preferred source.
About The Author

Thanks for the guide, but there were so many issues with this guide, so many errors, so many hours wasted error checking everything. You really need to check the guide and verify it.
– Kapacitor ports missing in the docker compose config.
– Permission issues with the config files and folders, need to create the first, set permissions _before_ getting all containers up.
You shouldn’t need to be a linux expert to get these things up and running if you provide a guide. Make the guide for novices, not Linus Torvalds level of user.
Thank you.