Netdata has come onto the scene as a very easy-to-configure and quick time-to-value monitoring solution. It is cloud-based, and you can easily use it to monitor endpoints on-premises, including virtualization and hypervisor environments like VMware vSphere.
Table of contents
What is Netdata?
Netdata provides real-time monitoring metric capabilities and detailed insights into system performance that aligns with cloud native computing foundation best practices. Using a plugin-type architecture, you can collect status metrics, data collection, and monitor various environments using Netdata’s monitoring design.
Netdata parses through all the data collected and can display meaningful analytics from the data for many different things, including hosts, virtual machines, servers, external databases, disk resources, CPU, memory, cloud deployments and instance, network traffic, and a number of other different metrics.
Using these, Netdata can create interactive visualizations and charts of the data collected and create custom dashboards. These can help quickly understand the performance impact of behavior in the environment.
1. Install a Netdata collector system
The first step is the installation of the Netdata agent. The agent serves as the collector system that runs Netdata on-prem and will poll your vCenter Server for monitoring.
After you have signed up for a free community account with Netdata Cloud. Then you will add a node. Click Manage Room > Add Node. Then, choose the operating system in which you want to install Netdata. Netdata actively supports most operating system platforms. The command displayed will have your claim token and room ID embedded.
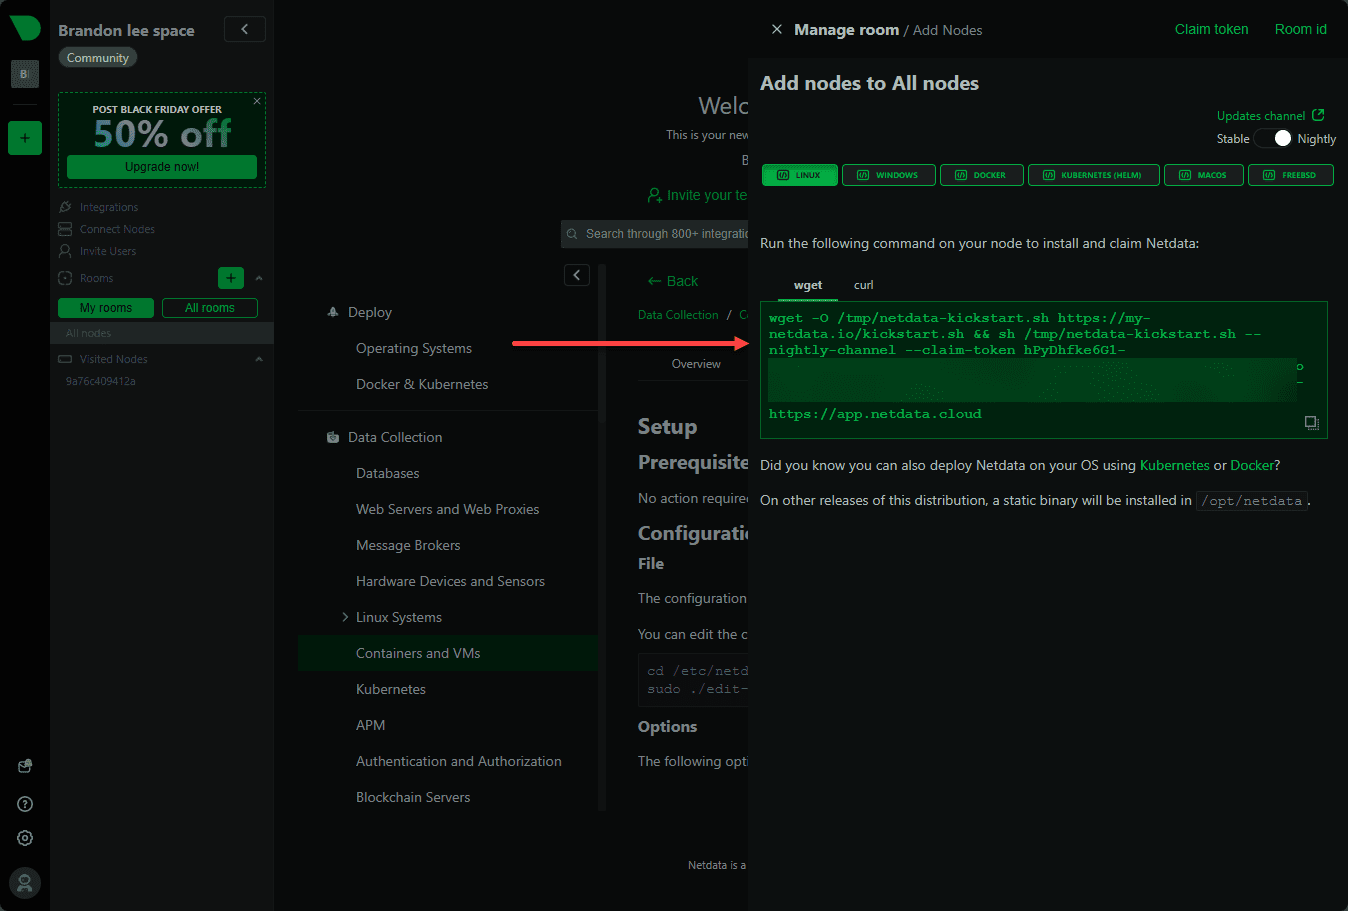
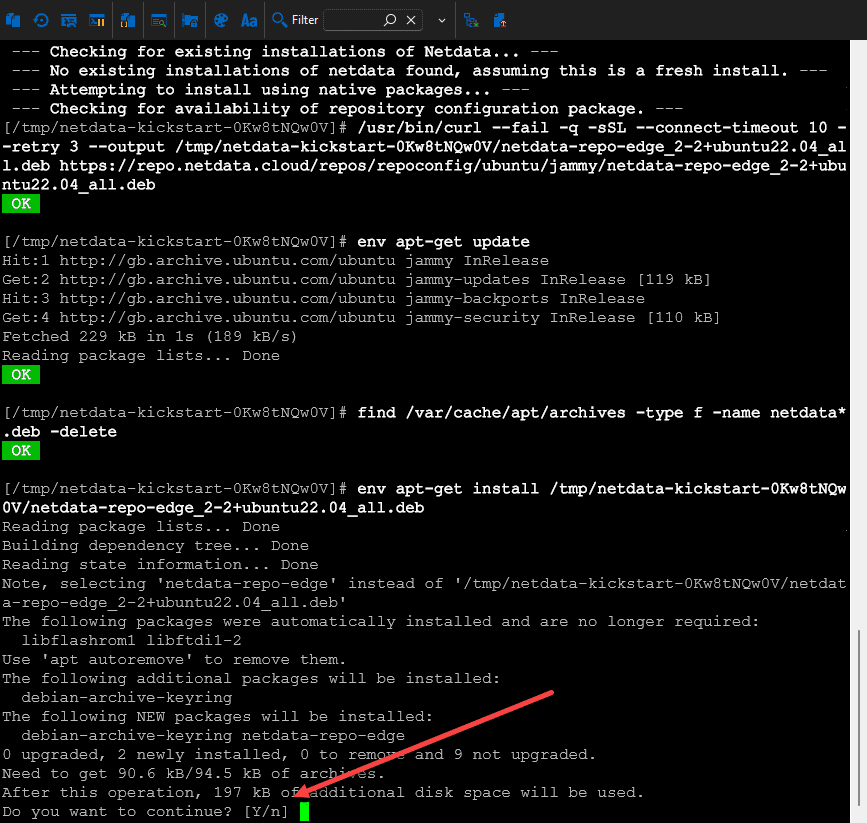
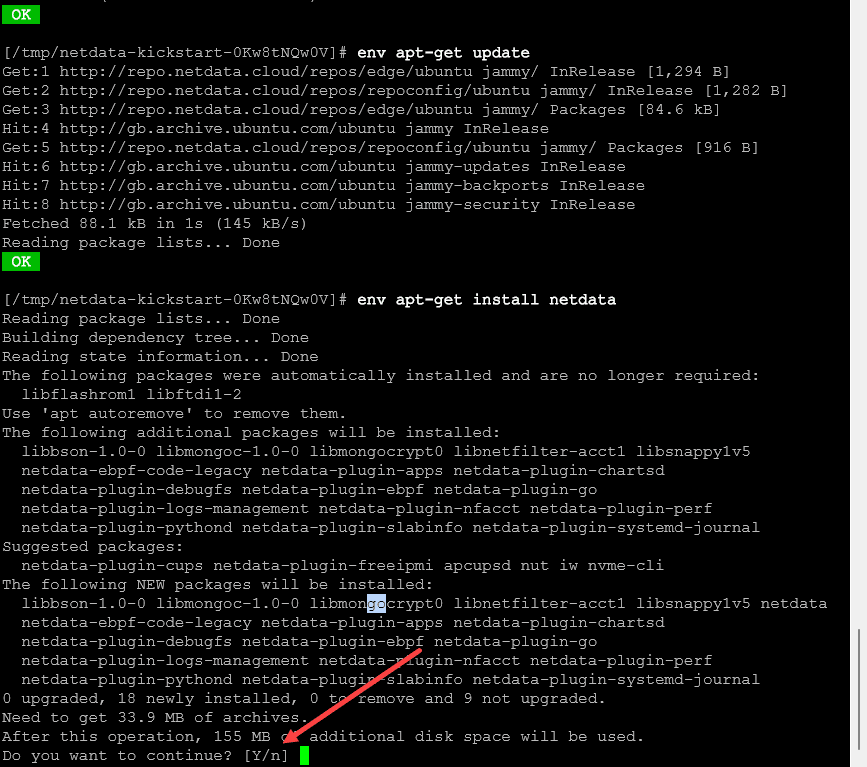
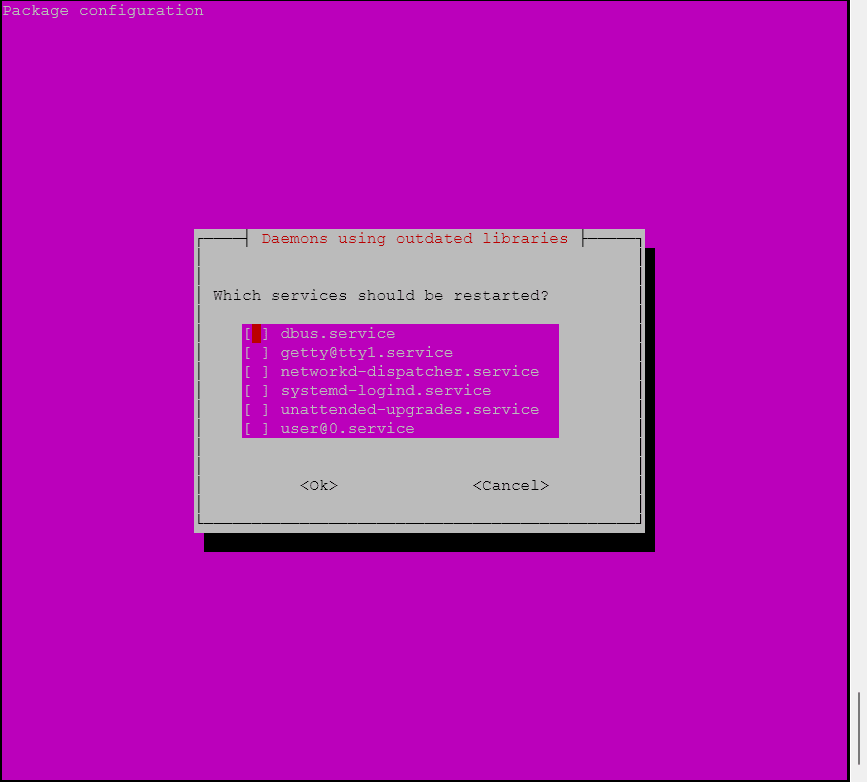
Run the command in your collector machine. In my case I am using an Ubuntu 22.04 LTS Linux server. When you run the command, you will need to confirm a couple of prompts to install software and restart services.
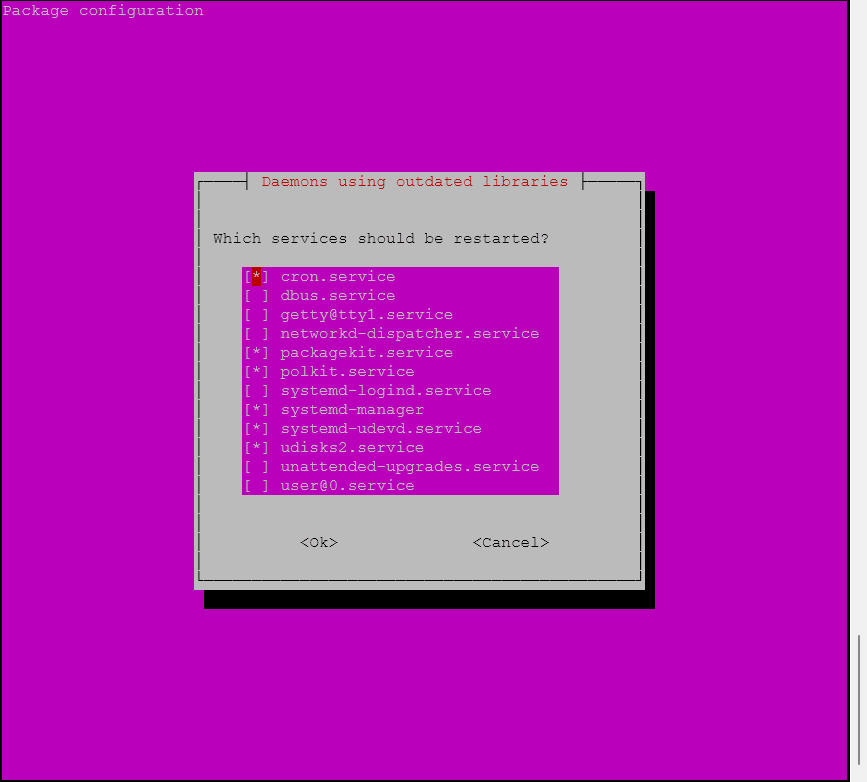
First service restart prompt.
Next prompt to install software.
Final service restart prompt.
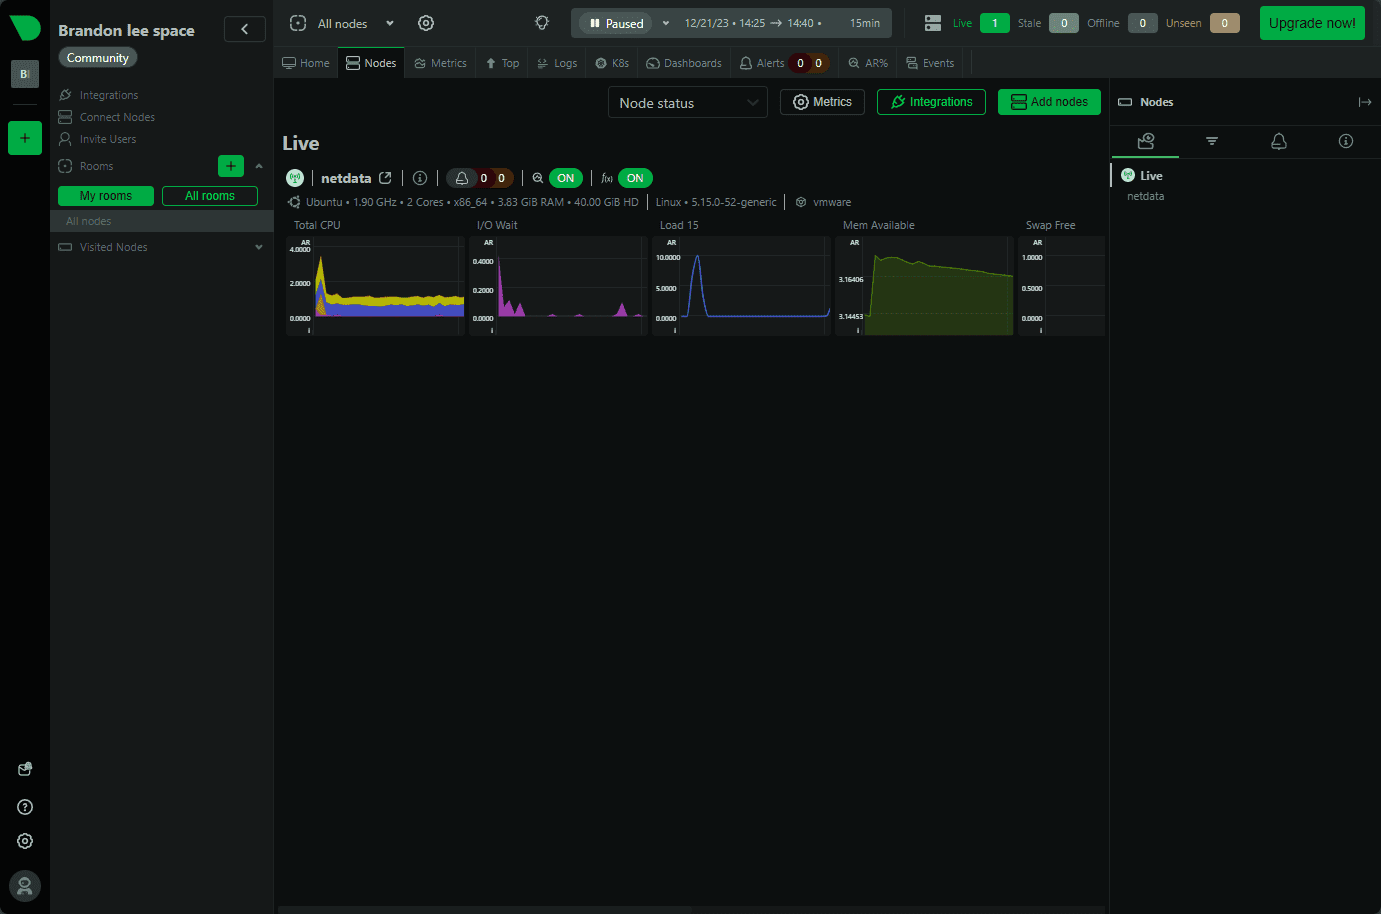
Once the Netdata installation finishes, you can refresh your Netdata room nodes screen and you should see the collected data starting to stream to the dashboard from the collector node itself which will collect data from your other production systems.
2. Configure Netdata to monitor VMware vSphere
Now, let’s delve into configuring Netdata to work with VMware vSphere. This section will provide step-by-step instructions.
Netdata includes a command line tool used to edit files needed to configure the connection to our vSphere vCenter Server.
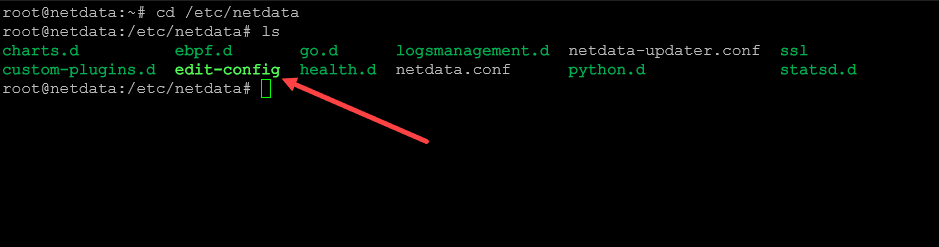
Navigate to the following directory:
/etc/netdataIf you list the directory you will see the edit-config Netdata monitoring tool editor.
3. Using the edit-config tool to list the plugins
We can use the tool to view the built-in modules included out of the box with Netdata. Use the command:
edit-config --listWhen you do, you will see the file:
go.d/vsphere.conf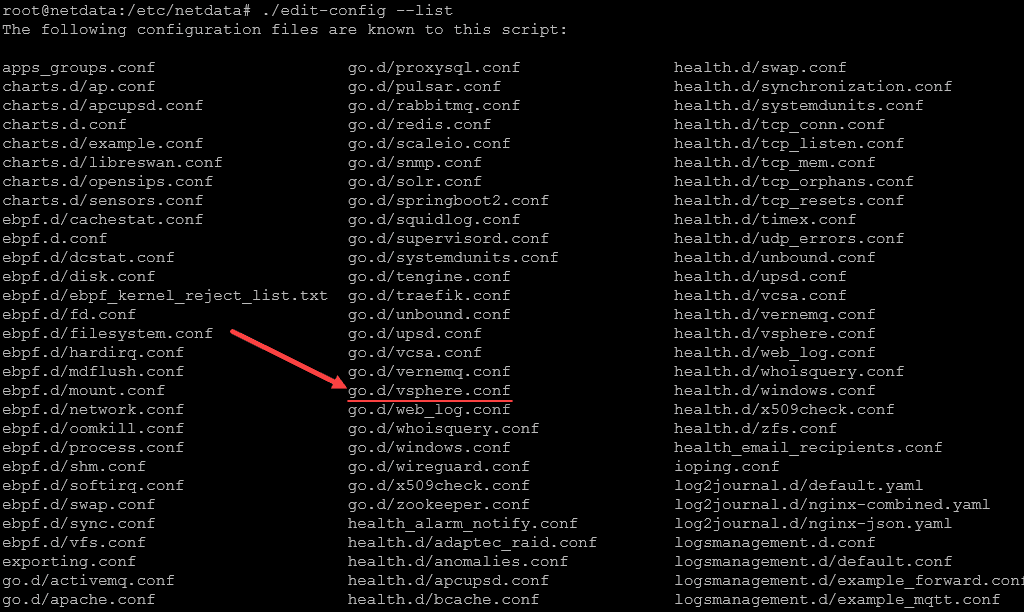
4. Edit the vSphere configuration file
Now, we can use the edit-config command to edit the vSphere config file:
edit-config go.d/vsphere.conf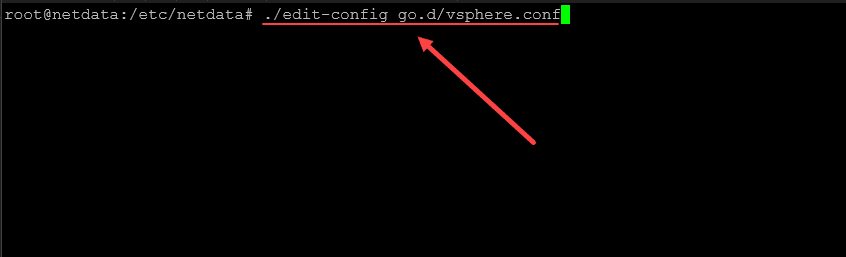
It will open the file for editing.
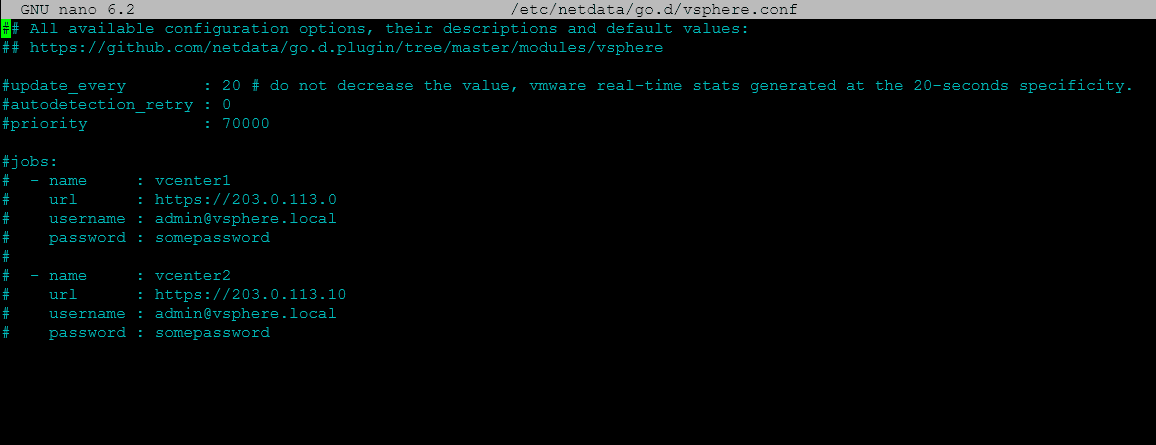
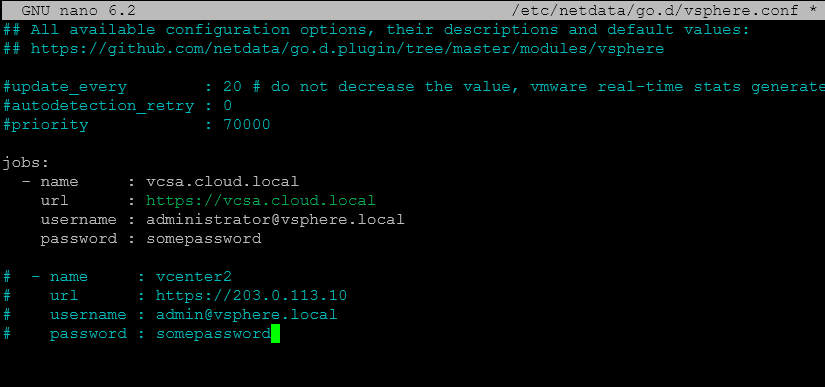
In the file, you need to uncomment one of the blocks for filling in the information for your specific vCenter server. The block contains the name, URL, username, and password. Below I am configuring my vCenter Server appliance hostname for the setup.
5. Edit the plugin configuration file
Once you have entered your details, close and save the file. Next, we need to edit the go.d.conf.
edit-config go.d.conf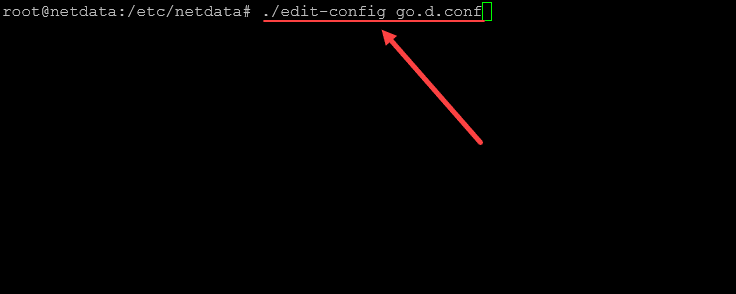
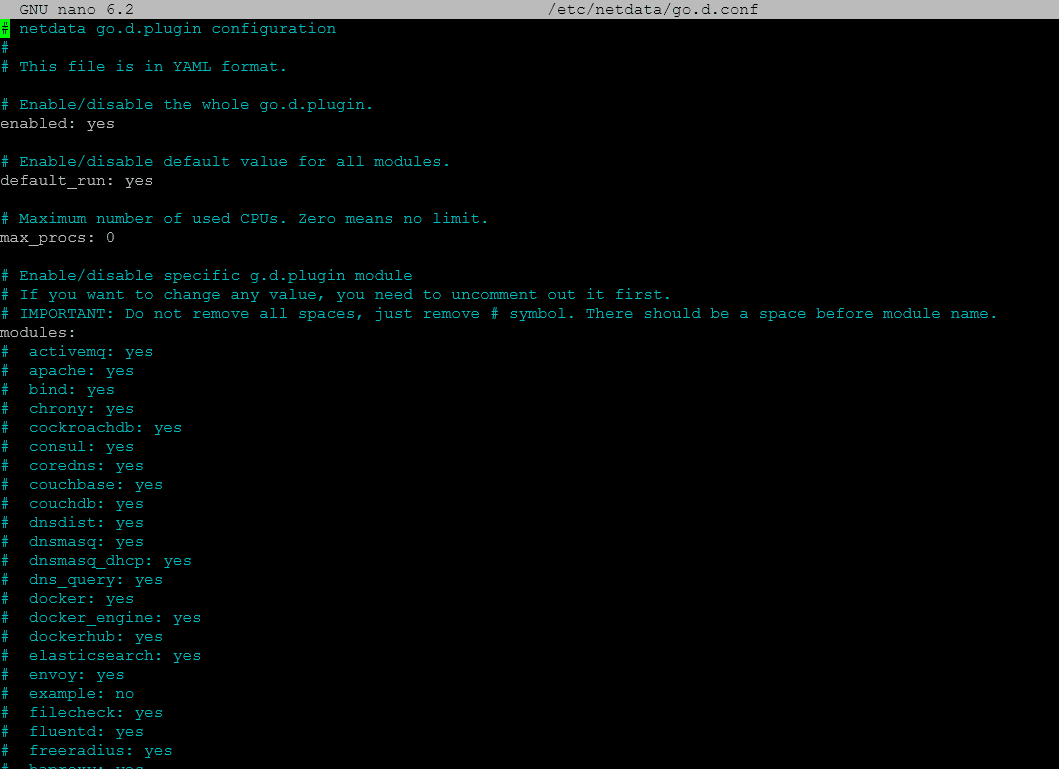
In this file, you will see the plugin modules you can activate. All are commented out. So, we need to uncomment the vSphere module.
Scroll down and uncomment vsphere.
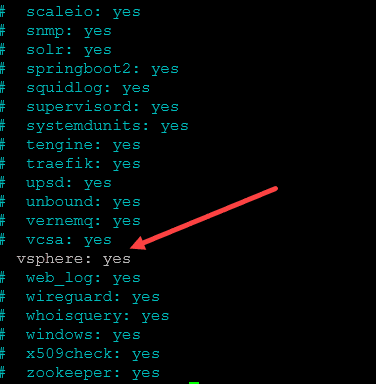
Save and close the file.
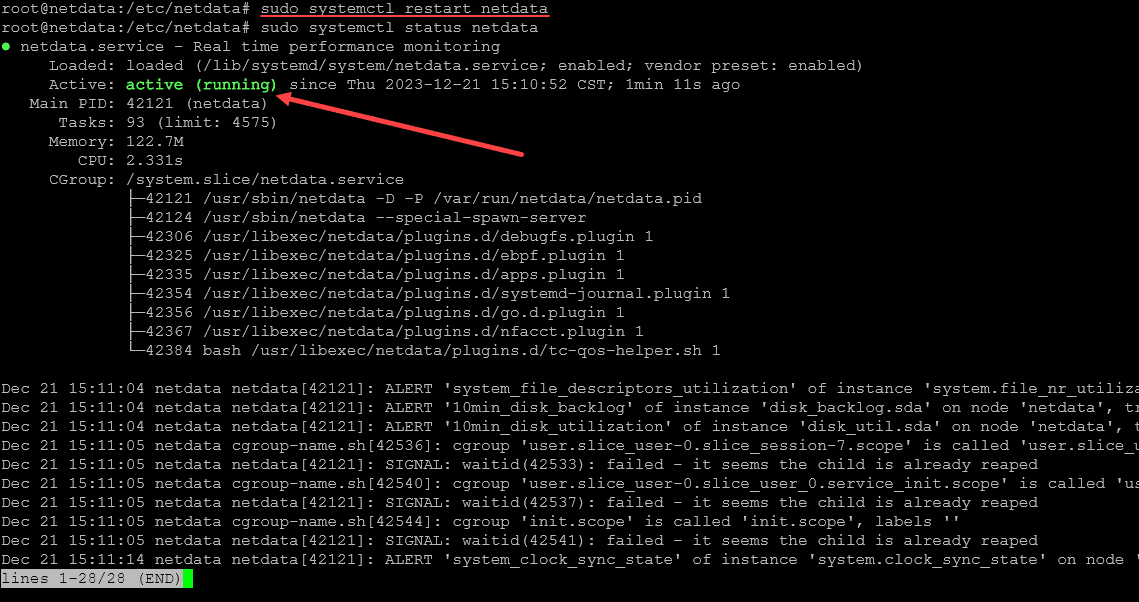
6. Restart the Netdata service
7. Troubleshooting the vSphere connection
After I restarted the service, I didn’t see any activity in the Netdata console. Netdata has included some useful steps to help troubleshoot. As it turns out, there was some additional configuration needed to make the connection to vCenter Server.
To debug your vSphere connection, run the following commands:
## Navigate to the plugins.d directory
cd /usr/libexec/netdata/plugins.d/
## Switch to the netdata user
sudo -u netdata -s
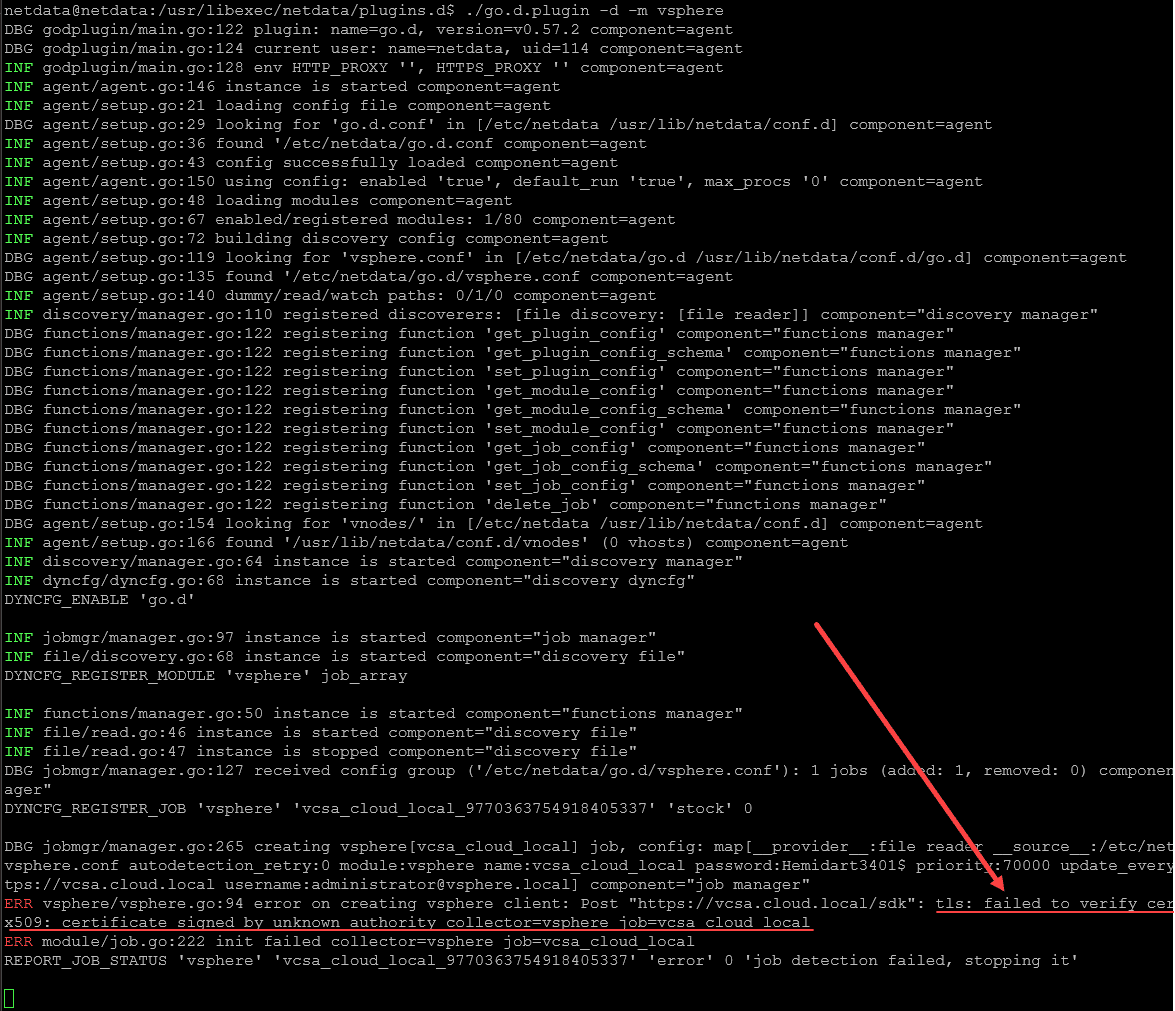
## Run the go.d.plugin to debug the collector:
./go.d.plugin -d -m vsphereAs you can see below, the problem was related to the untrusted self-signed certificate.
After doing a bit of Googling, I found the additional configuration was needed:
tls_skip_verify: yes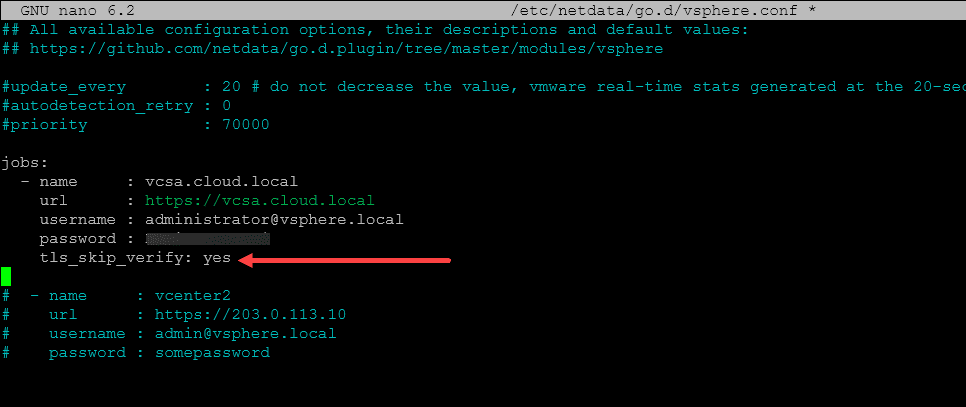
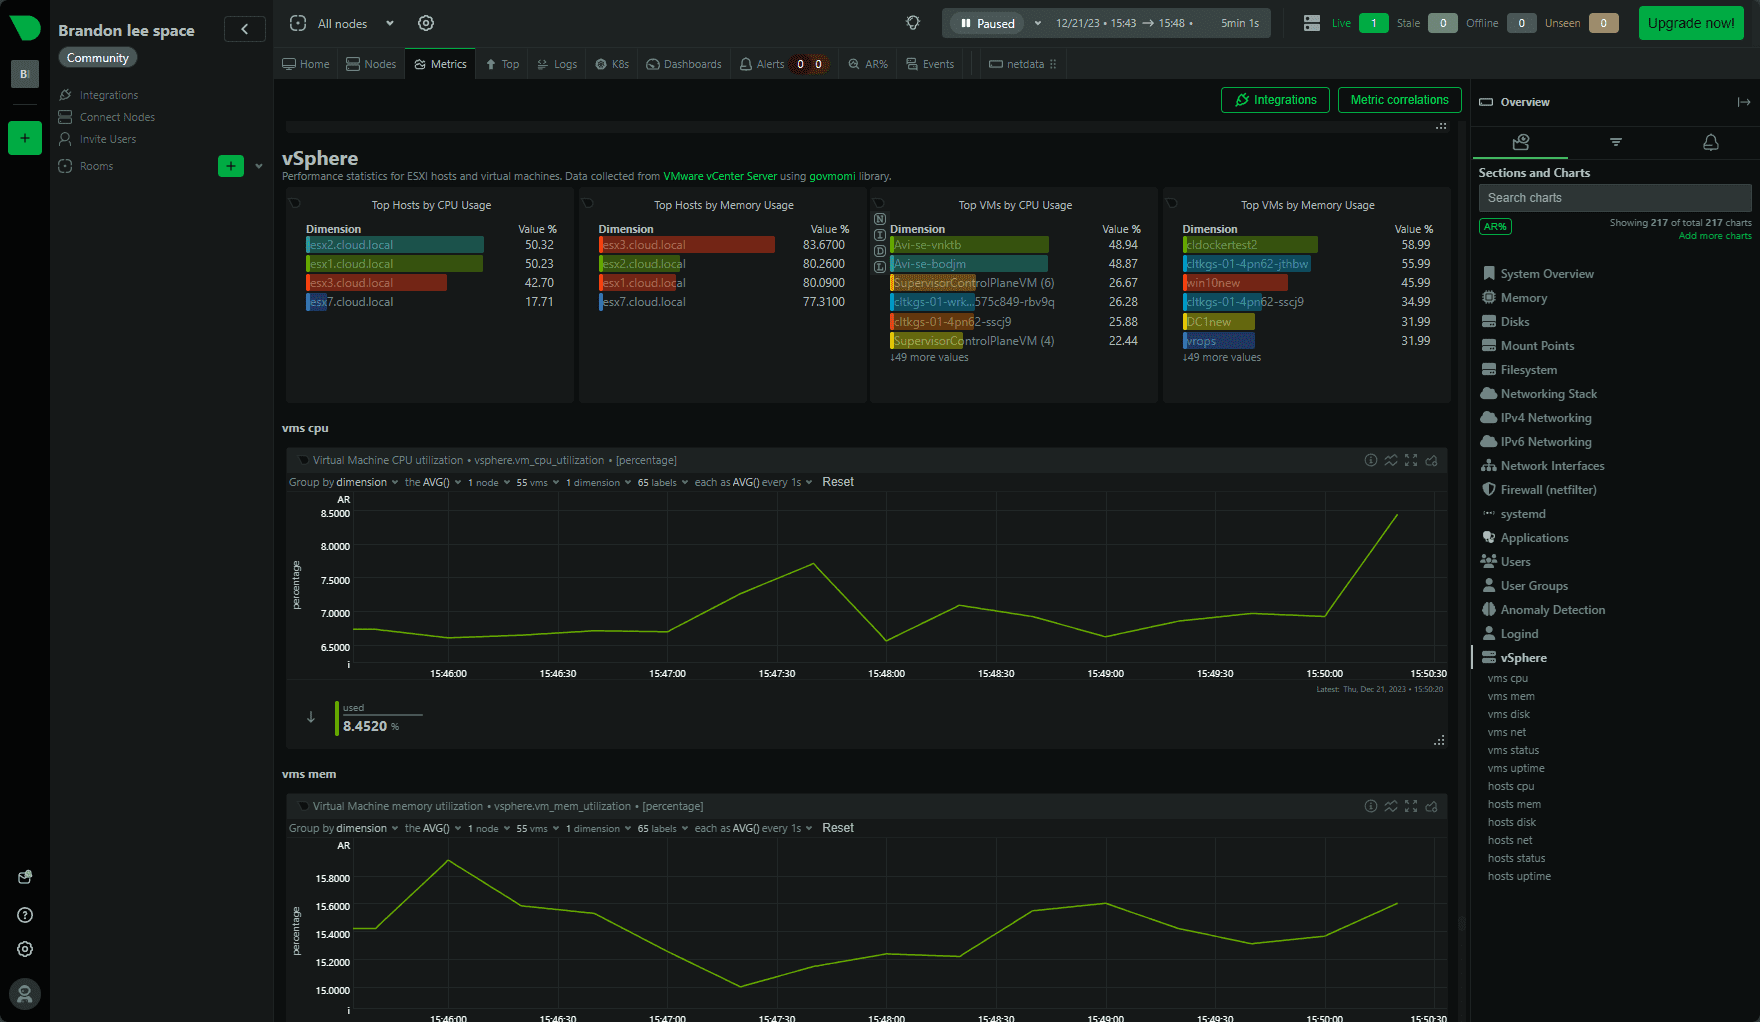
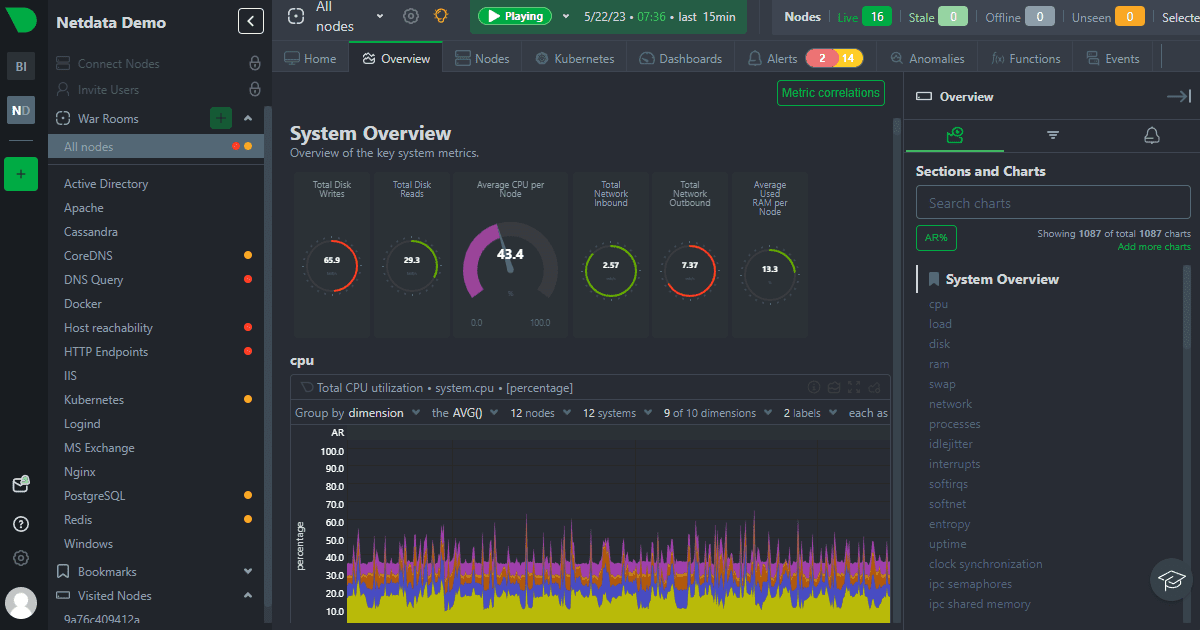
Netdata collects data from your vSphere vCenter Server integration after the service is restarted and we immediately start to see visualization of performance with chart values, virtual component health, etc. Below is the default configuration for the vSphere collector that starts showing utilization of VMware instances, including clusters in the environment, including auto detection of various metrics and values collected from our vSphere environment.
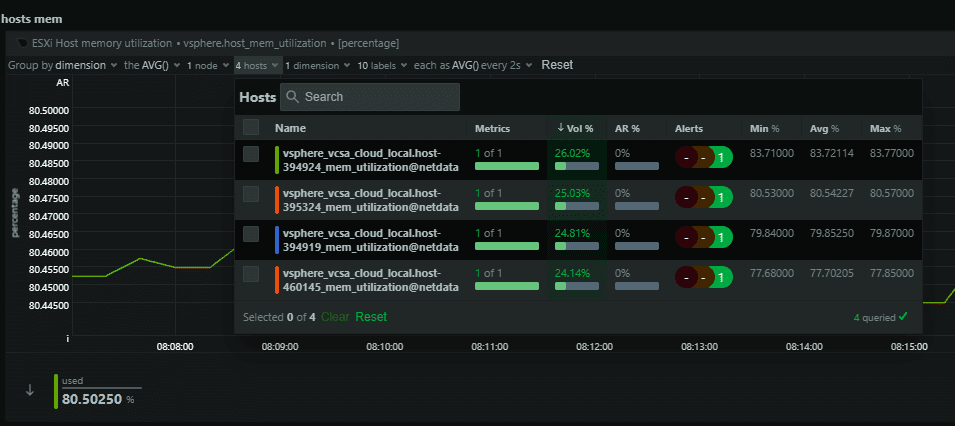
Below, we see host memory usage with labels for the hosts and a description of the utilization metrics to have immediate feedback on memory pressure. One gripe and this may be a setting is the names of the hosts. These are not set to friendly names. However, this could be in the options that I need to explore
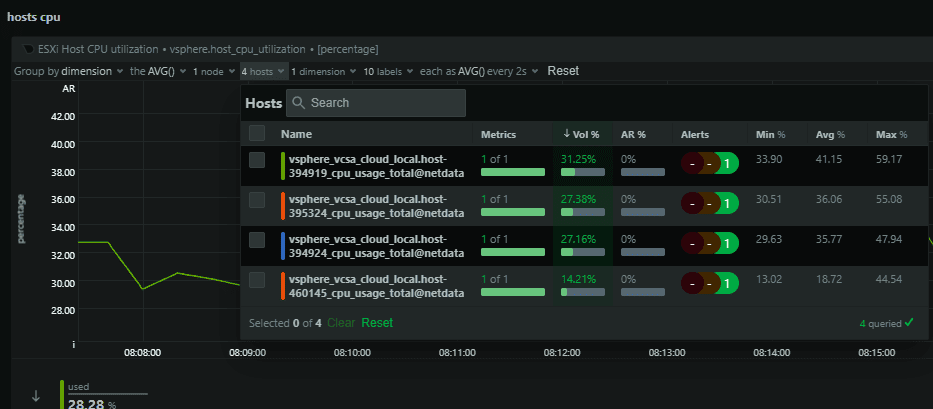
Next, we see hosts CPU output.
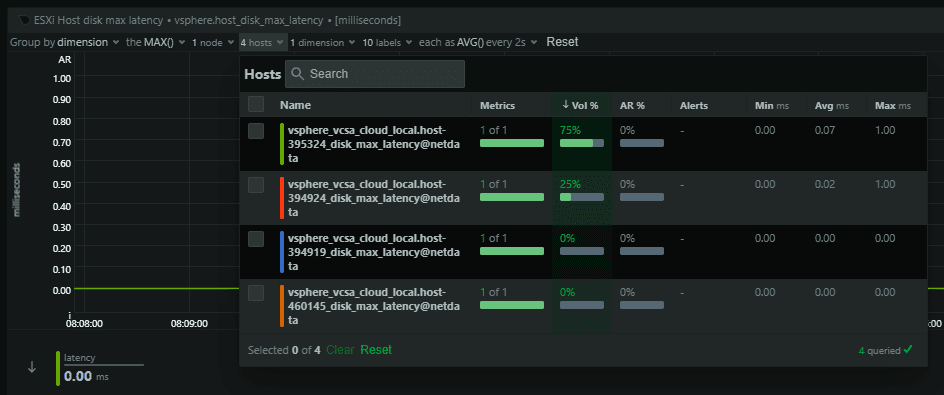
A look at VMware ESXi hosts disk latency.
Wrapping up Netdata and VMware vSphere
Netdata provides a really intuitive and simple monitoring solution for VMware vSphere to enable discovery of hundreds of metrics and data points. It allows you to see patterns, errors, vms, CPU, memory, storage, and many other sources of info for VM performance and overall issue detection and capacity management.
I think it is a little rough around the edges compared to some other monitoring solutions, but considering the ease with which you can set up a collector and immediately start getting metrics this would be great for edge environments and others where you need quick and dirty monitoring. Also it is free for the community edition features.
Hopefully, this guide will help you get up and running with Netdata monitoring your VMware environment.
Google is updating how articles are shown. Don’t miss our leading home lab and tech content, written by humans, by setting Virtualization Howto as a preferred source.
About The Author

Thanks for documenting this. The netdata documentation lacked some of these key steps. This should be in the official docks. Works perfectly in my home lab. Thanks again!
Scott
Scott, thanks so much for the comment! I agree, I was totally frustrated by the official documentation. I had to make some assumptions and piece this together from various sources. Hopefully this will help to fill the gaps. Thanks again!
Brandon