Monitoring

Netdata Agent and Cloud: Ultimate Real-Time Infrastructure Monitoring

In an age where the complexity of IT infrastructures is constantly growing, system administrators, DevOps engineers, and developers need a reliable, easy-to-use tool to monitor and troubleshoot these intricate environments in real-time. Enter Netdata. In this blog post, we delve into the ins and outs of Netdata, from its foundational community version to the feature-rich Pro and Business plans, guiding you to select the perfect solution for your monitoring needs. We will explore the world of Netdata and see how it can revolutionize your infrastructure monitoring and troubleshooting in production and the home lab.

What is Netdata?

Netdata, an open-source, free, and preconfigured monitoring platform, delivers a high-fidelity, real-time solution to collect metrics for infrastructure monitoring and troubleshooting. It is optimized to be operational out of the box with zero configuration required, making it a desirable tool for many system administrators, DevOps engineers, and developers for data collection and system metrics.

Its role is comprehensive, covering various aspects, from systems, hardware, and containers to applications. It can collect thousands of valuable metrics and operational across your entire infrastructure, whether on physical servers, virtual servers, containers, or even IoT devices. Netdata recently added support for Windows systems along with the existing Linux systems support.

You can learn more about Netdata at the official site here:

Understanding the Power of the Netdata Agent

A significant element within the Netdata ecosystem is the Agent. It’s a powerful open-source tool designed for single-node health monitoring and performance troubleshooting. The Netdata Agent’s capabilities extend beyond mere metric collection – it auto-detects processes, stores metrics locally, and visualizes all metrics with no initial configuration needed. The aim here is to offer maximum flexibility, with options to tweak settings to your specific needs.

One of the things like me that you will most likely be surprised by is the sheer number of monitors you get out of the box with an agent. I was blown away at the number of monitors that came preconfigured out of the box when you spin up the agent.

Netdata Cloud: Your Window into Real-Time Infrastructure Monitoring

Expanding beyond individual nodes, Netdata Cloud provides a hosted web interface for an aggregated, real-time overview of your entire infrastructure. It connects securely to your Netdata Agents and routes your requests intelligently to the most relevant agents based on stored metadata. This seamless process ensures you always have the most accurate metrics at your fingertips.

Netdata Cloud isn’t just about metric visualization. It provides value-added features like Metric Correlations and Anomaly Advisor. Combined with anomaly rates on every chart, these capabilities deliver powerful insights for precise troubleshooting.

You can check out the Netdata Cloud demo space to experience the platform’s capabilities first-hand, with no signup or login needed:

The Mission Behind Netdata

At its core, Netdata’s mission is to simplify the troubleshooting of increasingly complex IT infrastructures. To fulfill this mission, our free community plan allows monitoring an unlimited number of nodes, containers, and metrics, whether custom or built-in.

Pro and Business Plans

While Netdata’s Community edition is a robust and feature-rich tool, the Pro and Business plans offer several additional benefits for users who require a higher level of service and support.

  • Monthly and Yearly Plans – Whether you prefer monthly or yearly billing, Netdata offers competitive pricing tailored to your needs. You can choose to pay as you go, with a node plan price multiplied by the number of concurrently running agents, or commit to a yearly plan and enjoy a 25% discount.

  • Expanded Access and Increased Retention with Pro and Business Plans – With Netdata’s Pro and Business plans, users benefit from extended auditing, topology, and alert event retention periods. This feature allows for more in-depth analysis and historical tracking of system events and alerts, providing critical insight for troubleshooting and system improvement.

  • Enhanced Alert Integration with Global Administration – Pro and Business users also get access to more extensive alert notification integrations, including Email, Discord, Webhook, Slack, PagerDuty, and Opsgenie. These options allow you to customize your alert systems to best fit your team’s workflow.

  • Advanced Role-Based Access for Your Team – Netdata’s Business plan features advanced role-based access, allowing you to create custom roles tailored to your team’s needs. These roles range from administrators and managers to troubleshooters and billing specialists, giving you granular control over who has access to what.

  • Superior Support and Consulting Services for Business Users – Netdata’s Business plan users receive high-priority response support and next-business-day technical assistance, ensuring you always have the help you need when you need it. Additionally, initial deployment consulting services are available upon request, allowing you to tap into expert knowledge to optimize your monitoring setup.

  • Advanced Features for the Modern IT Environment – Netdata Pro and Business plans also come with advanced features like custom dashboards (including Grafana), secure worldwide remote access to dashboards, machine learning and anomaly advisor for all metrics, advanced troubleshooting with metric correlations, microservices monitoring (including Kubernetes), and much more.

Enhancing Data Availability with Netdata’s Distributed Nature

Netdata’s distributed architecture ensures the high-availability of your monitoring system. For recommendations on data replication to further enhance data availability, refer to our Data Replication guide.

Netdata: Designed by Professionals, for Professionals

Netdata is a tool designed by system administrators, DevOps engineers, and developers to collect everything, help visualize metrics, troubleshoot complex performance problems, and make data interoperable with the rest of your monitoring stack.

Netdata stands as a testament to the power of open-source software, providing a robust, real-time monitoring tool that doesn’t compromise on comprehensiveness or user-friendliness. Whether you are managing a small web server or an extensive cloud deployment, Netdata is an invaluable tool in your monitoring toolkit.

How Does Netdata Make Monitoring Simpler?

One of Netdata’s key strengths is its simplicity. It’s designed to operate out of the box, with no initial configuration needed. This level of convenience is a boon for users who want a fast, efficient way to start monitoring their systems.

At the same time, Netdata is packed with advanced features and customization options for users who want to take a more hands-on approach. With this balance of simplicity and power, Netdata is ideally suited for both novices and experienced users.

Netdata’s Unique Approach to Real-Time Metrics Collection

Netdata’s real-time metric collection capability sets it apart from other monitoring tools. The platform constantly gathers and presents thousands of metrics from across your infrastructure, providing up-to-the-second insights into system performance. This feature can be invaluable when you’re troubleshooting an issue or trying to understand sudden changes in performance.

Troubleshooting Made Easier with Netdata

When a problem arises, configuring your monitoring tool is the last thing you want to worry about. That’s why Netdata’s out-of-the-box functionality is such a game-changer. It’s safe to install mid-incident and it immediately starts providing insights that can help you resolve issues faster.

Moreover, Netdata’s powerful visualization capabilities make it easy to understand your system’s status at a glance. This feature is crucial when every second counts.

Netdata’s Open-Source Philosophy

Netdata’s open-source nature is another significant advantage. The open-source model encourages community involvement and continuous improvement. This collective approach to development means that Netdata is constantly evolving and adapting to meet users’ needs. Furthermore, being open-source means that Netdata is free to use, reducing barriers to entry and making powerful monitoring tools accessible to everyone.

Netdata Installation Across Platforms

Netdata is versatile. You can install Netdata on various Linux distributions, including Ubuntu, Debian, and CentOS, and on many other operating systems like FreeBSD and macOS. It even extends to container platforms like Kubernetes clusters and Docker. And the best part? No sudo is required for the installation.

When adding an agent, you can select between the recently published stable build and the recently published nightly build. If you want the most recently published build, the nightly version includes the latest features. The Netdata team publishes both, and these major versions are available for downloading the Netdata agent.

Netdata cloud deployments aggregate the agents across your environment so you can see the metrics across the entire landscape of your infrastructure. Here I am installing the nightly build. Again, if you want just the major version you can install the stable release.

Adding nodes to Netdata

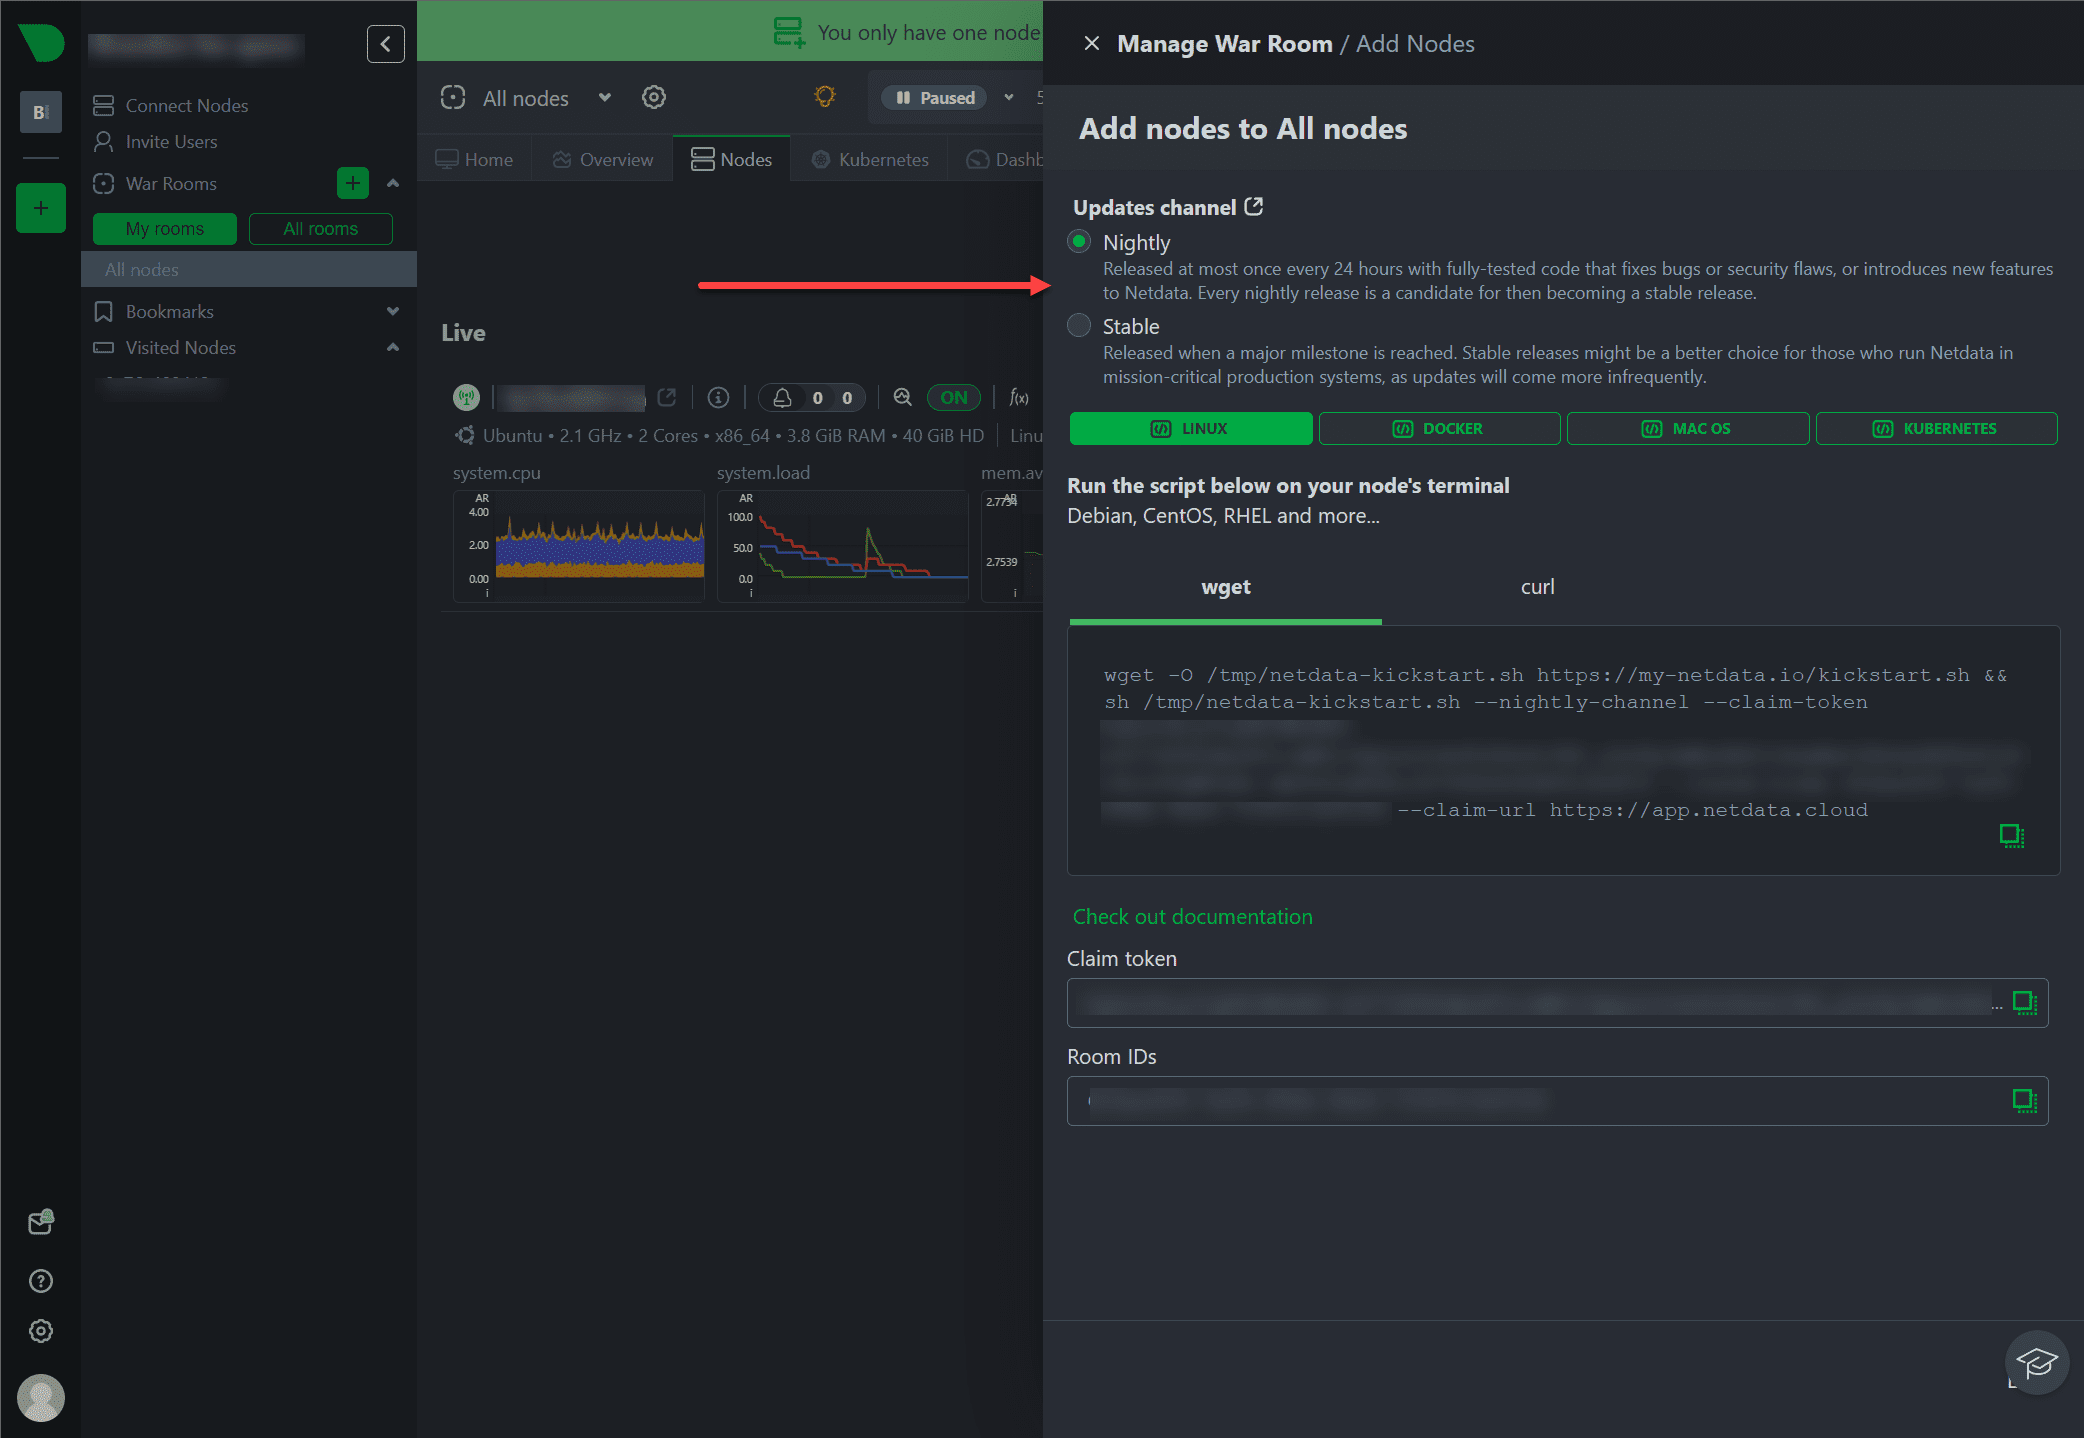
You can check the type of node you would like to add: Linux, Docker, MacOS, and Kubernetes.

Selecting the platform to add a node

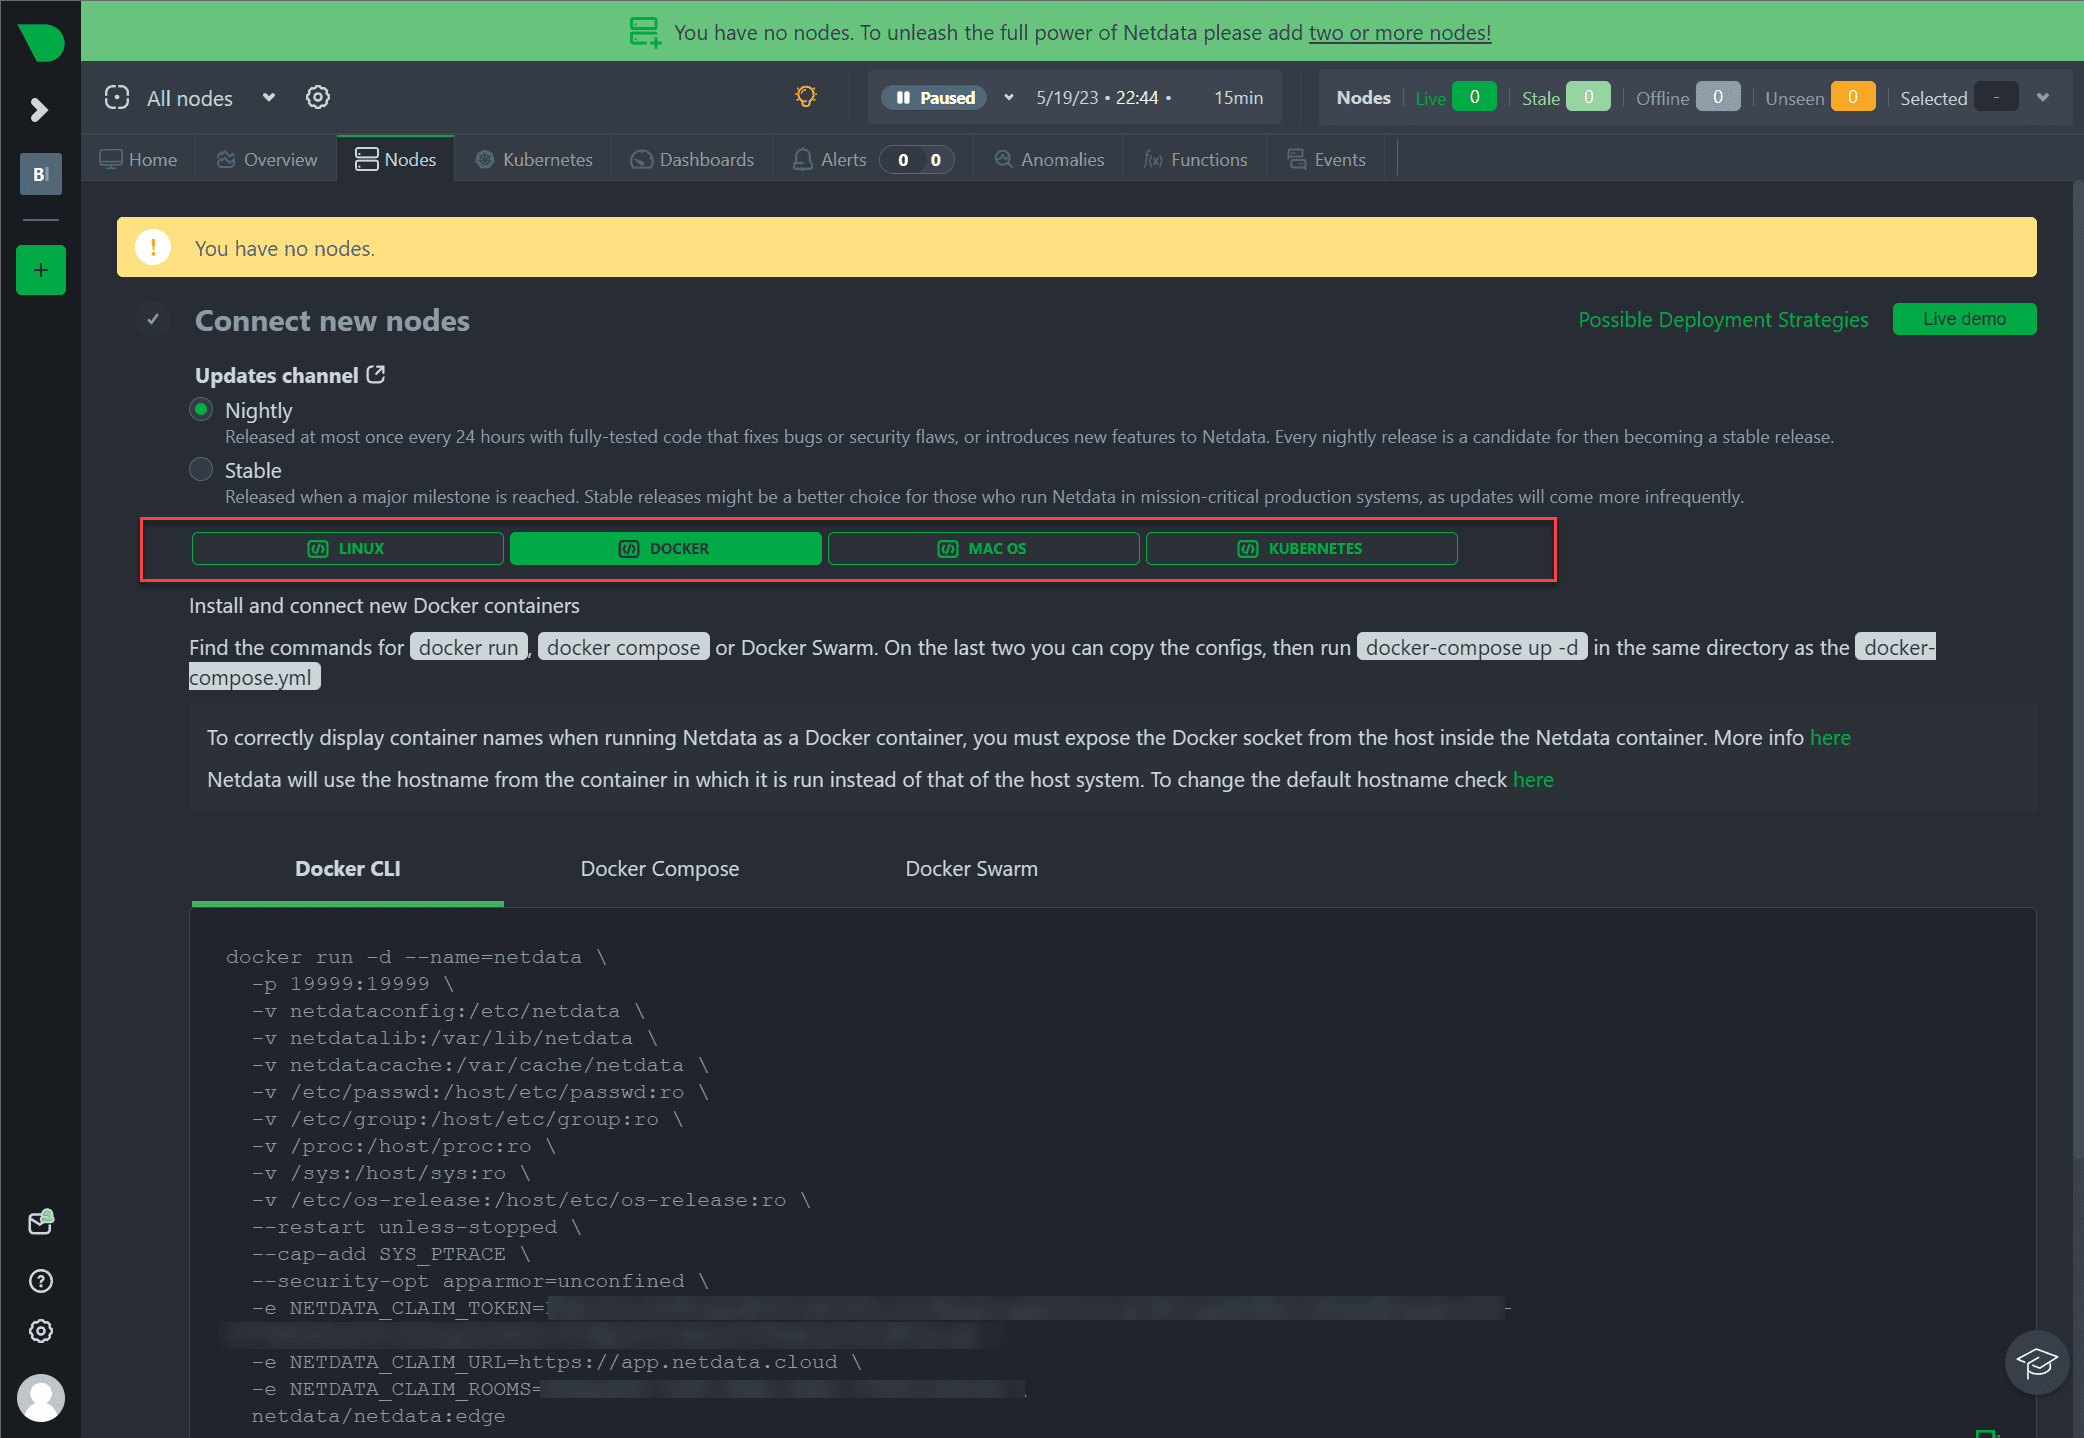
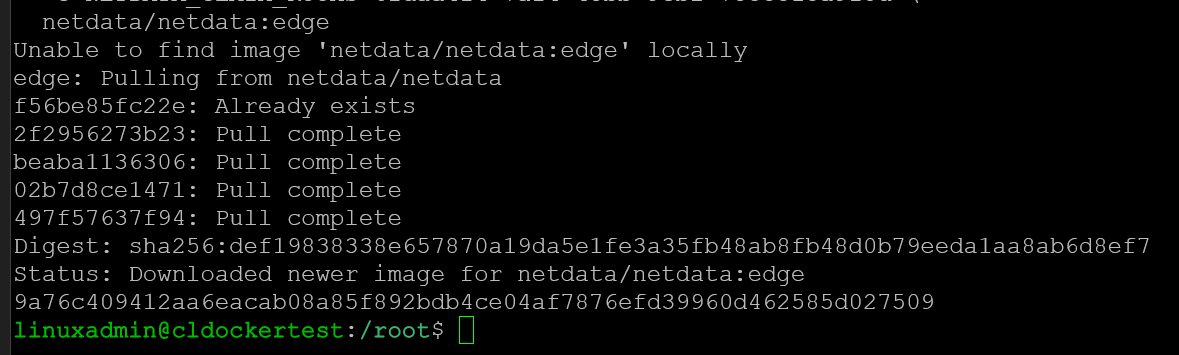
Using the simple Docker CLI command, the Docker run command pulls the image and spins up the new agent container.

Pulling the Docker image

Looking at the monitoring dashboards

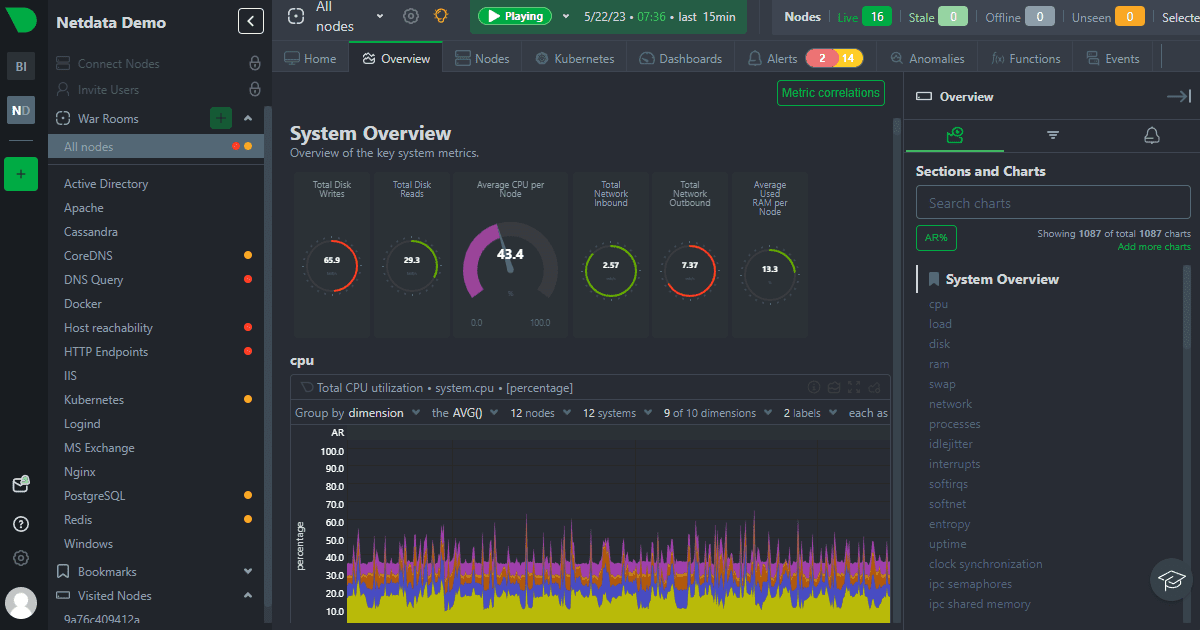
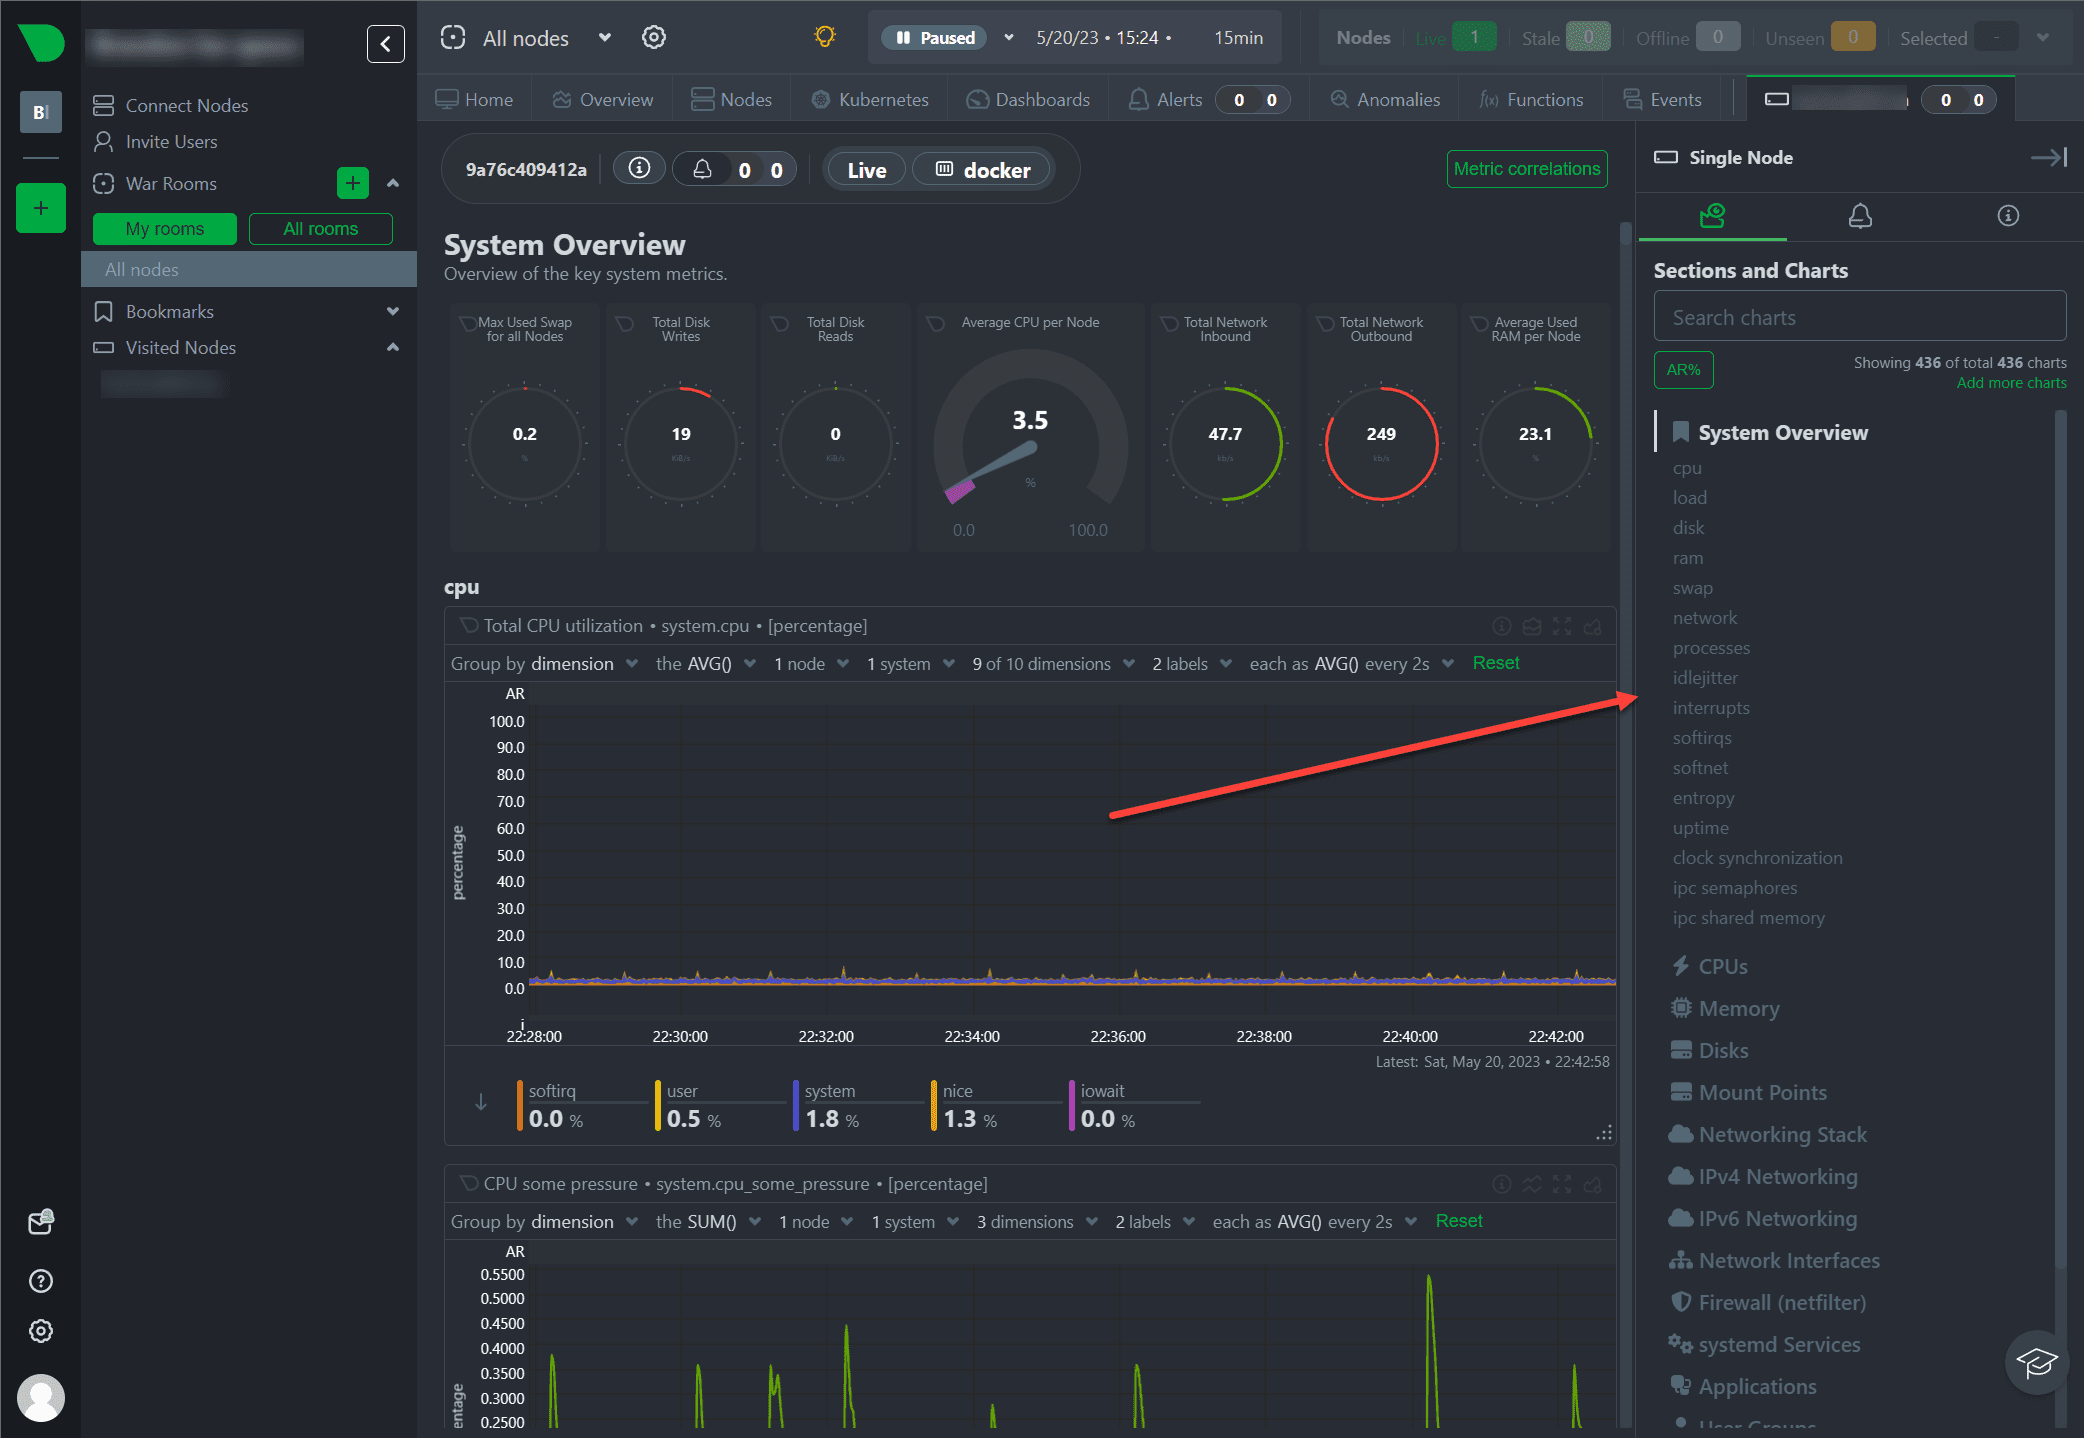
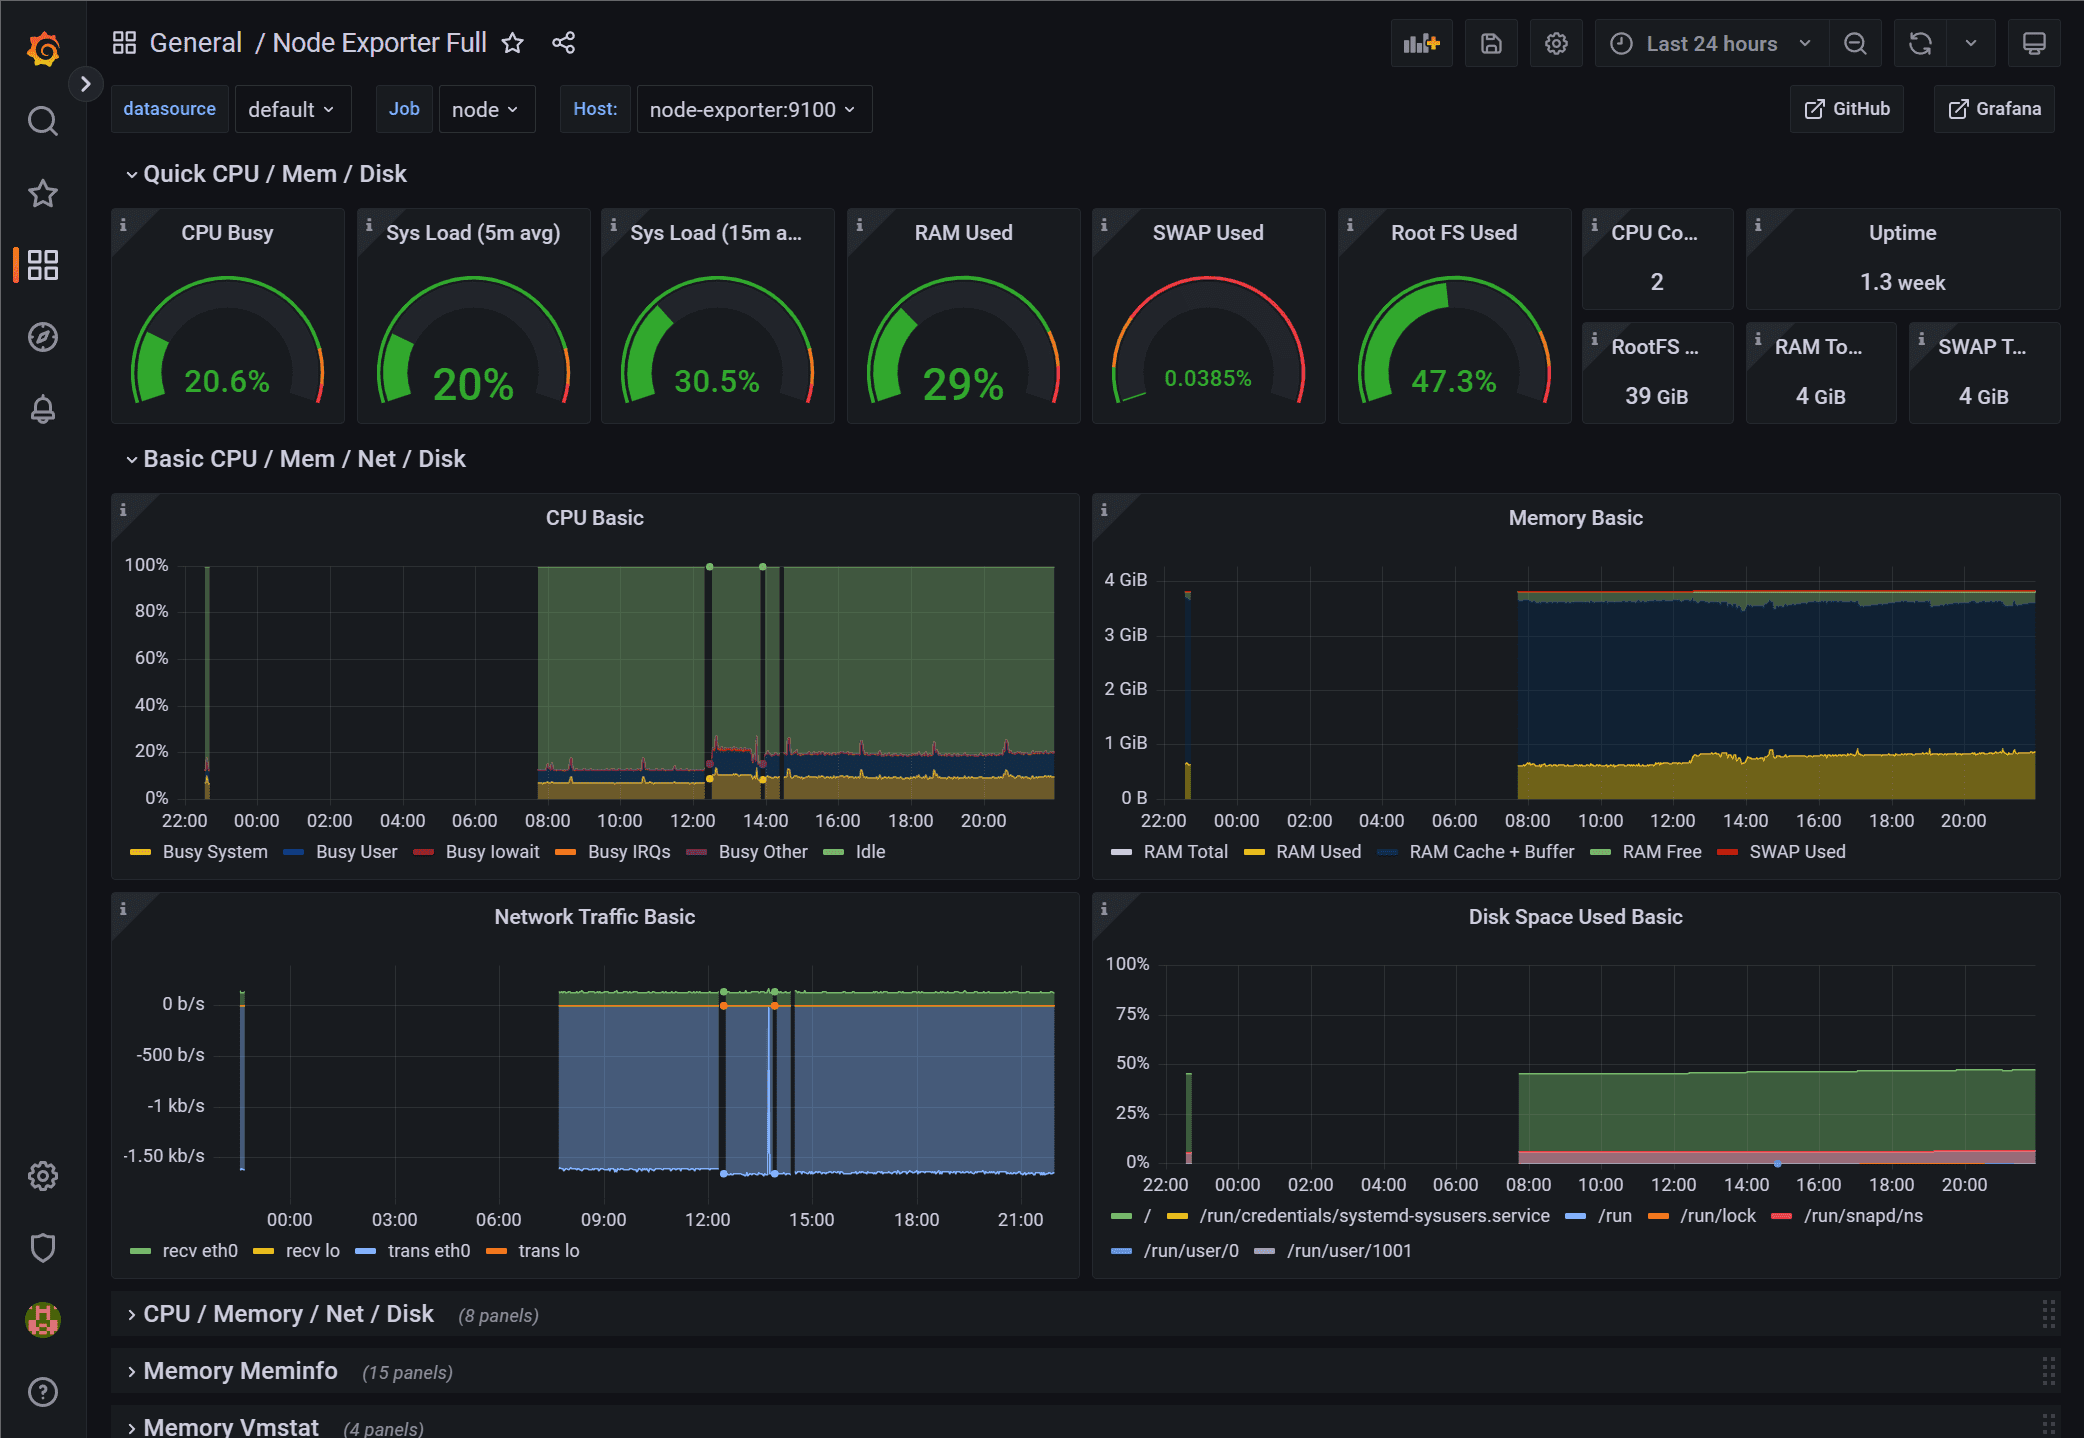
The infrastructure monitoring dashboards are beautiful in Netdata. As you can see in the shot below, without needing to add anything to create the dashboard you see below, you get all the metrics and monitors added without any configuration. This is what I saw after simply running the Docker container.

Immediately, you will see all the relevant monitoring metrics and information regarding normal metrics like CPU, RAM, Disk, Network, etc.

Looking at metrics and monitoring

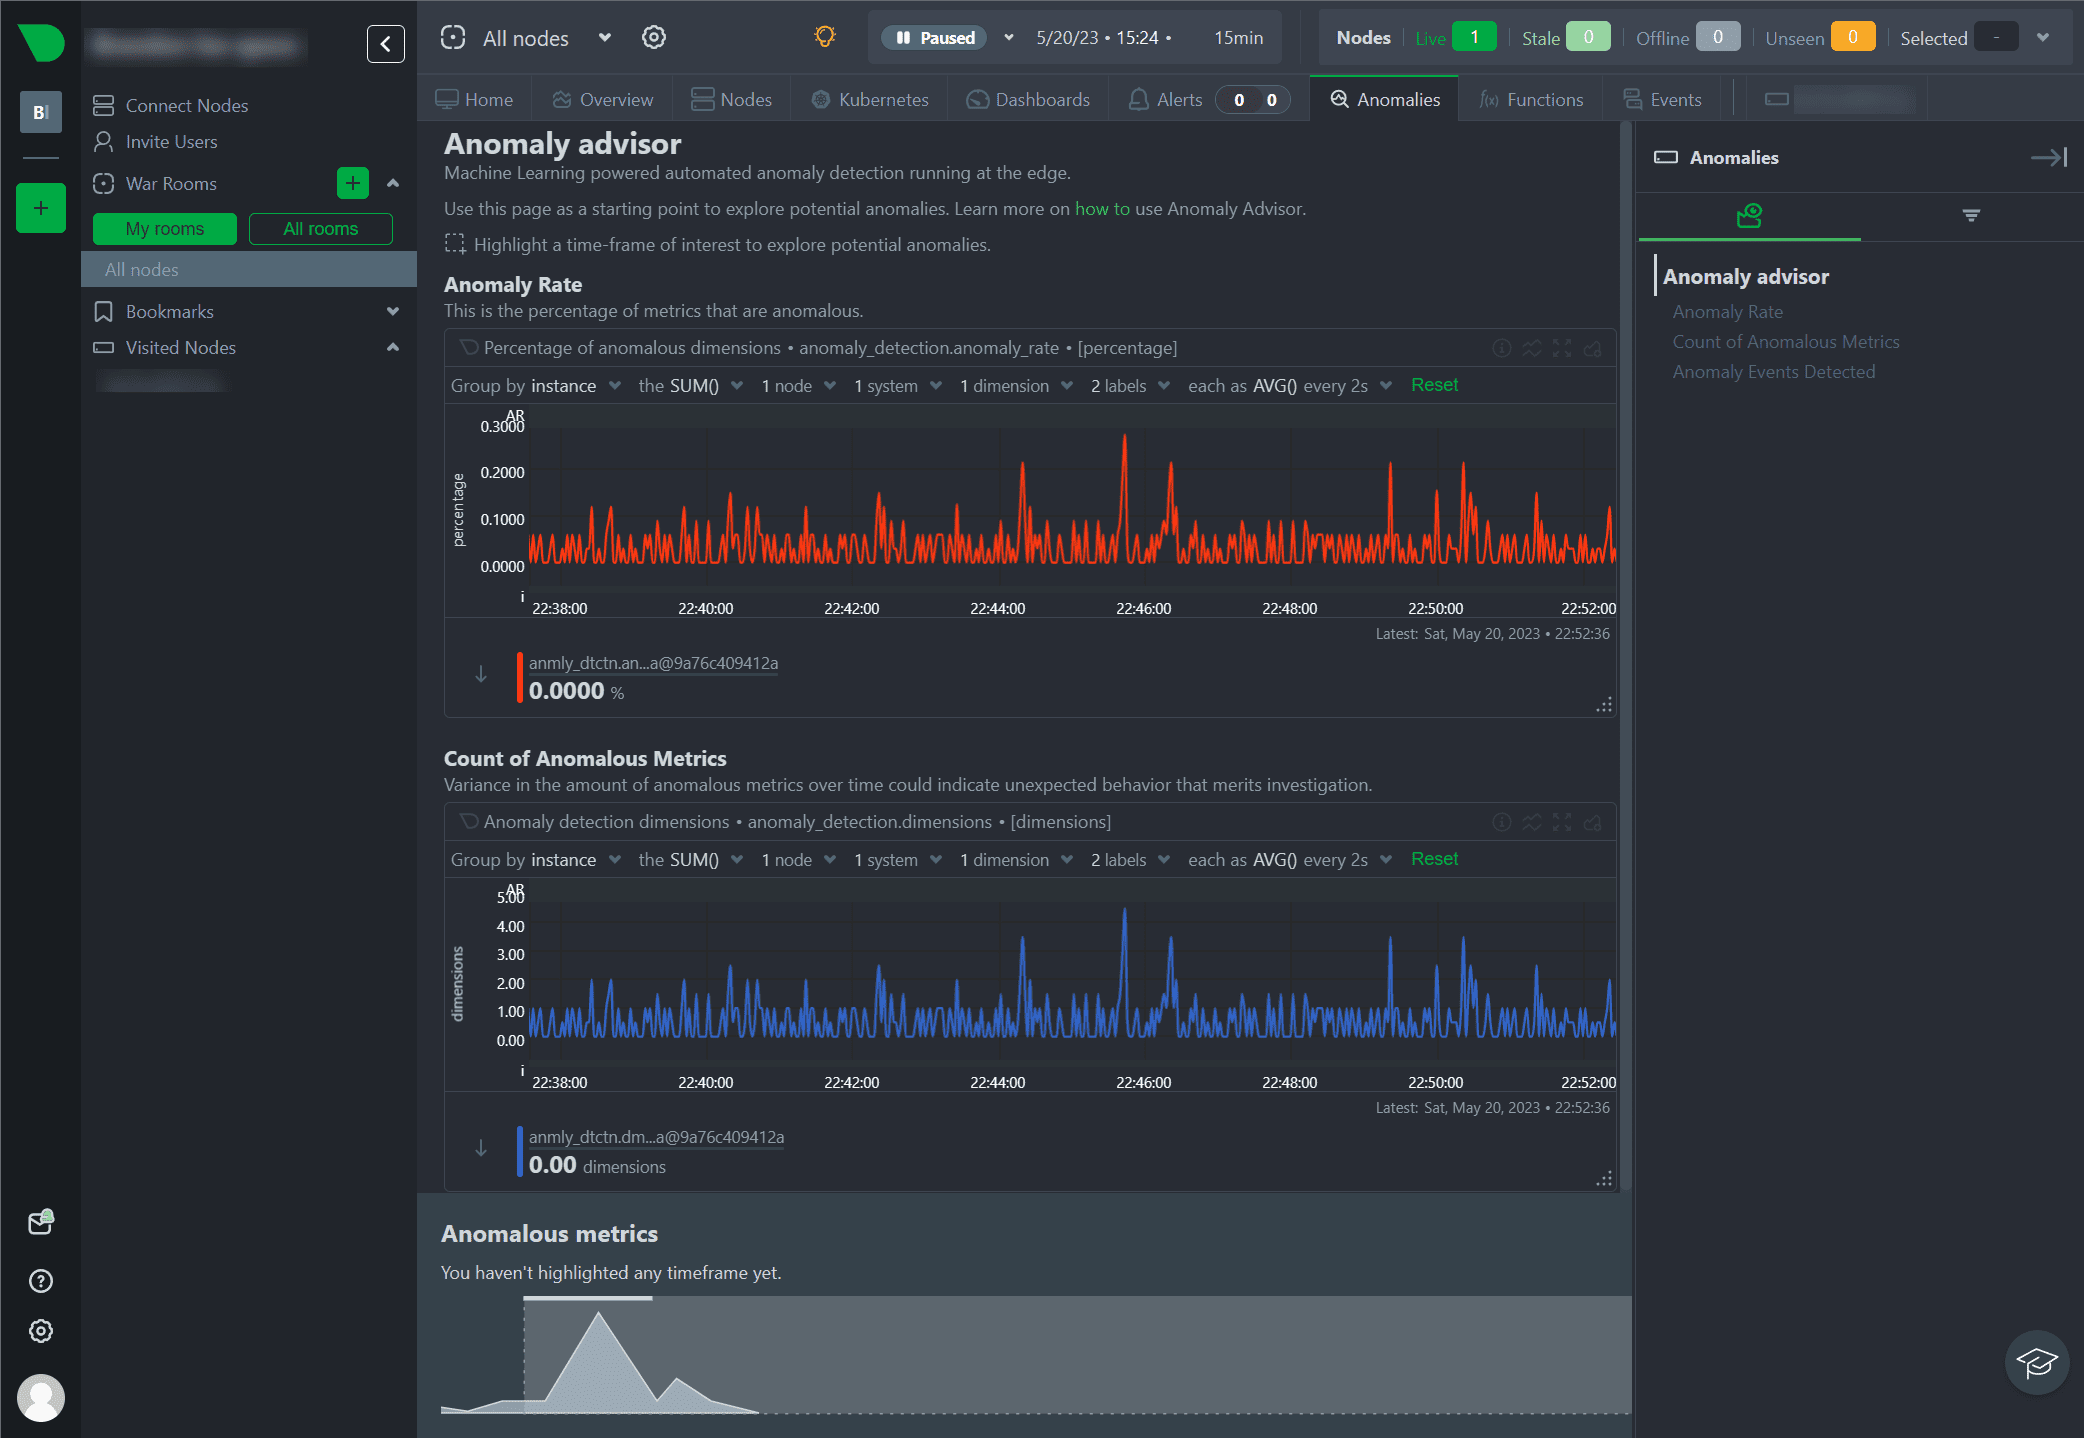
Netdata Machine Learning Anomaly Advisor

The Anomaly Advisor allows admins to quickly see potentially anomalous metrics and charts related to a particular highlight window of interest.

To utilize the Anomaly Advisor, your version needs to be v1.35.0-29-nightly or later. If your version is earlier, you must enable Machine Learning (ML) on your nodes. Enabling ML is straightforward, starting with a small configuration change in your netdata.conf file.

Once the anomaly detection models are trained on the Agent, which usually takes a few hours, you can enable the Anomaly Advisor feature in Netdata Cloud.

Machine learning enabled anomaly detection

Wrapping up

Whether you’re a system administrator, a DevOps engineer, or a developer, Netdata is designed to simplify your monitoring needs. With its real-time metrics, simplicity of use, machine learning, and powerful troubleshooting capabilities, Netdata is an essential tool for anyone managing IT infrastructure. Its open-source nature encourages constant improvement and evolution, ensuring it stays at the cutting edge of infrastructure monitoring.


Subscribe to VirtualizationHowto via Email

Enter your email address to subscribe to this blog and receive notifications of new posts by email.

Brandon Lee

Brandon Lee is the Senior Writer, Engineer and owner at Virtualizationhowto.com and has over two decades of experience in Information Technology. Having worked for numerous Fortune 500 companies as well as in various industries, Brandon has extensive experience in various IT segments and is a strong advocate for open source technologies. Brandon holds many industry certifications, loves the outdoors and spending time with family.

Leave a Reply

Your email address will not be published. Required fields are marked *

This site uses Akismet to reduce spam. Learn how your comment data is processed.