I am always on the lookout for new free and open-source tools in the home lab and production environments. One really excellent tool discovered recently is a tool called SigNoz. SigNoz is a free and open-source syslog server and observability program that provides an open-source alternative to Datadog, Relic, and others. Let’s look at SigNoz and see some of the features it offers. We will also see how to set it up as an open-source log platform.
Table of contents
SigNoz: The Open Source Answer to Datadog
Most have heard of Datadog and other solutions. However, SigNoz is a really great alternative to some of the paid solutions, and it is free and open-source.
SigNoz is an open-source observability platform for developers and operations teams. It is designed to offer an application metrics overview and provides things like traces, metrics, and logging dashboard, giving you a single pane of glass view of various performance and metrics.
Options for install
One of the really neat things about SigNoz is you can use it with the cloud (hosted) version or you can self-host your installation. The self-hosted installation is free. The cloud (hosted) solution has no caps for 30 days
Why Consider Open Source?
As with any tool, it’s important to understand the benefits of going the open-source route. SigNoz’s open-source architecture ensures transparency, allowing you to inspect its code and understand its inner workings.
In addition, this model allows for a community-driven approach, providing continuous improvements and support from community members. If you choose the self-hosted option, SigNoz allows companies to control their own customer data, which many consider an advantage over SaaS vendors or even required in some cases.
The Power of OpenTelemetry
SigNoz uses OpenTelemetry for data collection. As an open-source observability solution backed by the Cloud Native Computing Foundation, OpenTelemetry is becoming the gold standard in telemetry data collection, covering traces, metrics, and logs.
SigNoz’s compatibility with all frameworks and languages supported by OpenTelemetry provides many integrations for developers and DevOps.
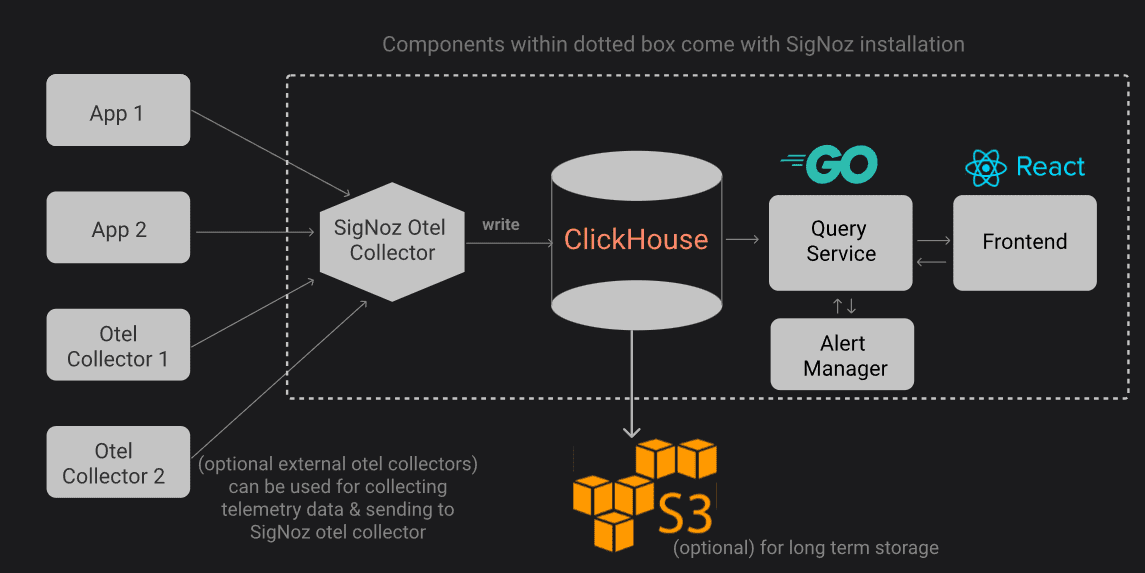
Architecture
SigNoz’s architecture includes components like the OpenTelemetry Collector, which harvests telemetry data, and ClickHouse, a high-performance database management system.
The query service acts as a bridge between ClickHouse and the ReactJS and TypeScript-based front end. Below is the architecture of the Signoz solution
SigNoz Features and Capabilities
Note the following features of SigNoz. One of the key strengths of SigNoz lies in its ability to visualize trace data, which allows developers a clear view of how requests flow through the system.
This distributed tracing capability lets you pinpoint latency issues, ensuring your users get a smooth experience. Furthermore, with the option to filter traces and run aggregates on trace data, SigNoz makes it easier than ever to gather crucial insights.
Beyond traces, SigNoz offers robust metrics that showcase error rates, external API calls, p99 latency, and more. With the advanced log query builder, users can also filter and query logs, creating alerts based on specific log attributes.
This level of detail and customization ensures you can monitor your application’s health, efficiently making data-driven decisions.
APM (Application Performance Management)
Gain insights with out-of-the-box charts showcasing application metrics such as p90, p99 latency, error rates, and request rates.
Keep an eye on RED metrics essential for pivotal operations in any given service
Scrutinize database interactions and external API calls initiated by services
Utilize service maps for a holistic view of your application’s topology
Distributed Tracing
Achieve end-to-end visibility into your services, enriched with contextual tags and attributes
Perform aggregates on trace data, including operations like sum, average, and p99 latency calculations
Segment your trace data using diverse attributes, from HTTP URLs to service names, to pinpoint specific issues
Visualize request flows effortlessly with intuitive Flamegraphs and Gantt charts
Metrics and Dashboards
Monitor metrics that resonate with your business objectives
SigNoz supports OpenTelemetry metrics SDK and enables a Prometheus receiver to capture metrics from a running Prometheus instance
Design and customize dashboards to monitor external calls, assess JVM metrics, or track API endpoints
Log Management
Ingest, process, and sift through logs of various volume sizes
Integrate with OpenTelemetry logs or tap into your existing log pipeline
Utilize tailing, search mechanisms, and a log query builder, providing control over your logs
Rely on a columnar database for storing logs and log analytics
Exceptions Monitoring
Capture exceptions in programming languages like Python, Java, Ruby, and Javascript
View exception-related data with stack traces, exception attributes, and span data
Group exceptions and manage custom exceptions
Navigate from recorded exceptions to related traces, visualizing the error within the trace graph
Alerts
Set up alerts with the DIY query builder
Support for PromQL, allowing users to acquaint themselves with the Prometheus alert manager.
Integrate with various notification channels, including Slack and PagerDuty
SigNoz self-hosted installation
I will demonstrate the self-hosted Docker standalone installation for simplicity to see how easy it is to get up and running with a SigNoz deployment.
Pulling down the deployment package
Below is an Ubuntu 22.04 LTS server that I installed as a Docker host. To pull down the initial package, run the following command:
git clone -b main https://github.com/SigNoz/signoz.git && cd signoz/deploy/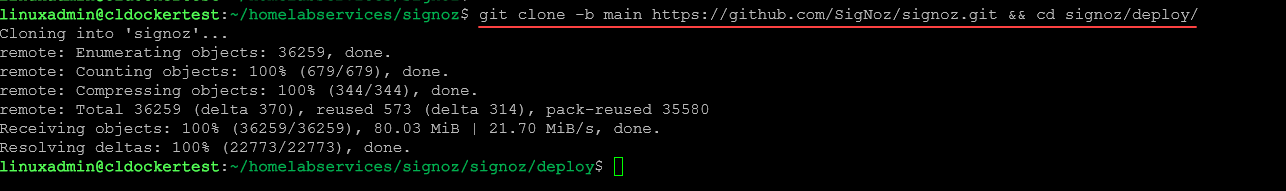
Deployment directory and running docker-compose
I have changed into the deployment directory for running the docker-compose up -d command.

Running the docker-compose up -d command.
docker-compose up -d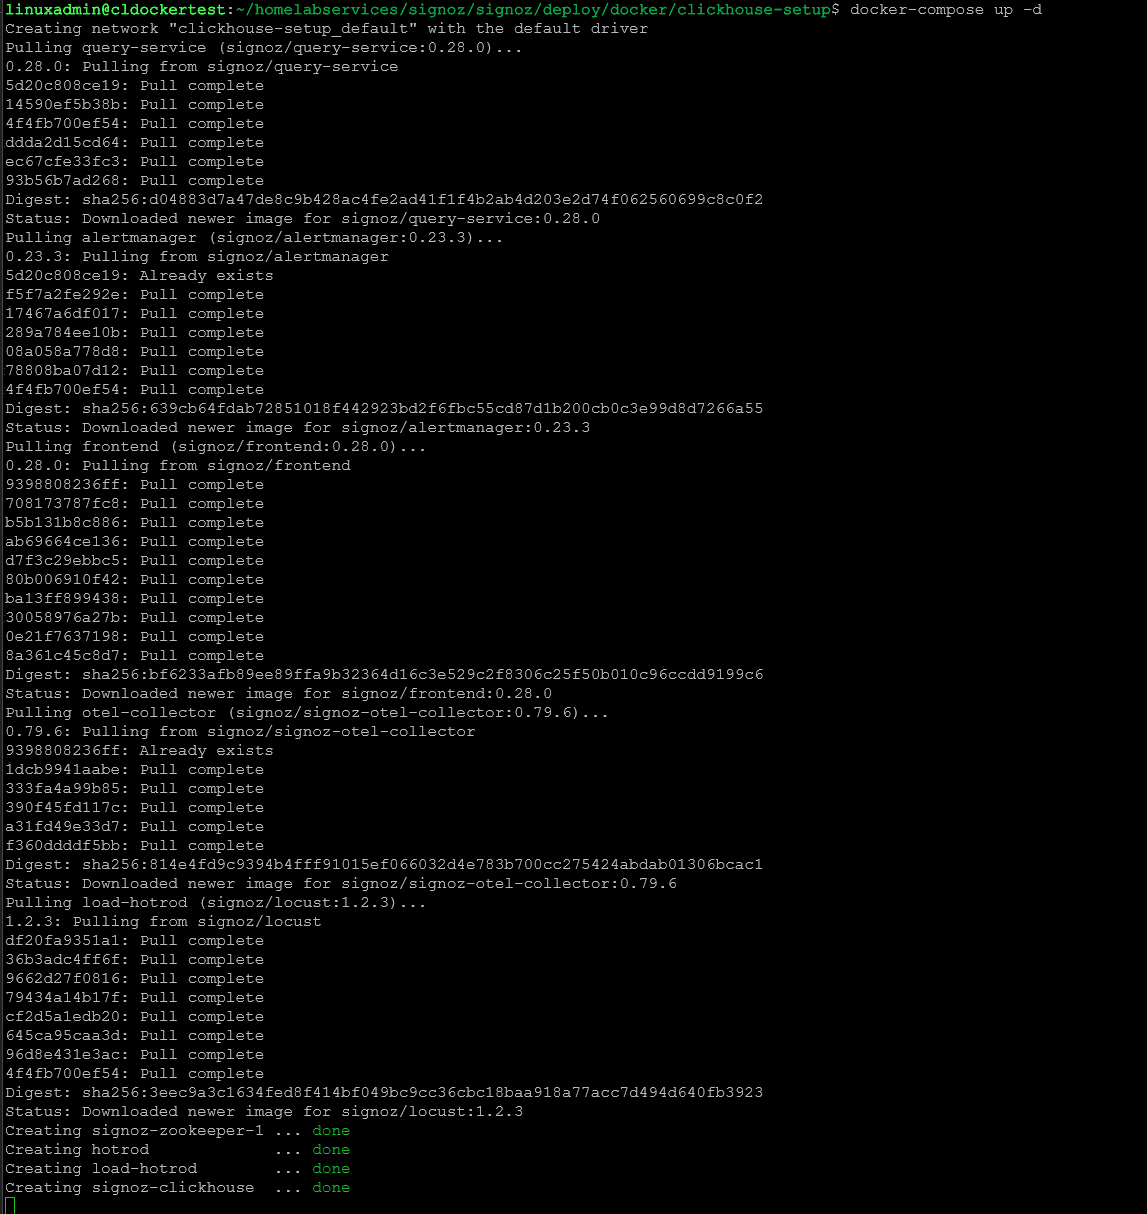
Be sure and check the status of your docker-compose deployment:
docker-compose ps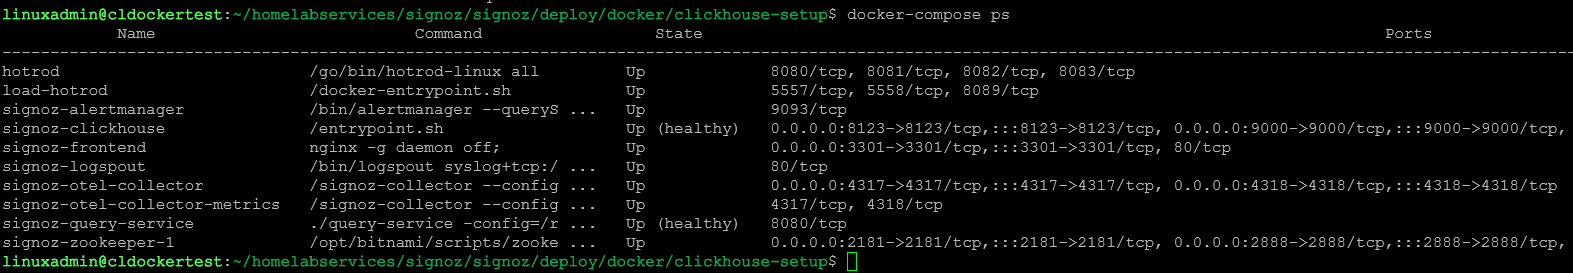
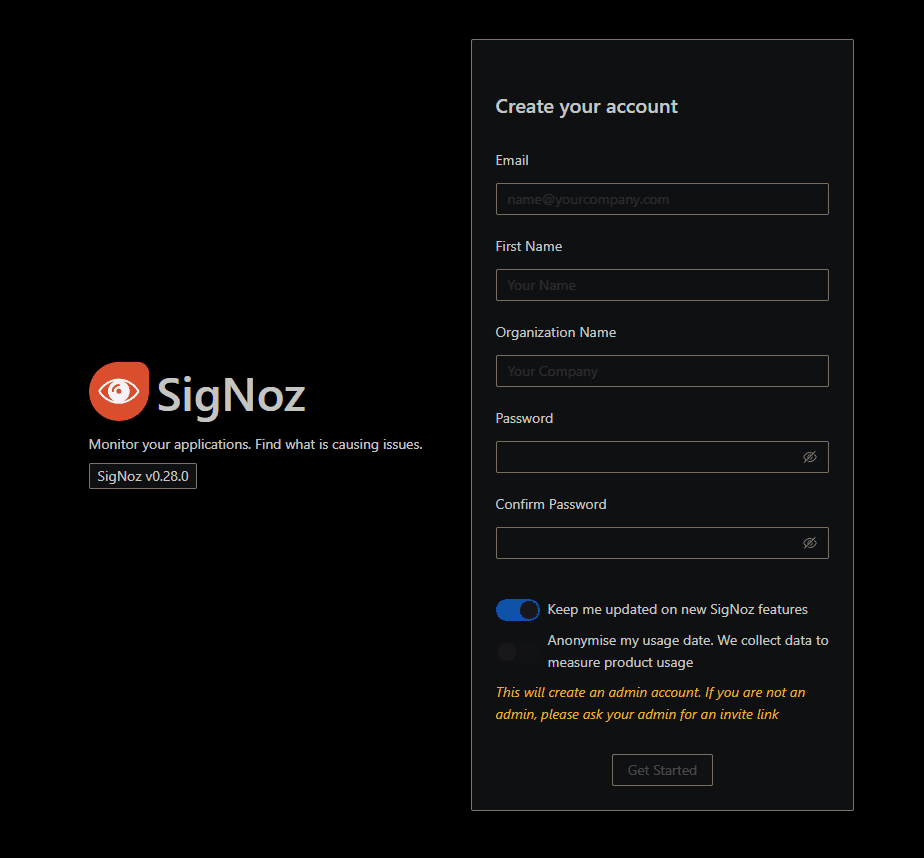
Creating your SigNoz login
SigNoz will have you create an account to login the first time.
Configuring a SigNoz Syslog receiver
Now that we have a basic deployment of SigNoz, let’s see what we need to do to add a Syslog receiver. To do this, I just followed the documentation found here: Collecting syslogs | SigNoz.
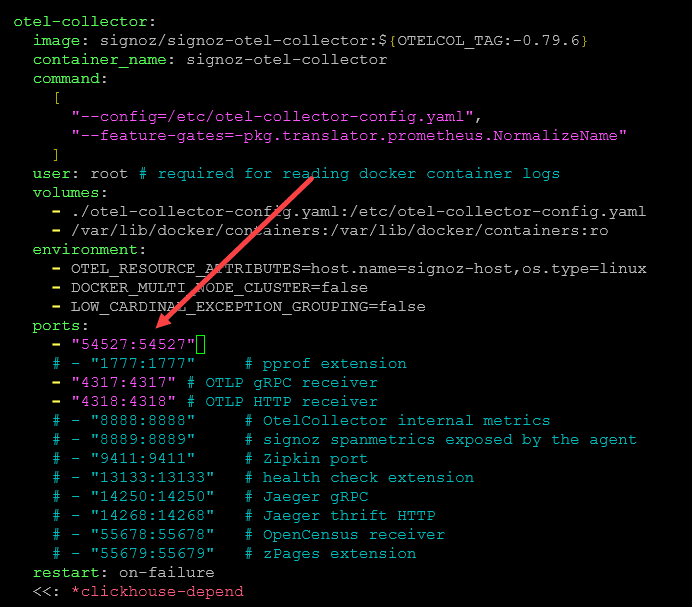
Add a port to your otel-collector container for syslog
First, I added a port listener in the docker-compose.yaml file for the otel-collector container. This port is the port that will listen for syslog traffic. I have also tested this with the standard syslogs ports of 514 and 1514. However, below, I was just following the example provided by SigNoz. You can change this port to what you would like.
Adding syslog receiver to the otel-collect-config
We add a section to the otel-collector-config.yaml file that looks like this:
receivers:
  syslog:
    tcp:
      listen_address: "0.0.0.0:54527"
    protocol: rfc3164
    location: UTC
    operators:
      - type: move
        from: attributes.message
        to: body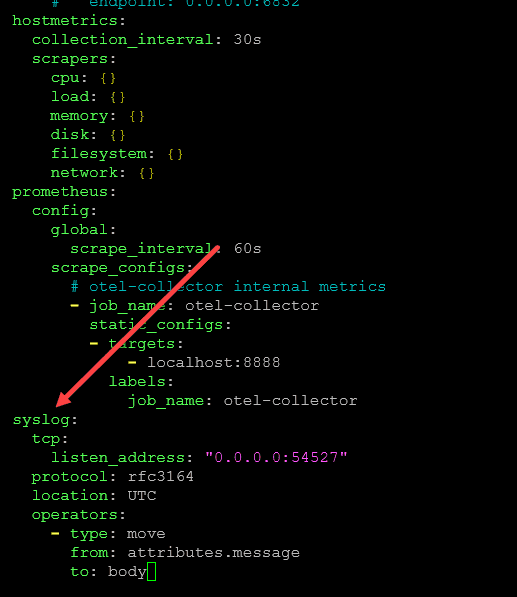
Initializing the syslog configuration
After that, just tear down your docker-compose deployment and bring it back up. Or alternatively, you can have the configuration in place before you bring up your container stack the first time.
docker-compose down
docker-compose up -d
Below, I pointed my vCenter Server to SigNoz just to get some data flowing and it started displaying logs immediately.
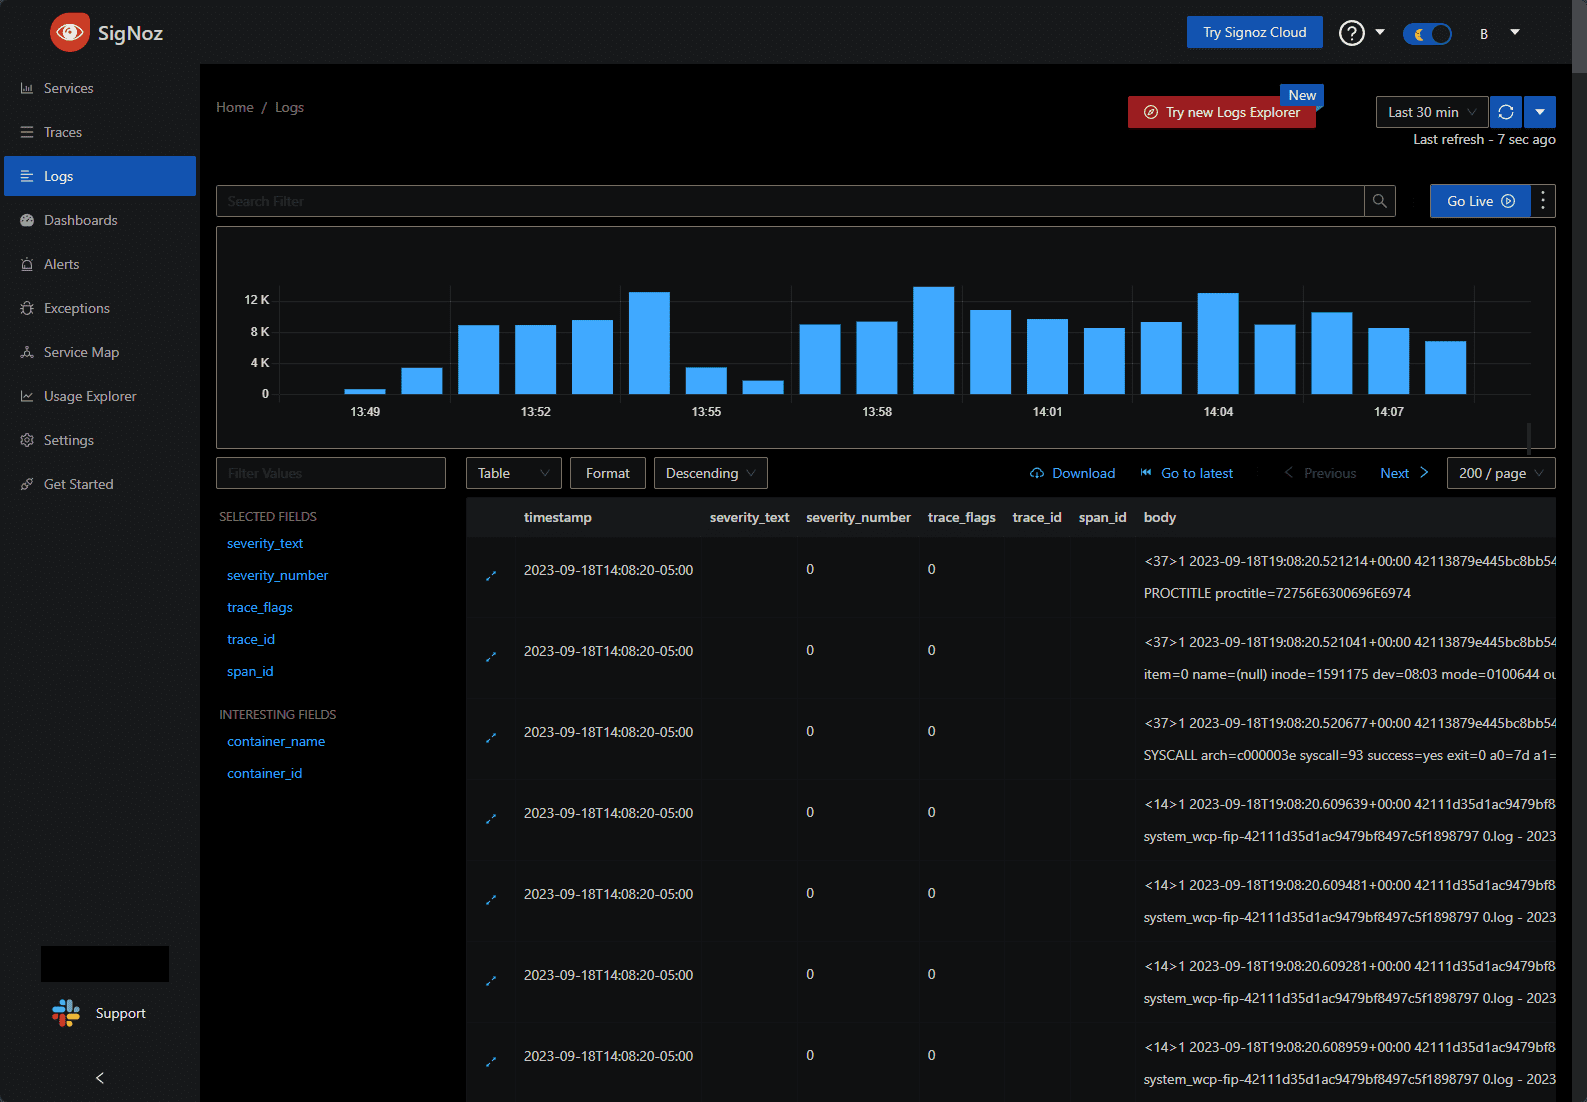
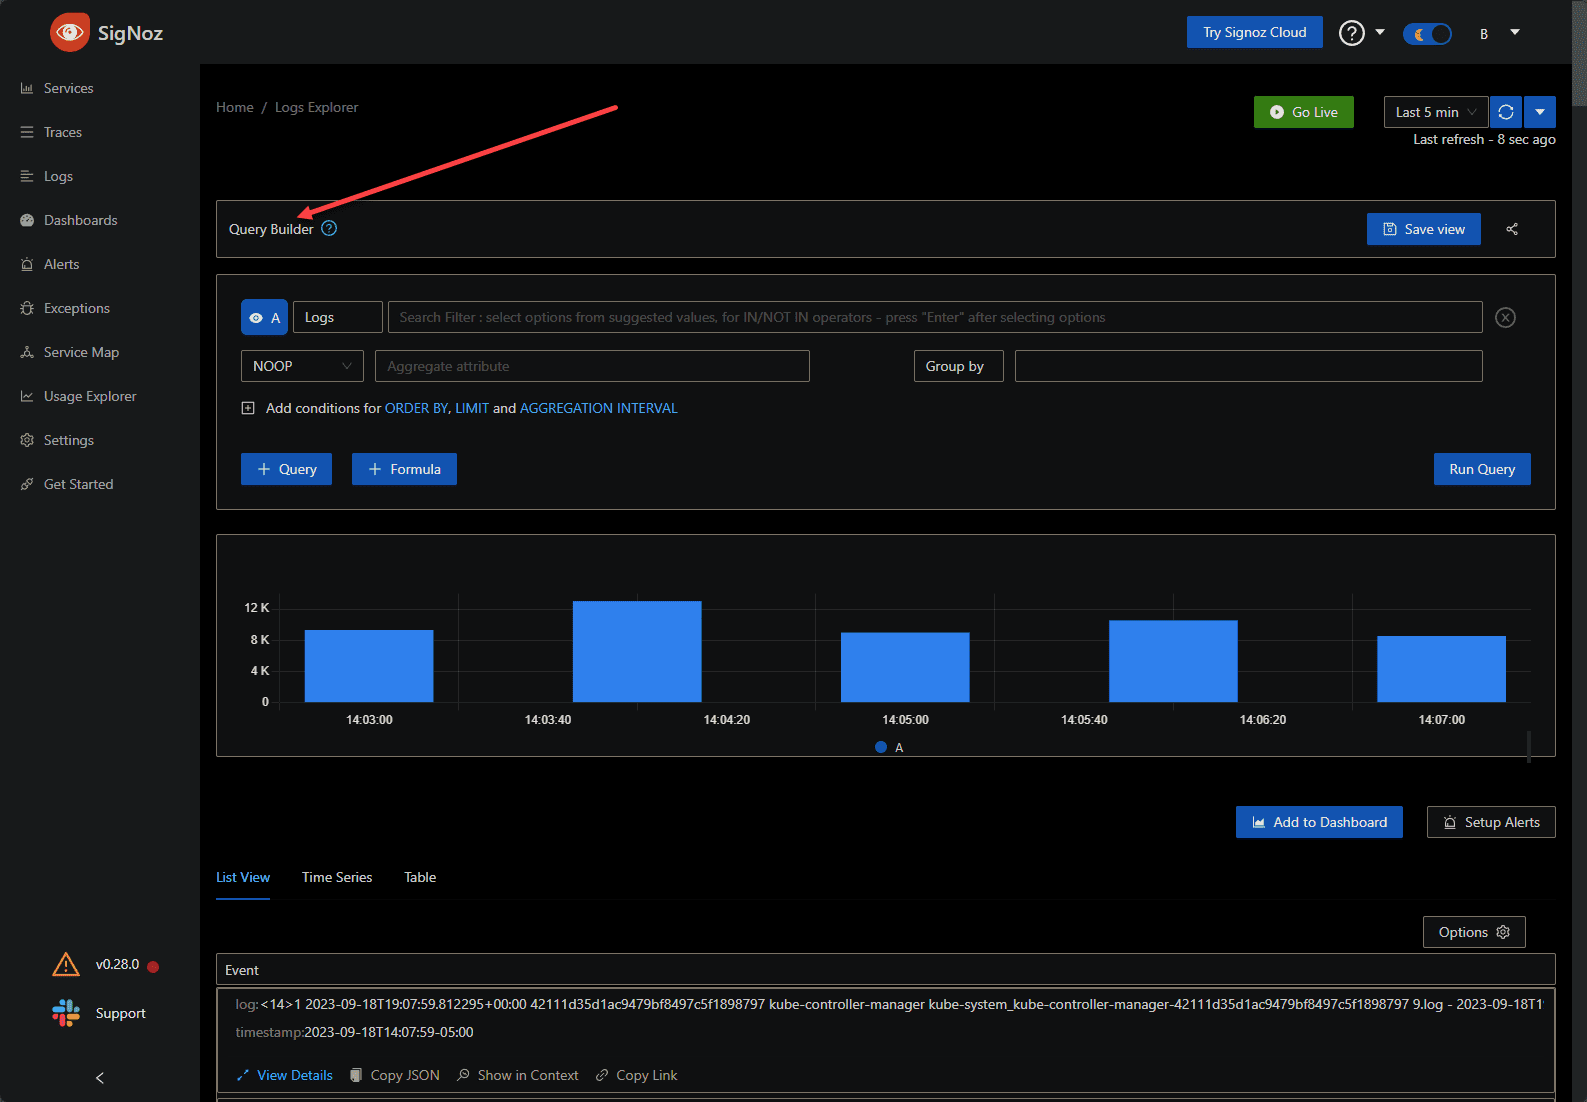
This view is in the log explorer which is nice as you can do custom queries to view your logs, etc.
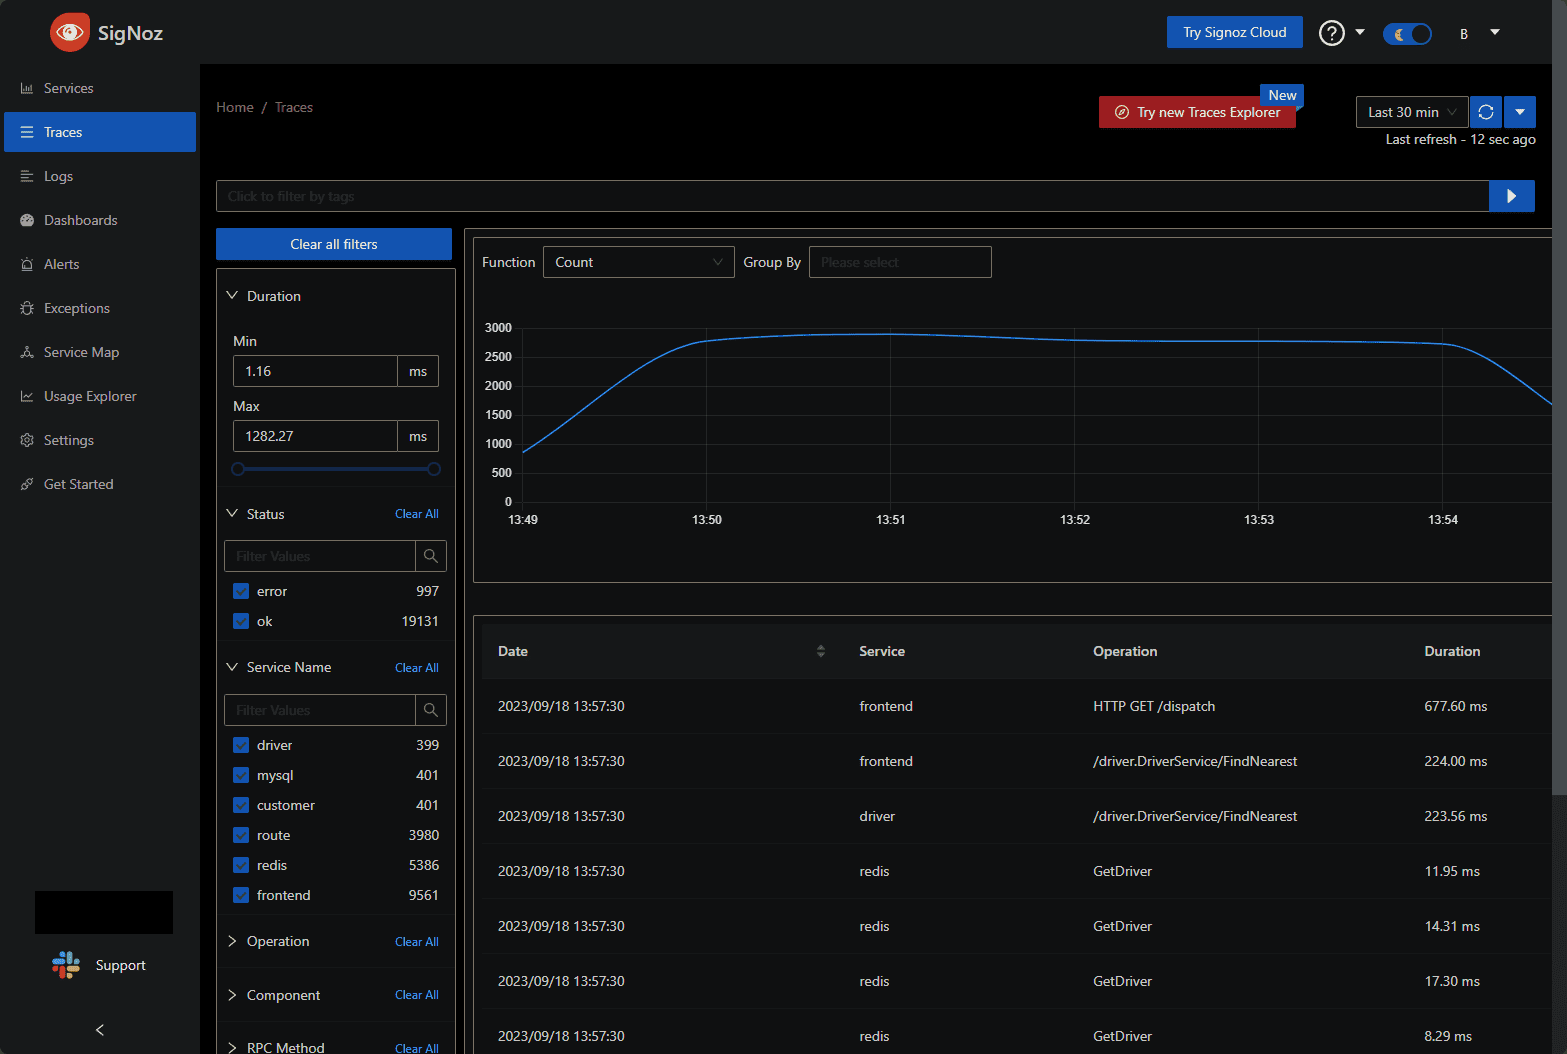
One of the really great features and capabilities of SigNoz is filtered traces and application overview metrics, allowing you to have a detailed picture of your application performance. Below is the trace dashboard from the default data included with SigNoz.
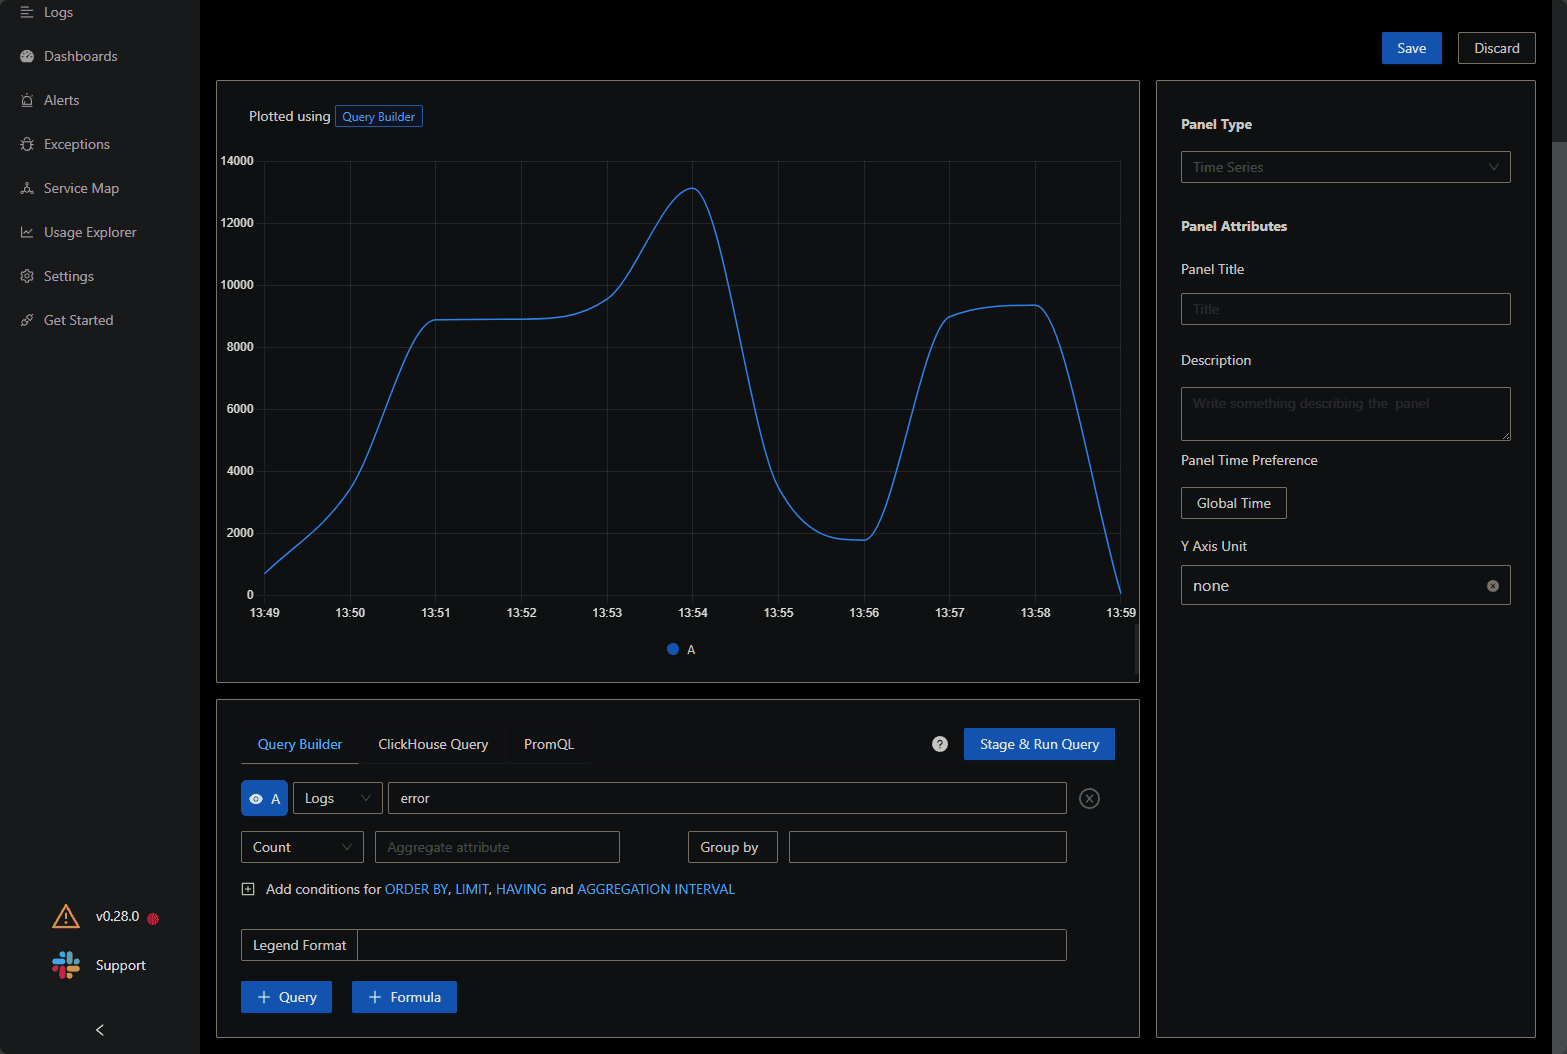
You can also build dashboards based on the filtered query data from the query builder.
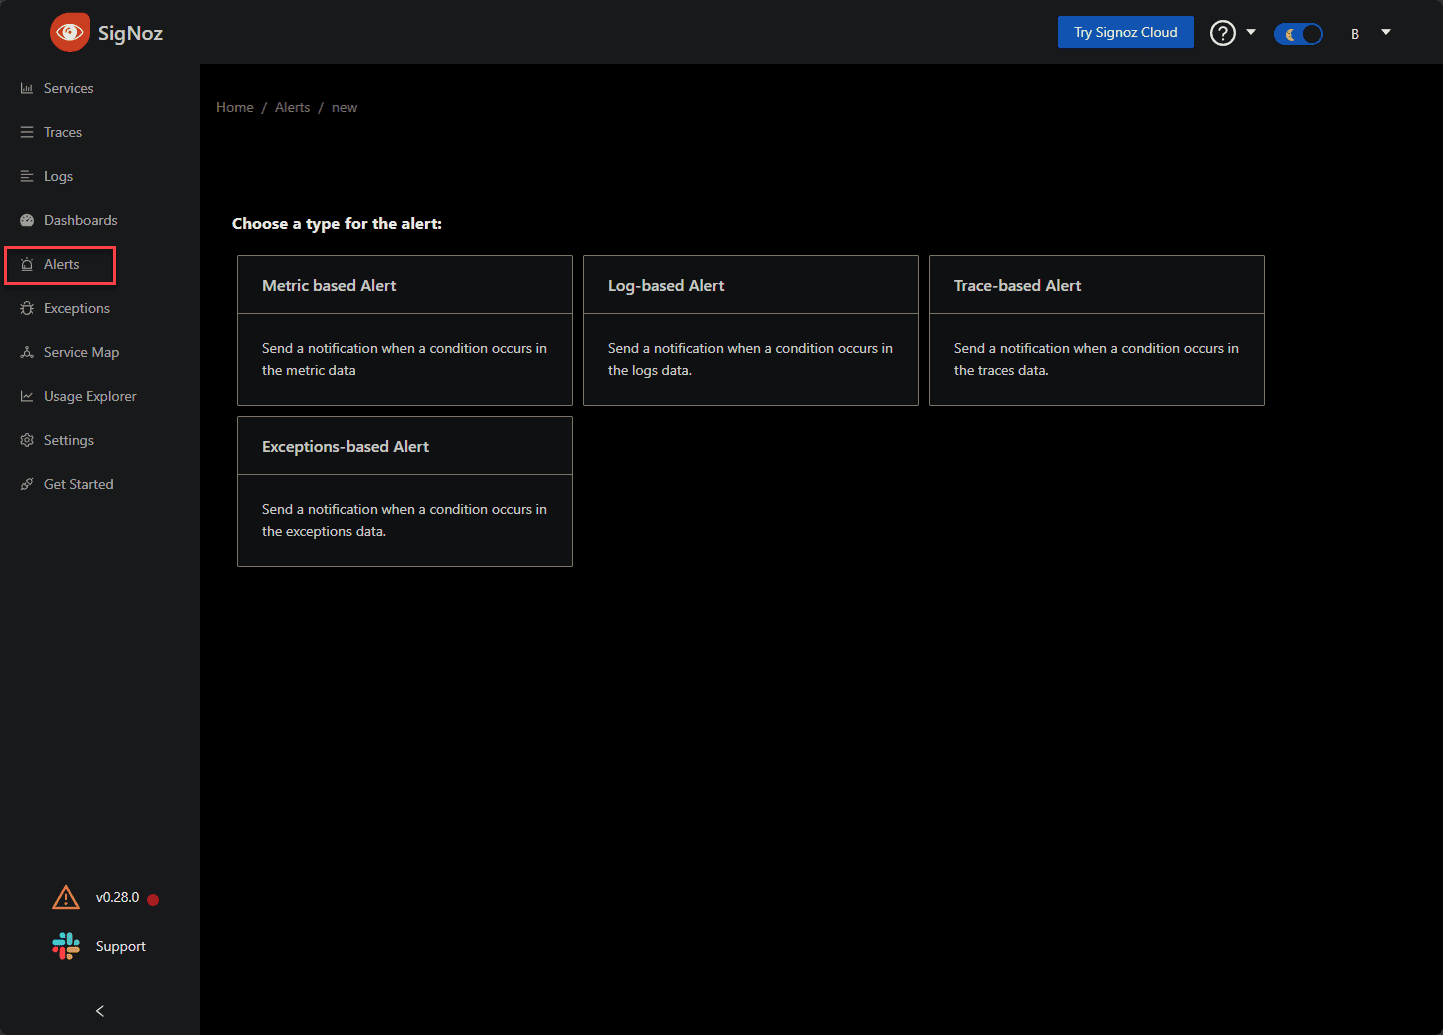
Another small feature but extremely important is you can set alerts in the SigNoz solution. Click alerts to view the alert options.
Wrapping up
If you are looking for a great solution for spinning up a free and open-source Syslog server, SigNoz definitely fits the bill. However, saying that it is only a Syslog server would vastly understate what it can do. Really, SigNoz can do many different things aside from simple log aggregation.
For development or if you are looking for an open-source Datadog or New Relic, SigNoz is an excellent option. It offers many features to monitor, analyze, and improve application performance. It is also easier to spin up than a solution like Promtail, Grafana, and Loki.
Google is updating how articles are shown. Don’t miss our leading home lab and tech content, written by humans, by setting Virtualization Howto as a preferred source.
About The Author

How config from syslog (Other Server/Client) Send to signoz?