PRTG VMware Host Hardware Status Monitor with SNMP
Monitoring is often a not so glorious or desirable thing to do. One of those “have to haves” that, depending on the solution, can be cumbersome to configure and setup where it works properly. PRTG is a monitoring solution that works great across the board and that I have been using in the home lab and production environments for quite some time. I wanted to detail just how easy it is to use in virtual environments. It makes setting up effective monitoring extremely easy. It can autoconfigure monitors for all of your VMs in your vSphere environment and auto-discover new VMs that are added. You can even monitor via SNMP, the physical hardware status of your ESXi hosts. Let’s look at PRTG VMware host hardware status monitor with SNMP to see how this type of monitoring can be configured.
How PRTG Monitors your VMware vSphere infrastructure
One of the many things that I like about PRTG is that it is easy to add your VMware vSphere environment to be monitored by PRTG. Essentially you add the vCenter Server to PRTG, and it does the rest for you. PRTG integrates with vCenter Server, so it can have visibility to all the VMs that are running inside vSphere.
You don’t have to worry about adding monitoring for all the individual VMs running as PRTG will scan vCenter Server and add these automatically. Newly added VMs will automatically be detected in PRTG and added as well.
PRTG monitors your VMware environment as well as other infrastructure using what it refers to as sensors. Sensors are used for each object that is monitored with the solution.
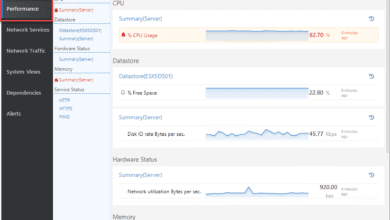
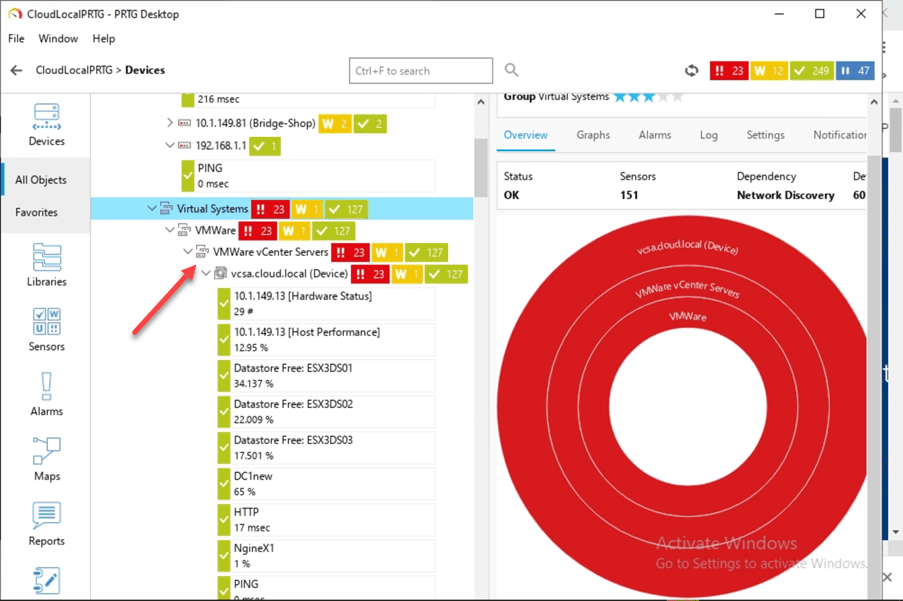
Below, you see the VMware vCenter Server added to PRTG monitoring. Underneath, PRTG will automatically add sensors for the VMs and even the VMware hosts, datastores, host performance, and hardware status.
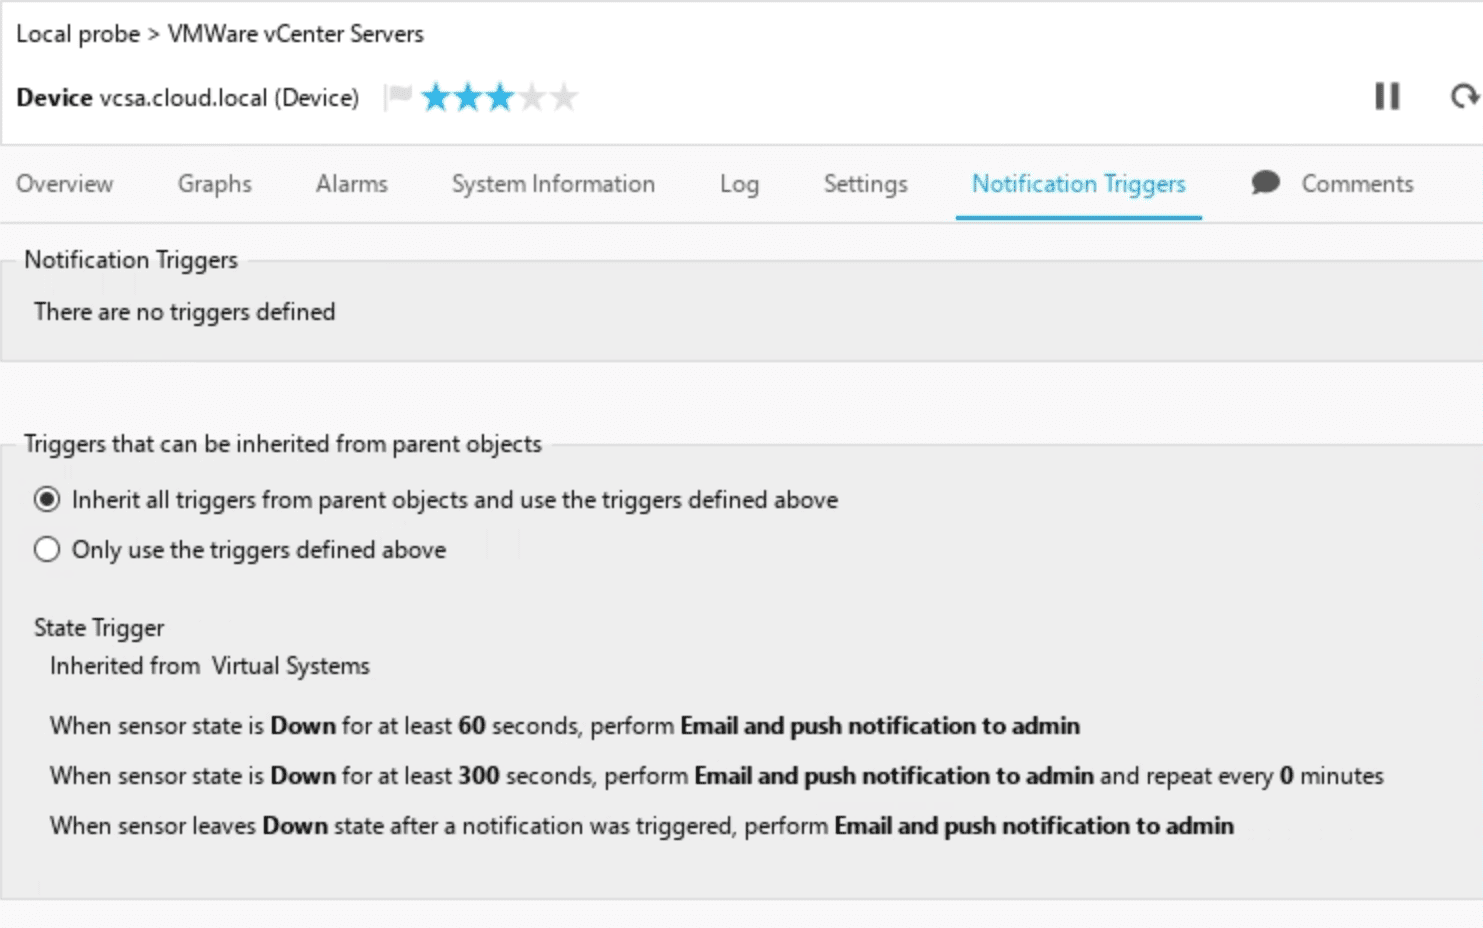
In PRTG, you can alert based on any sensor’s status and choose to set your notification settings and escalate notifications based on the time intervals you choose.
PRTG VMware Host Hardware Status Monitor with SNMP
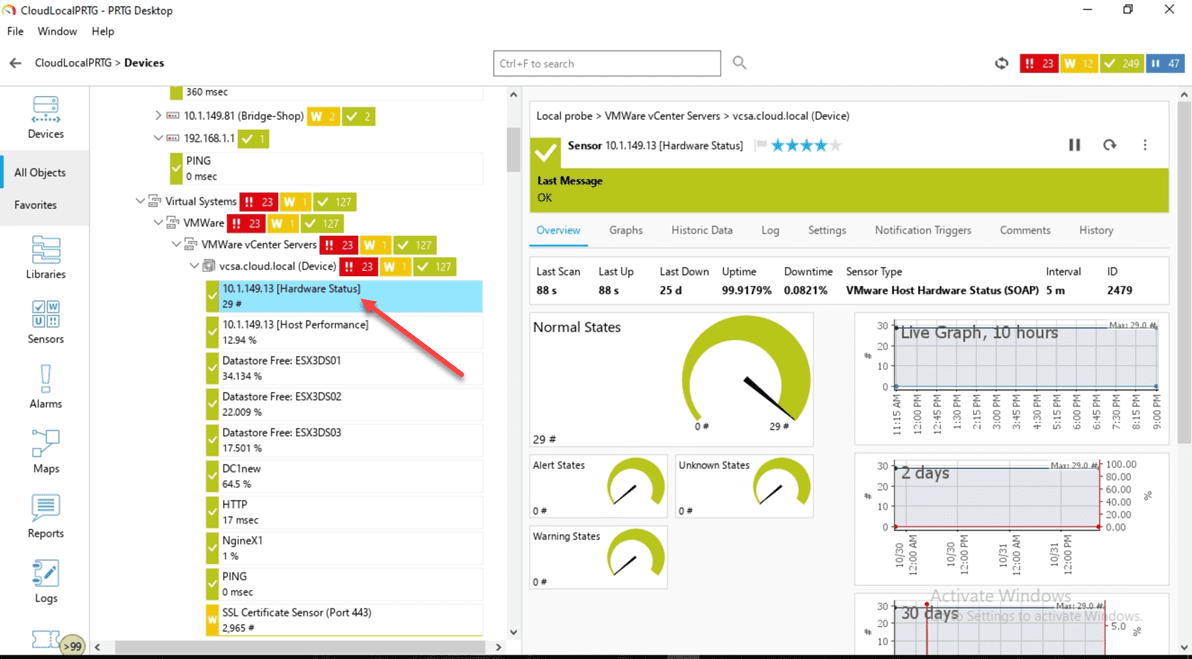
By default, PRTG will add a VMware host hardware status monitor for all the ESXi hosts that are added to vCenter server. This sensor goes by what vCenter Server thinks the status of the host hardware is. Many of the hardware vendors are creating good integration with vCenter Server so that vCenter is able to see and read the hardware status of the ESXi host hardware.
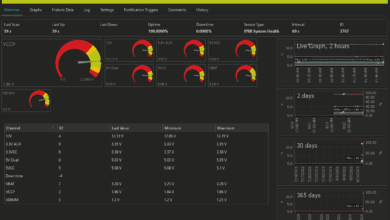
The VMware Host Hardware Status (SOAP) sensor monitors a VMware host server’s hardware status using the Simple Object Access Protocol (SOAP). It gives you a general status overview of your host. Any states other than normal are reported in the sensor message.
The sensor can show the following:
- Total number of items in normal, warning, alert, and unknown status as the vSphere client reports
One of the great things that PRTG can do is monitor host hardware based on SNMP connectivity and sensors. In my lab, I have several Supermicro hosts running. Using the Supermicro SNMP MIBs, you can get detailed monitoring of your host hardware status, including:
- CPU temp
- System temp
- MB 10 G temp
- Fan speed
- RAM temp
PRTG has an array of additional SNMP sensors that can show the VMware host hardware status even further. The only requirement here is that you know the SNMP OID of the particular hardware you want to check the status.
If you have server hardware that allows monitoring via IPMI or some other out-of-band interface via SNMP, you can easily query the state of your hardware sensors. As an example, if you are running Supermicro servers in your lab, you can easily monitor the hardware status of your Supermicro servers with the SNMP sensor in PRTG.
Below are the particular OIDs for each of the hardware statuses that most will want to monitor for Supermicro (works on Supermicro SYS-5028D-TN4T and the SYS-E301-9D-8CN8TP):
CPU – Sensor: 1/sensor reading – 1.3.6.1.4.1.21317.1.3.1.2.1
SYSTEM TEMP – Sensor: 11/sensor reading – 1.3.6.1.4.1.21317.1.3.1.2.11
PERIPHERAL TEMP – Sensor: 12/sensor reading -1.3.6.1.4.1.21317.1.3.1.2.12
MB10G TEMP – Sensor: 13/sensor reading – 1.3.6.1.4.1.21317.1.3.1.2.13
RAM DIMMA1 TEMP – Sensor: 176/sensor reading – 1.3.6.1.4.1.21317.1.3.1.2.176
RAM DIMMA2 TEMP – Sensor:177/sensor reading – 1.3.6.1.4.1.21317.1.3.1.2.177
RAM DIMMB1 TEMP – Sensor: 180/sensor reading – 1.3.6.1.4.1.21317.1.3.1.2.180
RAM DIMMA2 TEMP – Sensor: 181/sensor reading – 1.3.6.1.4.1.21317.1.3.1.2.181
One oddity that I ran into was the Custom SNMP Sensor worked for two of my hosts, but not the other two. They seemed to be pulling the information. However, they didn’t display the information in the sensor correctly. The odd thing is the IPMI version and BIOS on all hosts were identical. So, not sure what to make of that other than there was a difference in how the information was pulled between the differing hosts.
For the other two, I was able to find a workaround by using a Custom SNMP String Sensor.
Adding a Custom SNMP String Sensor
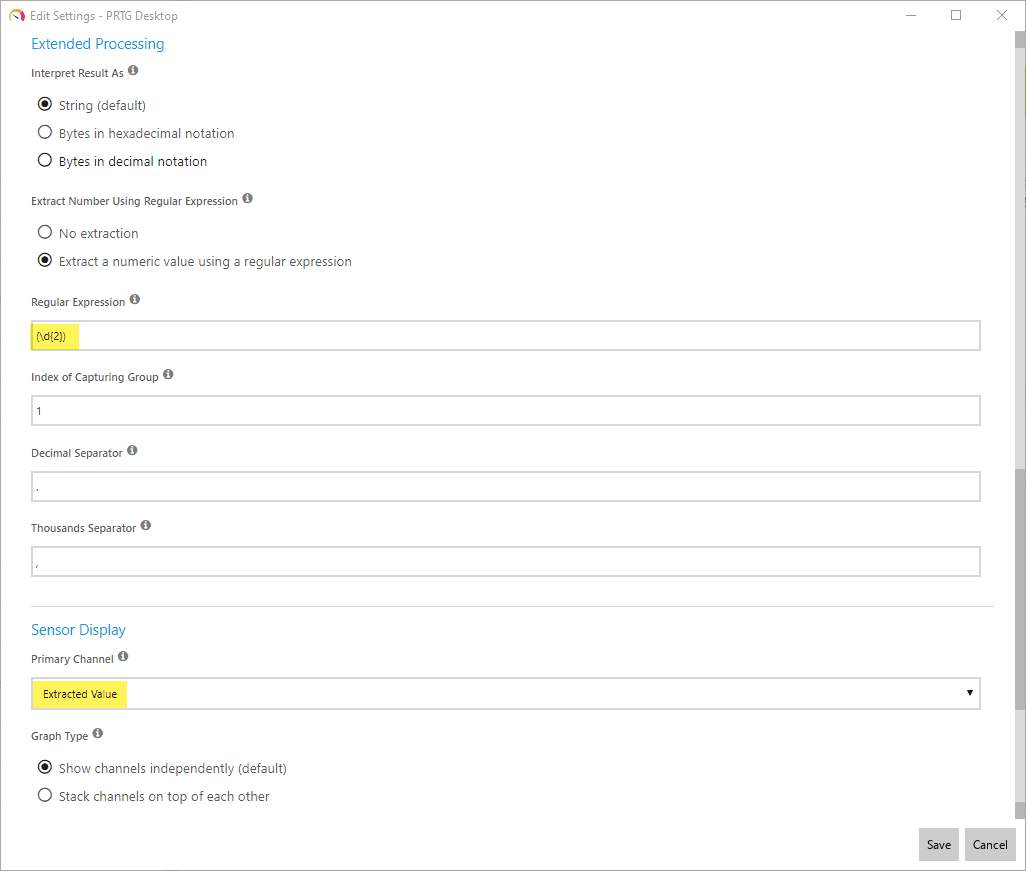
In PRTG I was able to get the SNMP status sensors to display correctly by using the Custom SNMP String sensor. Note below, I have plugged in the OID for the CPU Temp.
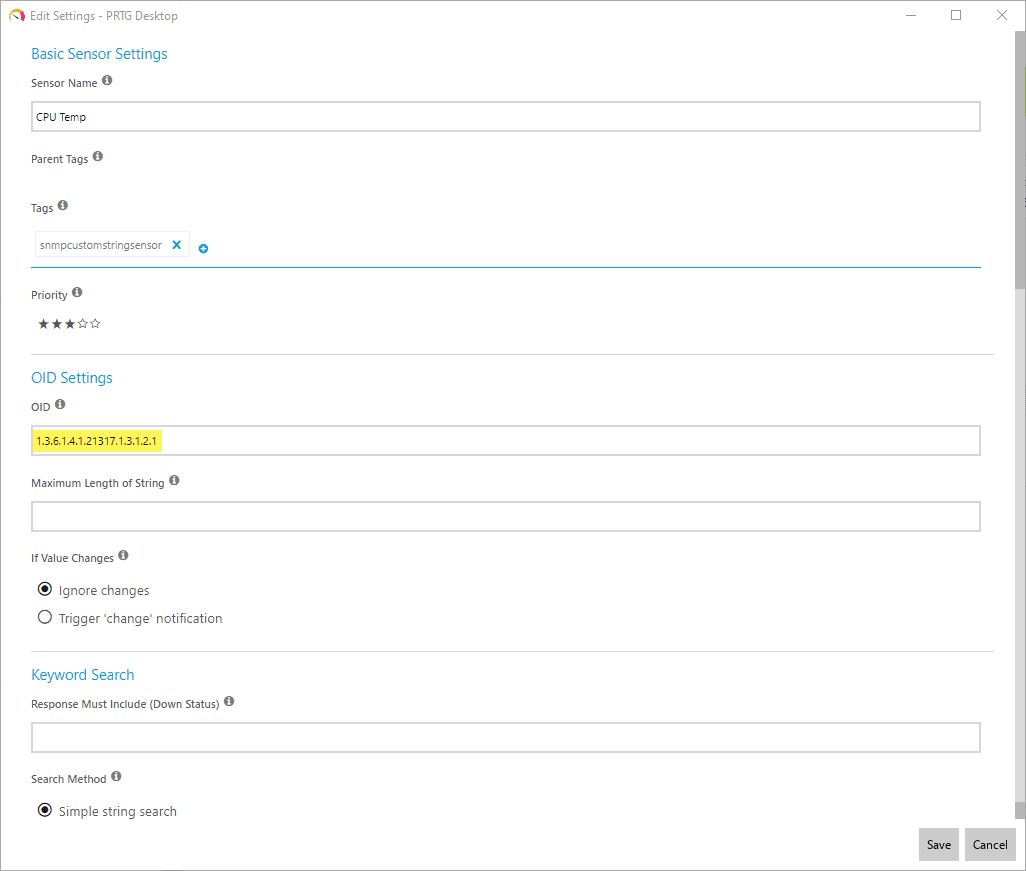
This was the part that took a bit of tinkering. Under the Extract Number using Regular Expression, I used the value (d{2}), which correctly peeled off the extra zeros that were causing issues on the other two hosts.
Creating a PRTG Device Template for Easier SNMP Monitoring
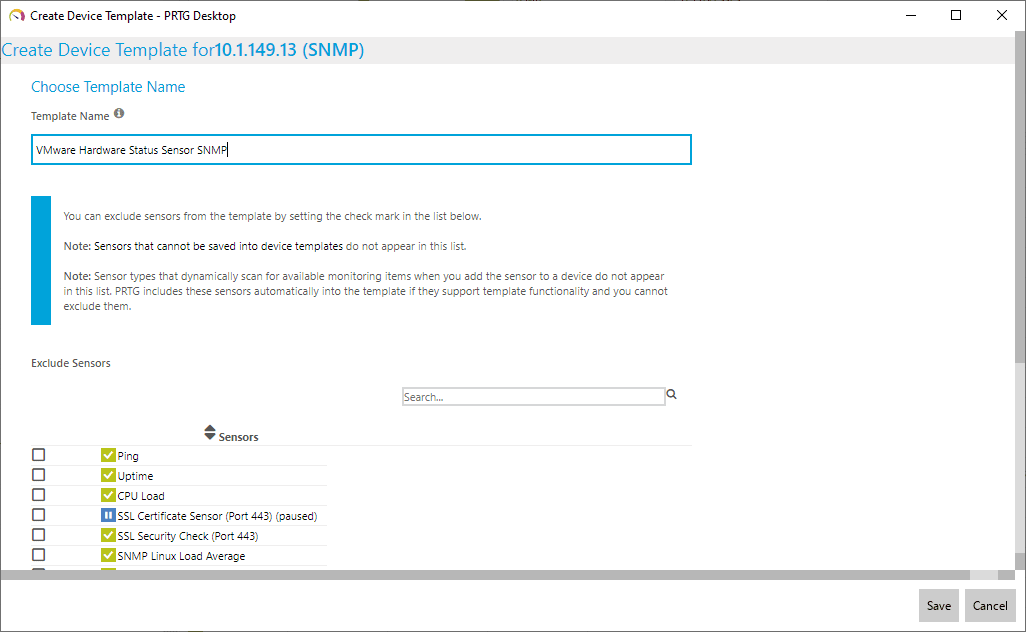
One great little tool you can use when setting up a single VMware ESXi host for hardware status monitoring using custom SNMP information is creating a device template. This captures all the sensors and the sensor settings from a particular device (ESXi host) and allow you to add ESXi host to monitoring by using the device template.
This saves a ton of work, especially if you have added custom SNMP sensors with custom OIDs and have specific sensors setup and customized as you like them. So, I did the manual adding of sensors for a particular host, created a device template, and then added the other ESXi hosts using the device template. This makes for quick work of adding the custom settings for each of the sensors for my Supermicro servers.
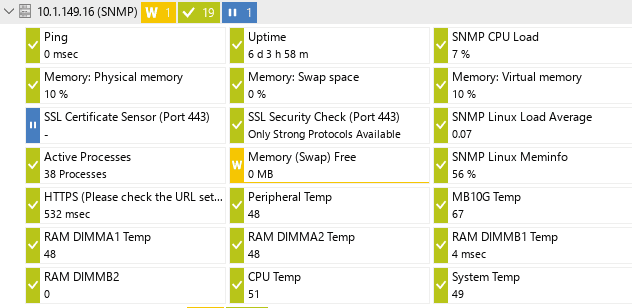
By using the custom SNMP string sensor as well as the OIDs for your particular server vendor, you can get great hardware monitoring such as the following:
Wrapping Up
Hopefully, this quick overview of PRTG VMware Host Hardware Status Monitor with SNMP configuration will help show the possibilities of using PRTG to monitor the VMware ESXi host hardware health for your hosts. It is a great way to keep a health check on temperature and other variables for VMware hosts.