There is no shortage of monitoring solutions on the market that allow businesses to manage their business-critical resources, including virtualized environments. Monitoring is a key task supporting business-critical operations in the enterprise. Arguably, monitoring is even more important with virtualized environments due to the highly consolidated nature of the infrastructure. With the shared components and resources, it is important to keep an eye on key performance metrics (KPIs) in the environment. This post will take a look at virtualization monitoring with NetCrunch 11, a powerful monitoring solution for virtualized environments that provides many capabilities and features. We will look specifically at the new features of NetCrunch version 11 in this review of new features.
What is NetCrunch?
AdRem Software NetCrunch is a self-described highly scalable and flexible network monitoring system. It can monitor physical devices, network metrics, virtualized environments, and many other types of objects. NetCrunch provides a robust solution that delivers on the following key concepts:
- High performance
- Automatic monitoring using policy management
- Built for consistency
- Flexibility and customization
NetCrunch has a unique approach to how it monitors your environments. It uses what it calls “Monitoring Packs” which provide a predefined set of performance metrics, triggers, and events that it monitors. NetCrunch automatically assigns the appropriate monitoring packs to devices it discovers in the network scans, however, the monitoring packs can be assigned both automatically and manually.
One of the great things I like about NetCrunch is it is priced based on nodes instead of individual probes per node. As we all know, a business-critical resource may have many components that need to be continuously checked. In other solutions, each would require different monitoring probes. With NetCrunch this is all-inclusive in the “node-based” licensing. Even if you are checking 100 different things for a particular node, this only counts as one node.
Installation requirements
The following requirements are listed as recommended from AdRem Software for the NetCrunch server installation:
- NetCrunch must be installed on a 64 bit Windows Server (Windows 2012, Windows 2012R2, Windows 2016, 2019). It comes with its own Web Server and an embedded SQL database for storing monitoring event data.
- NetCrunch can be installed on a virtual machine, provided you assign at least 4 cores and 4 GB RAM.
- More processors are better for monitoring 1000+ nodes; the recommended number in such cases is at least 8.
Monitoring a large number of performance metrics (100,000 network interfaces) requires additional RAM (500,000 performance metrics will require an additional 4GB). - The other important component is the hard drive. We strongly recommend using SSD drives.
NetCrunch 11 New Features
The last couple of releases with version 11 have been minor bugfix releases. However, the NetCrunch 11.02 release contained major new features and functionality, including the following. I have bolded the ones that relate specifically to virtualization. However, there are many great new additions to the NetCrunch version 11 family of the product.
Virtualization Monitoring with NetCrunch 11
NetCrunch provides a great solution for virtualization monitoring including both VMware vSphere and Microsoft Hyper-V environments. In the lab environment, I have NetCrunch monitoring my VMware vSphere 7 environment.
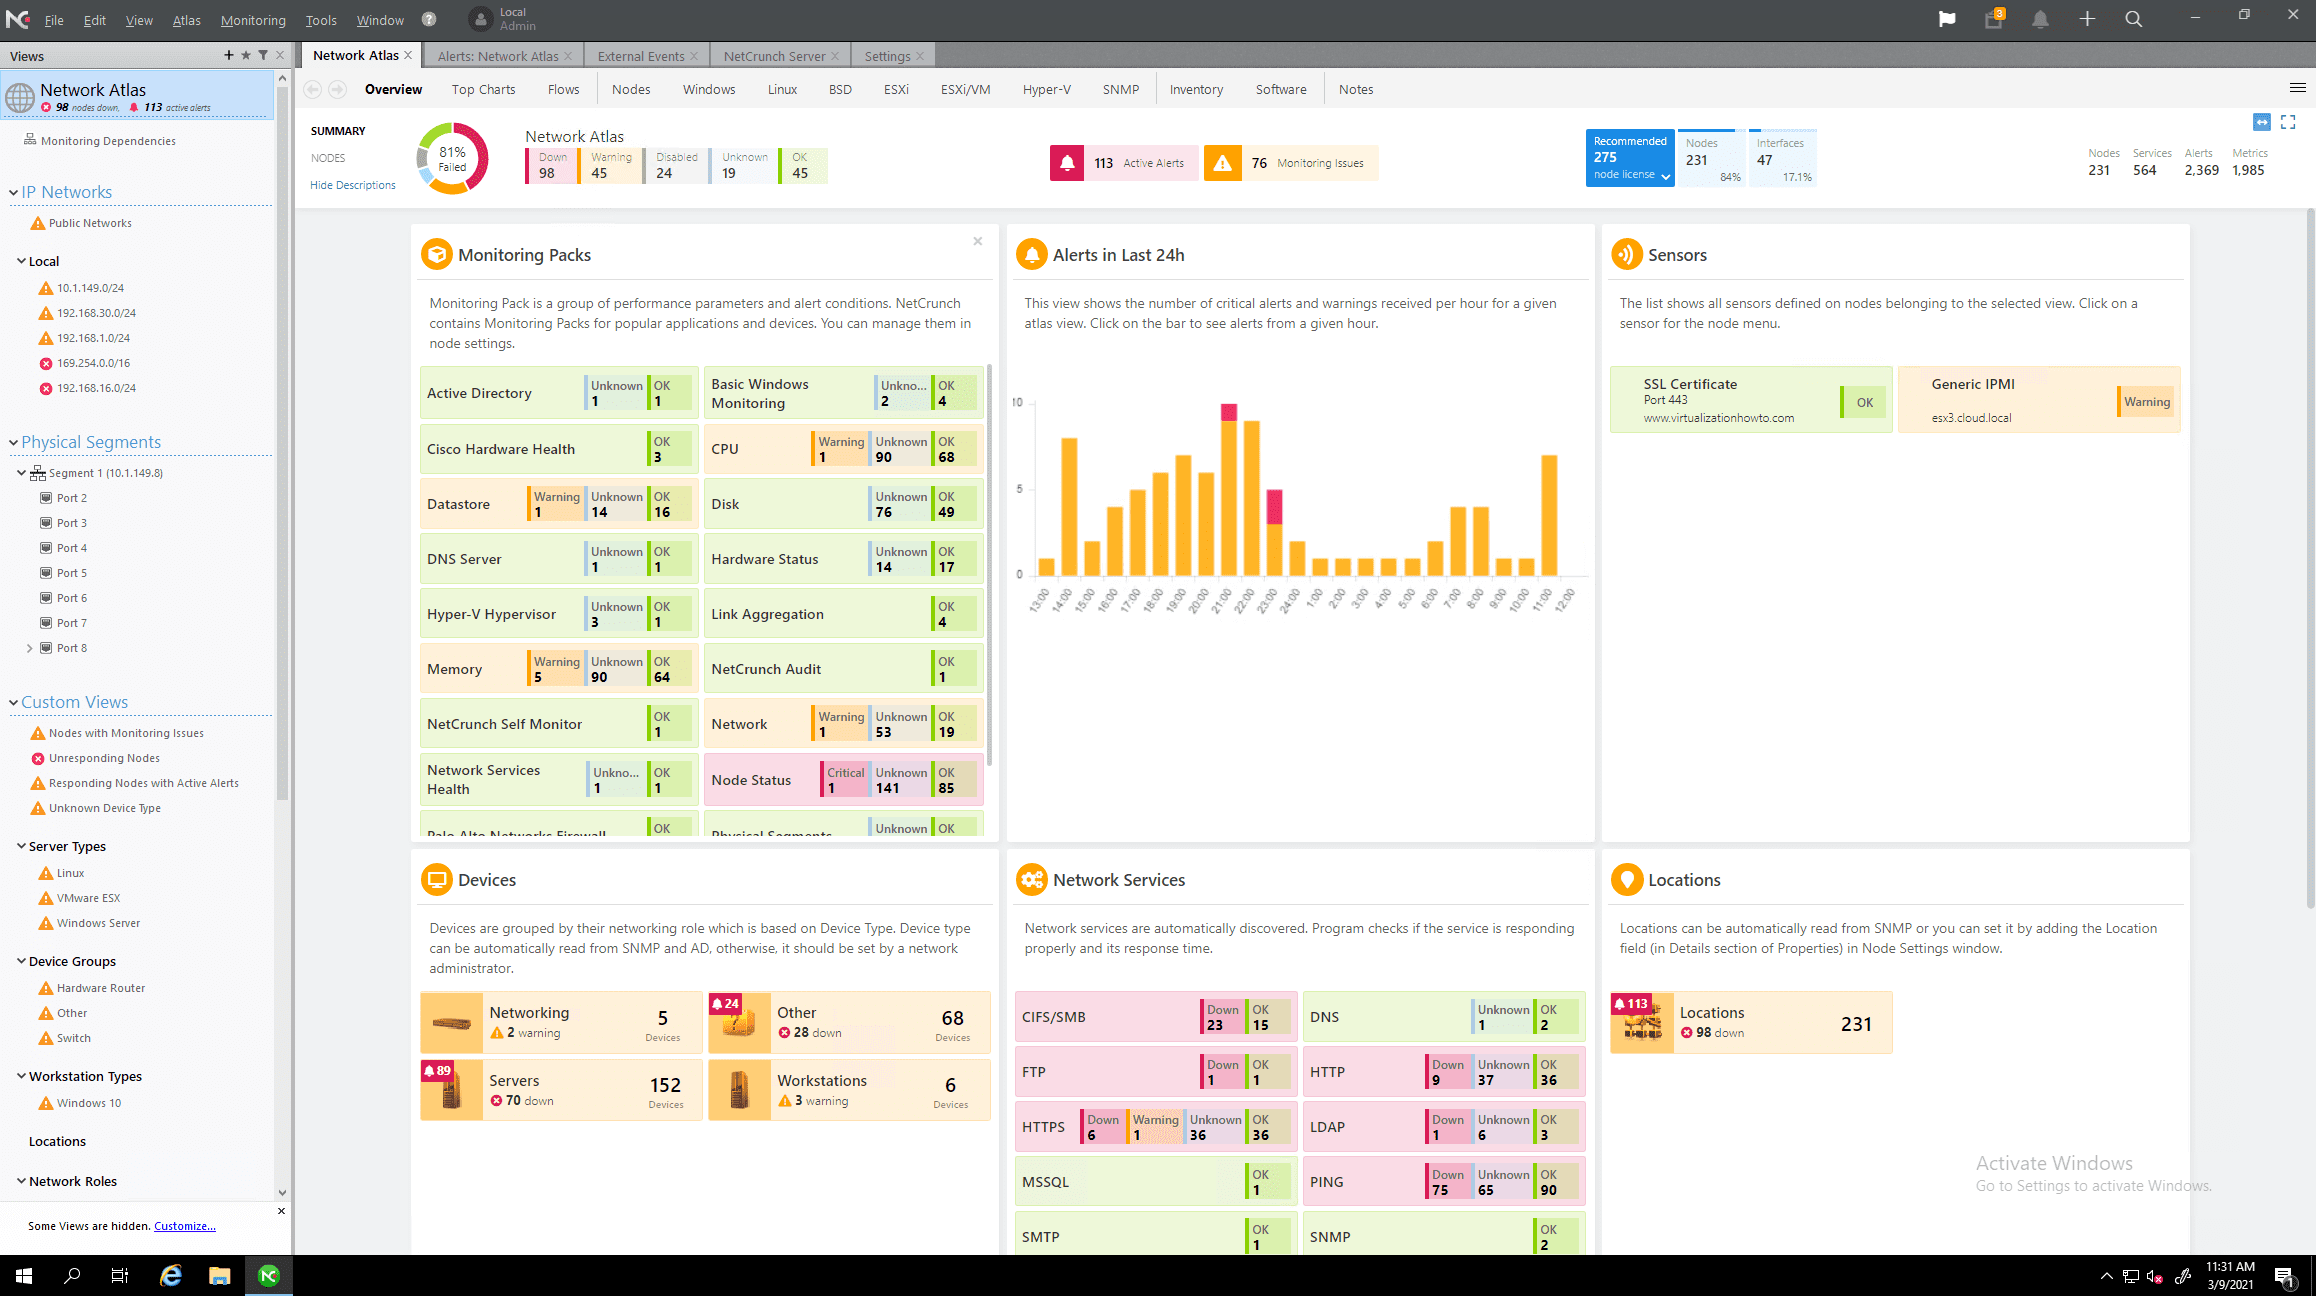
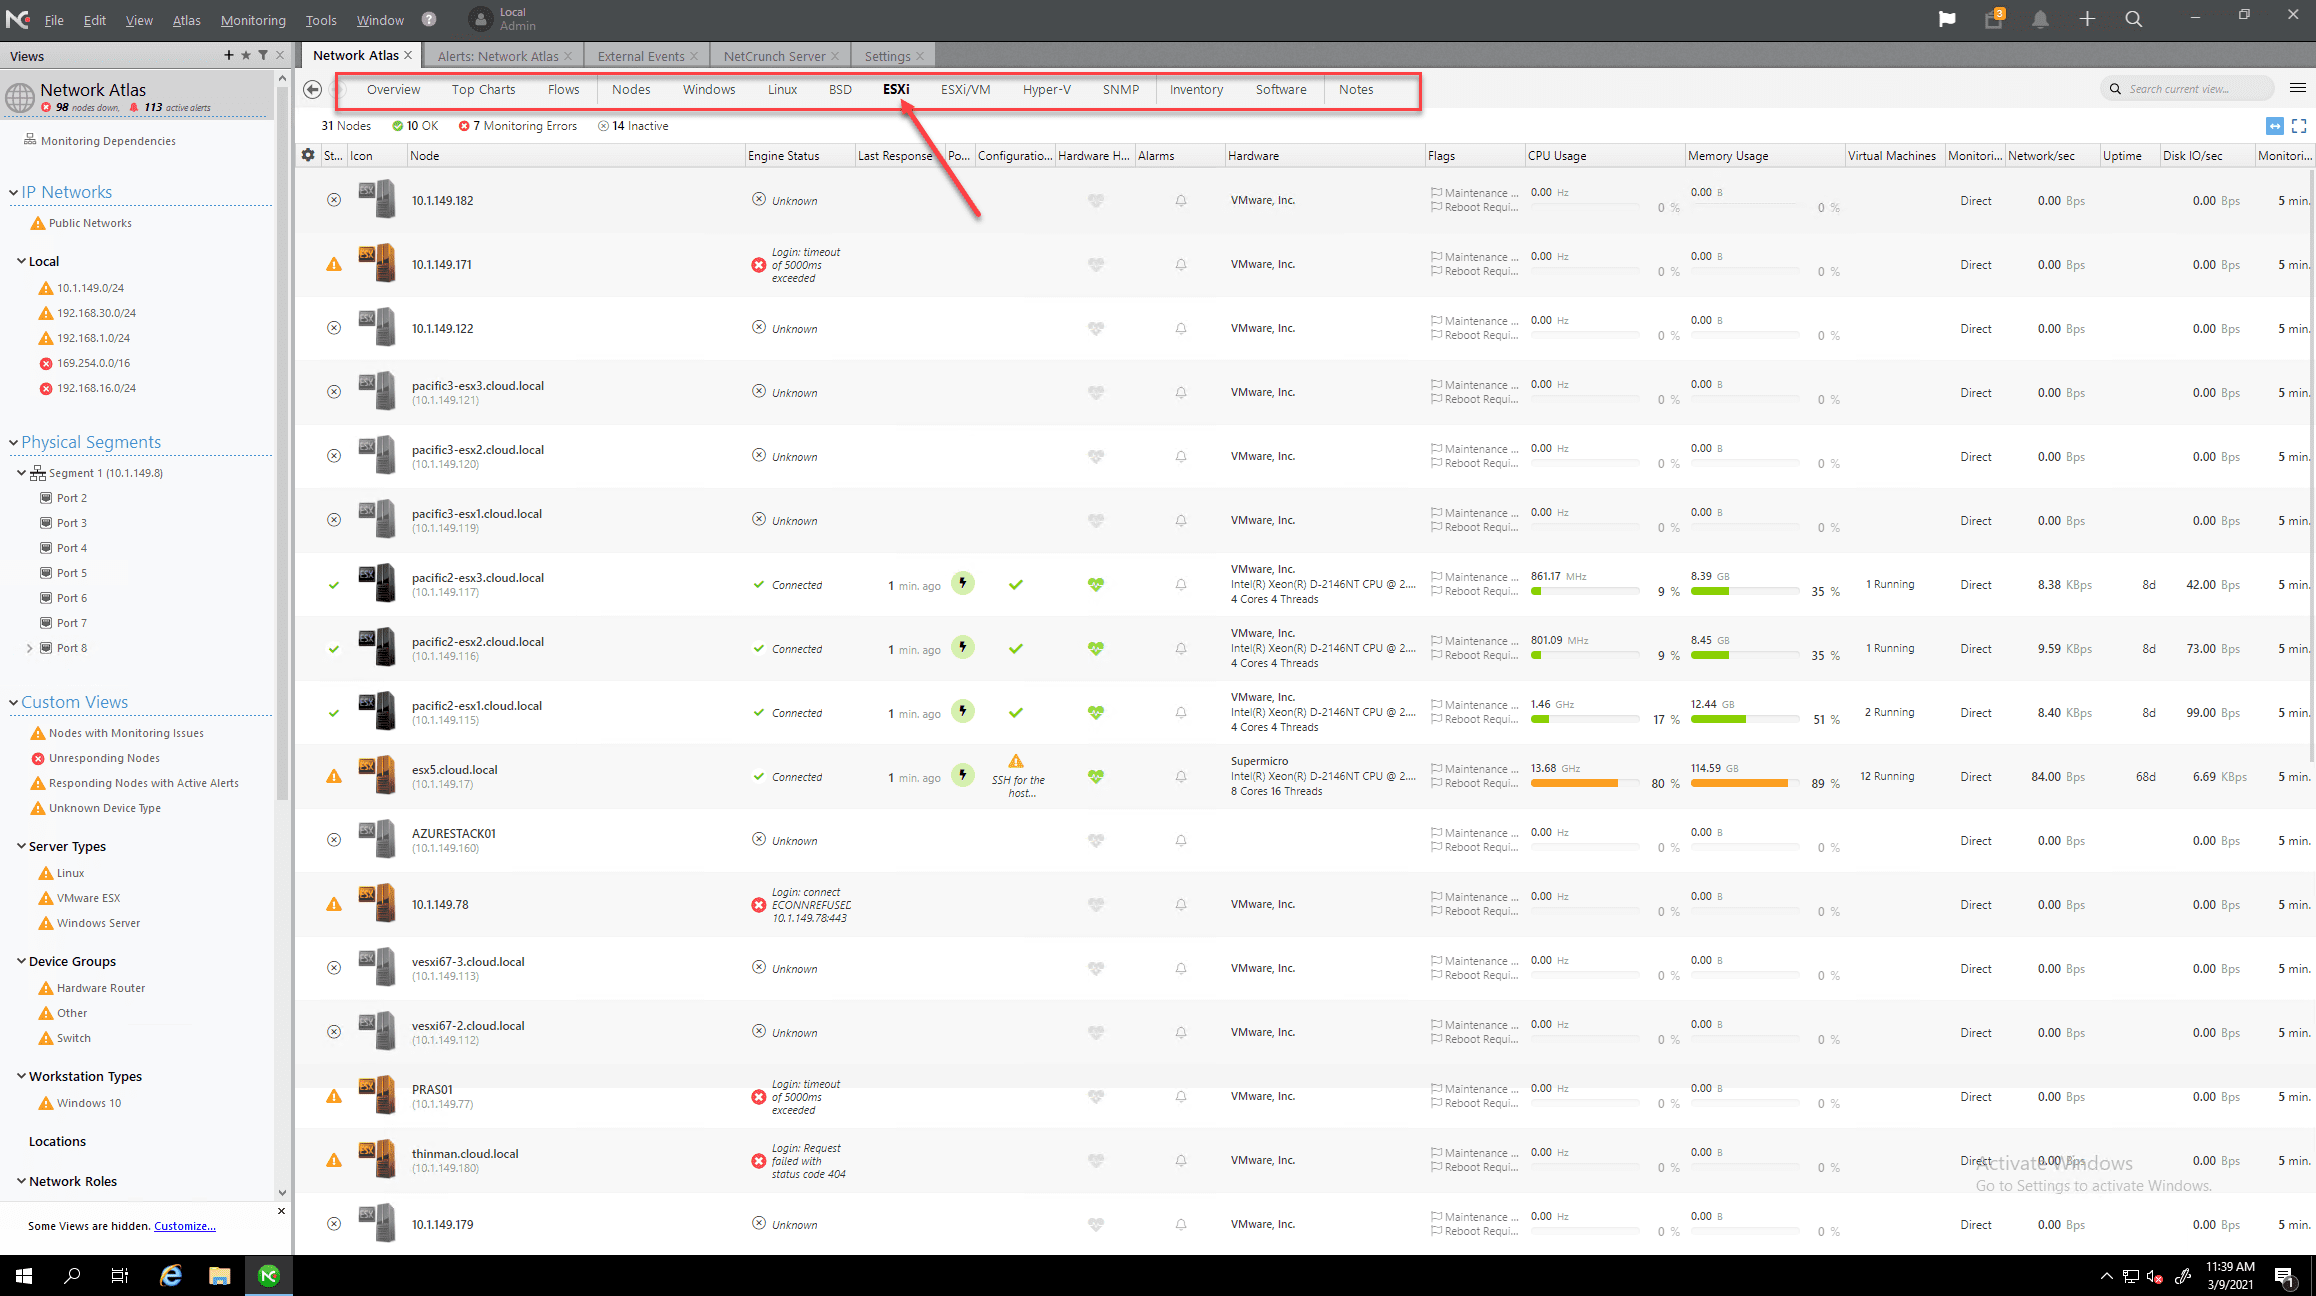
The NetCrunch solution provides you with a monitoring atlas that gives you a global overview of your environment in a single pane of glass. I like the use of color and categorization in NetCrunch Network Atlas. In a single dashboard, you have a view of the monitoring packs, devices, alerts, and other metrics.
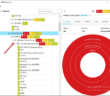
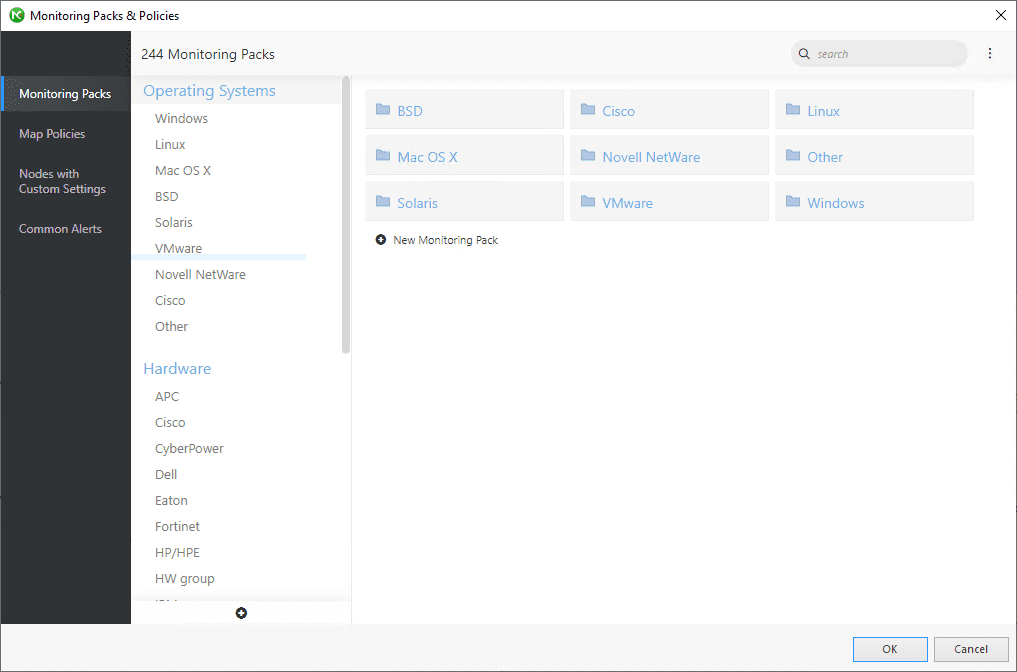
Under the Monitoring > Monitoring Packs & Policies menu, you can see the list of monitoring packs available. Again, NetCrunch provides a large number of monitoring packs by default. With every few minor releases, NetCrunch continues to add to the available monitoring packs that are available.
Putting more laser focus on virtualization monitoring, NetCrunch has a large variety of classification tabs in the Network Atlas that allows easily monitoring your specific virtualization environments. As you can see, you have an ESXi tab. Clicking here will display the ESXi hosts in the environment. Again these are automatically discovered and have the ESXi monitoring packs applied.
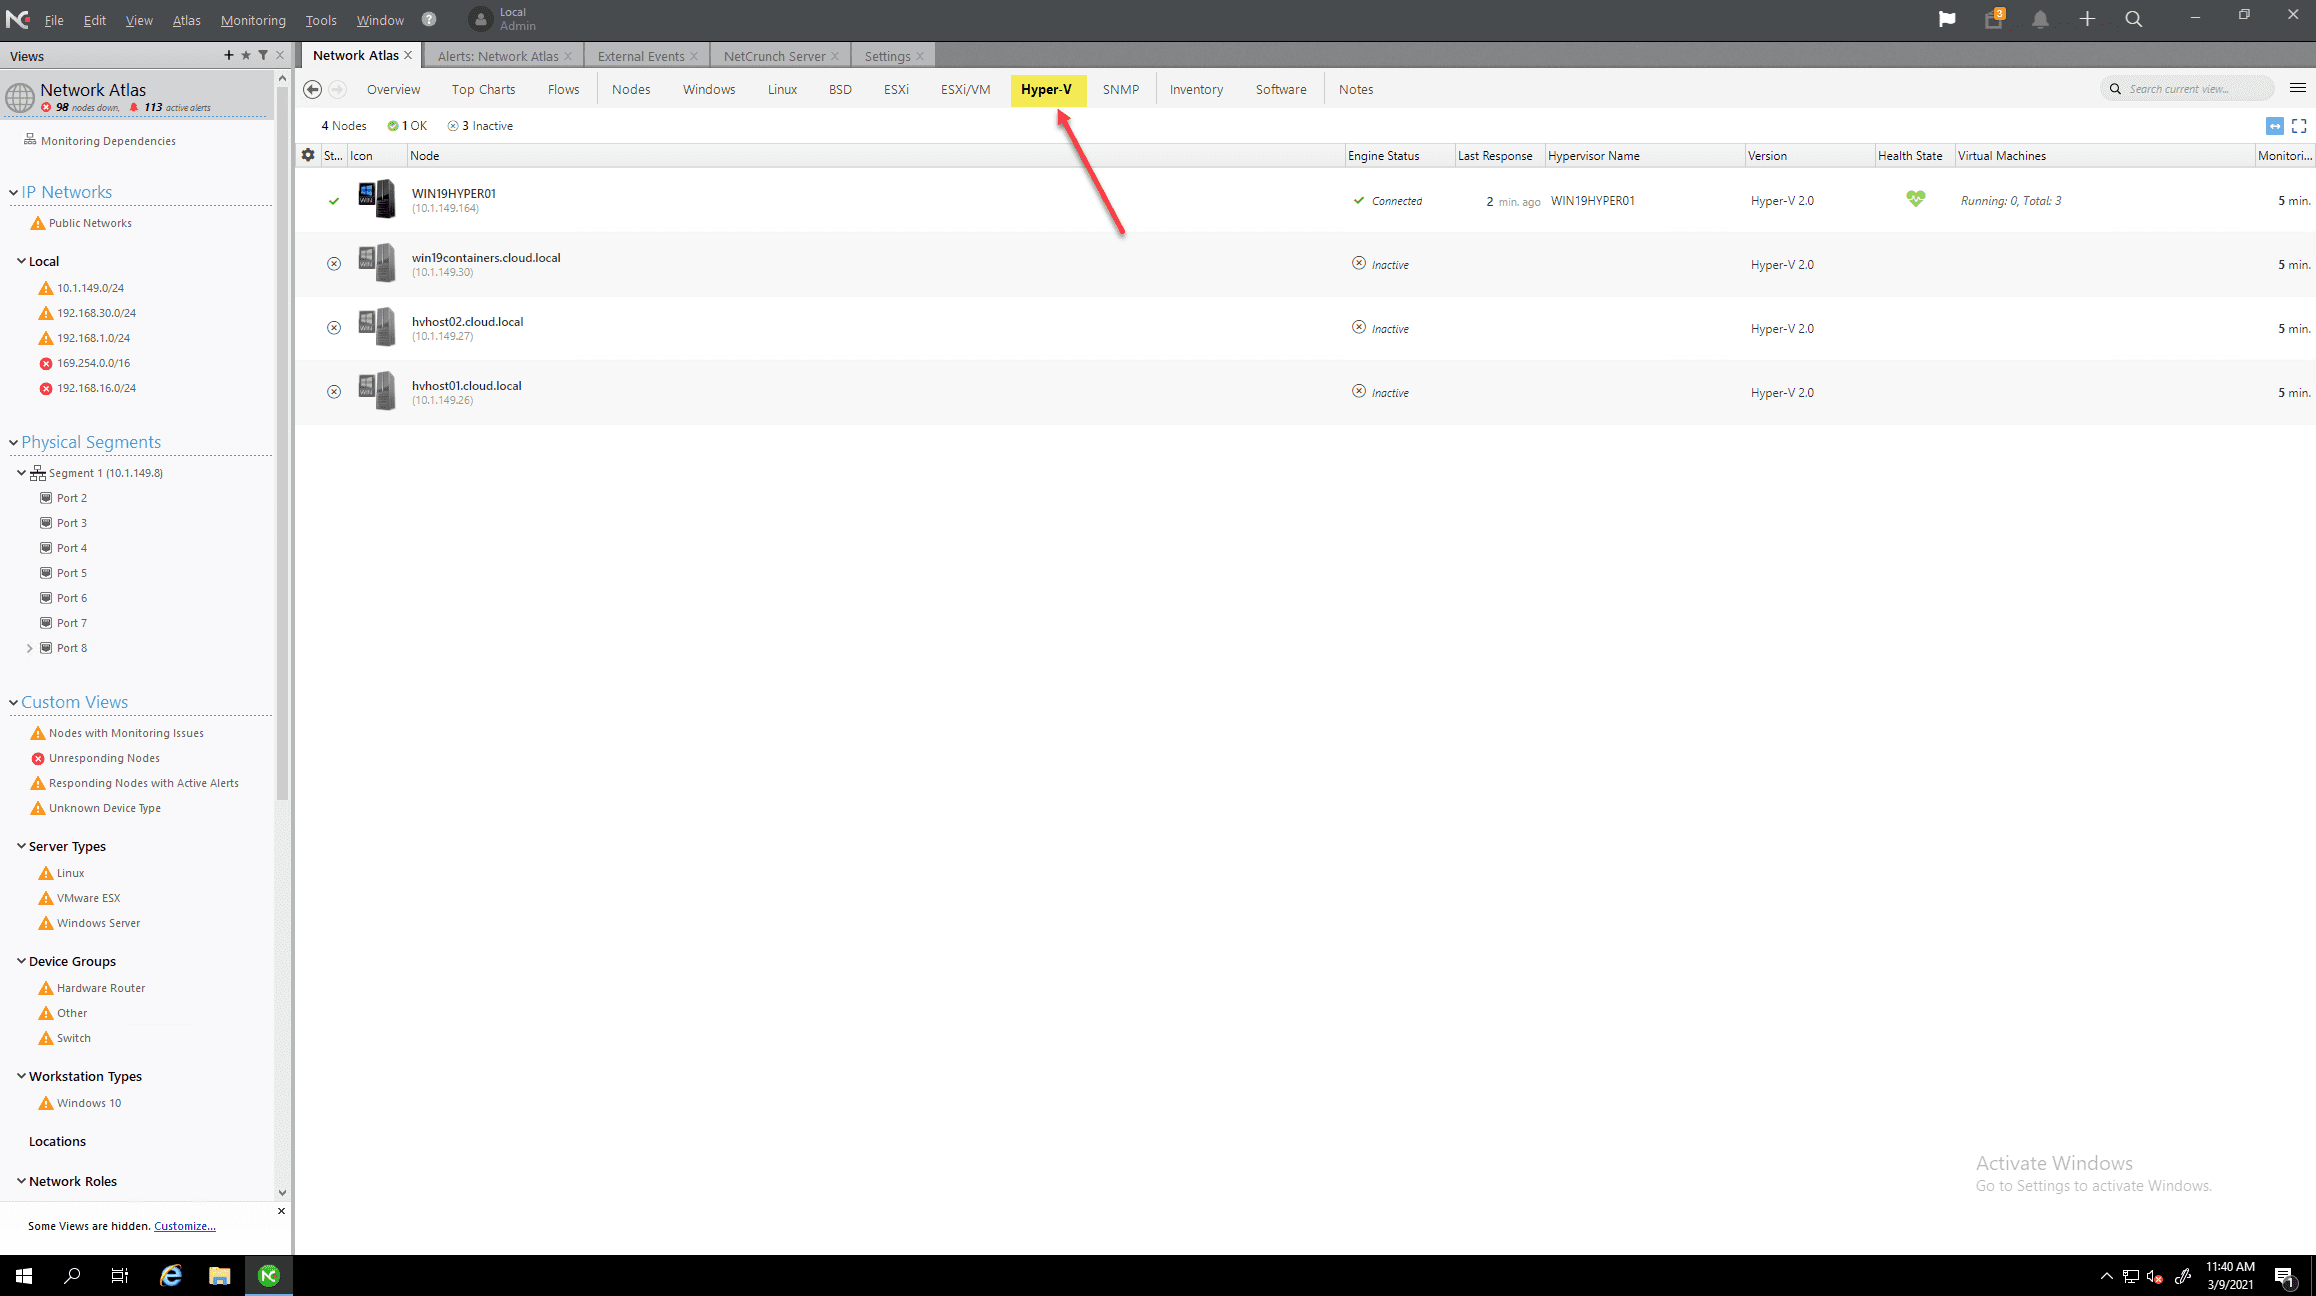
There is also a tab for Hyper-V in the environment. NetCrunch has a monitoring pack for Hyper-V.
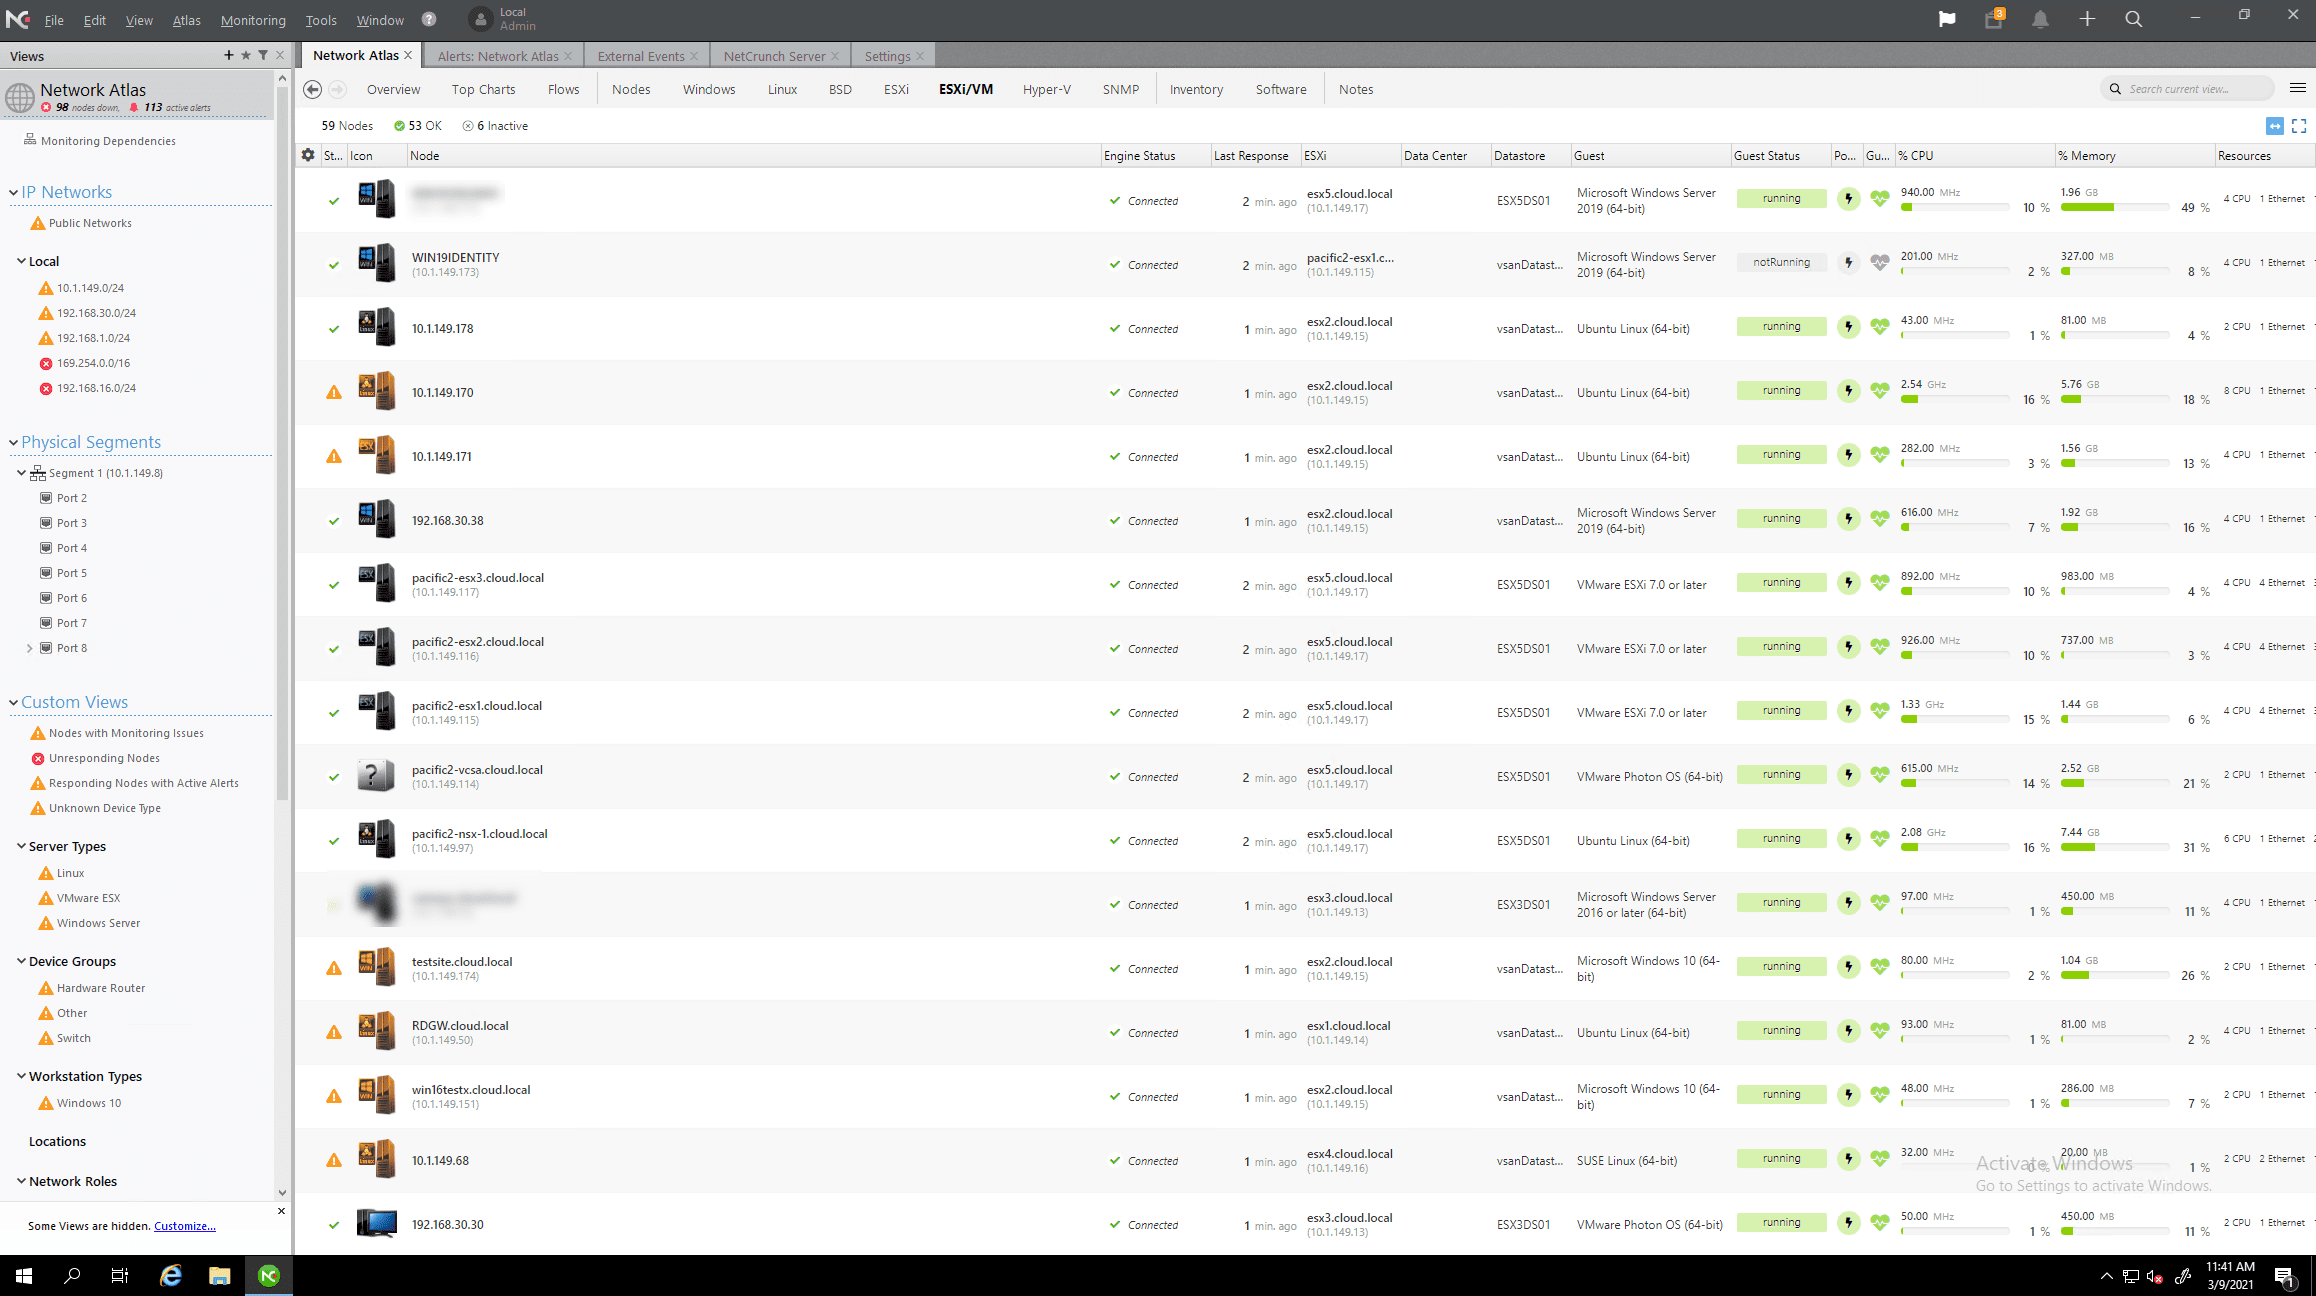
Below is the ESXi/VM tab displaying the virtual machines running on the ESXi hosts.
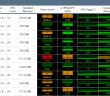
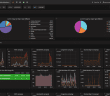
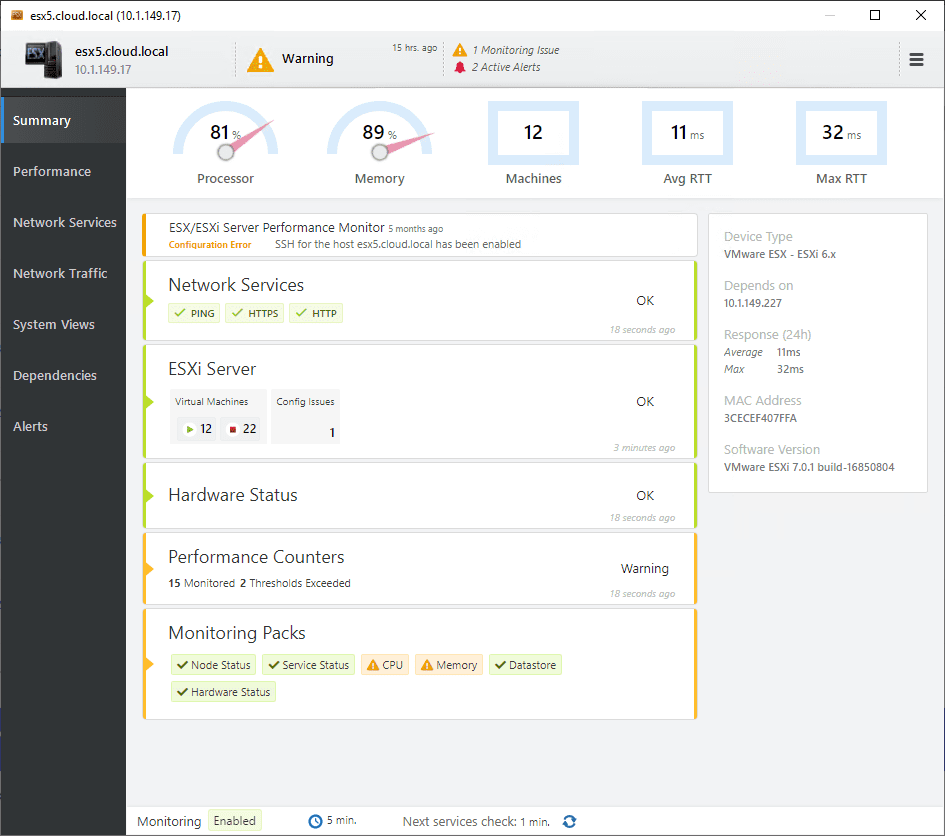
If you take a look at the status of an ESXi host, you get a great deal of detailed information regarding the host’s health. This includes the processor and memory utilization, virtual machines, RTT time, and max RTT. You can see if you have any monitoring alerts or other issues with the host as well.
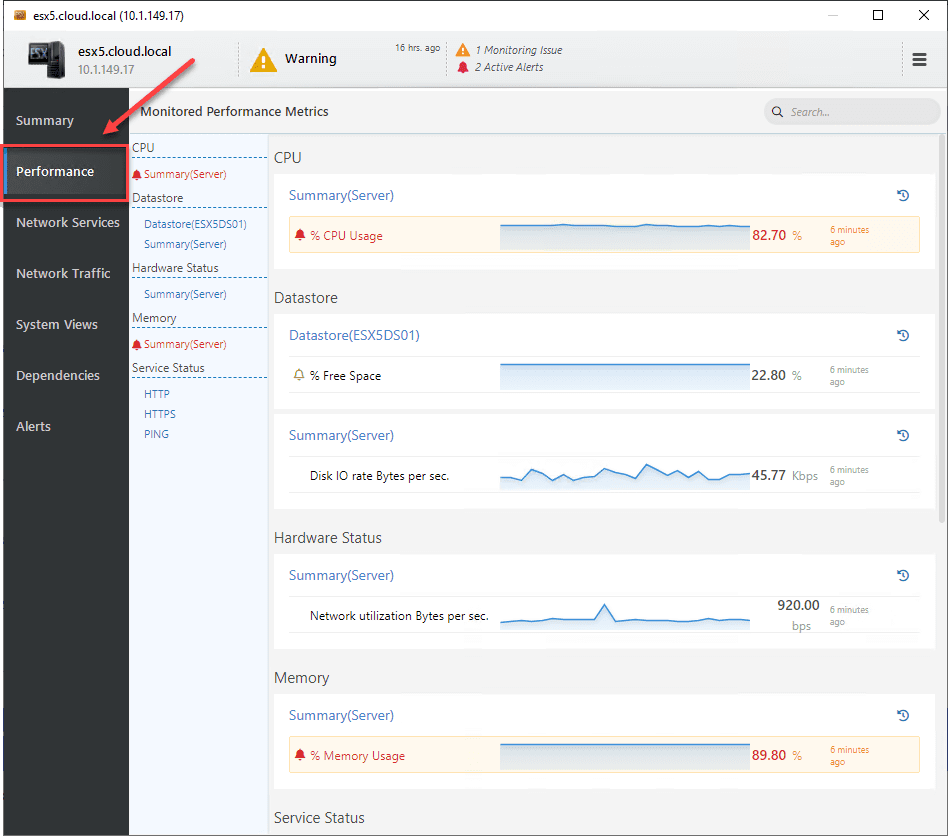
Focusing in on performance even further, if you click on the performance tab, you will see the more detailed metrics and information displayed.
NetCrunch helps eliminate alerting “noise”
NetCrunch provides what they call Conditional Alerts and Alert Correlation. With the conditional alerts, you can alert based on:
- the event condition
- the event happens over a period of time
- the event happened more than x number of times in y minutes
- the event happened only between the time of or not between a certain time
- the event did not happen in the time between
- the event did not happen after a given time
- event pending for more than a specified period of time
Event Correlation in NetCrunch means triggered alerts are automatically correlated. When the condition causing the alert is no longer present, a closing event is triggered and the alert is closed. This helps to auto-manage pending alerts that may no longer be in alert status. NetCrunch also has the ability to do advanced correlation to define alerts triggered when alerts from multiple sources coincide together.
Netcrunch VMware Monitoring Availability
Netcrunch includes a great feature as part of its capabilities for VMware monitoring, in terms of availability. In most environments today, organizations generally hook their monitoring solution into vCenter Server as this gives visibility to connected hosts, VMs, etc from a single management plane.
However, what happens if vCenter goes down or is taken down for maintenance? Please note that NetCrunch can monitor vms via ESXi or vCenter. If vCenter becomes inaccessible for some reason (such as maintenance), NetCrunch can automatically switch to direct ESXi monitoring, which provides basic information about ESXi hosts and their virtual machines. Monitoring through vCenter provides additional information about ESXi power state, ESXi configuration issues, ESXi alarms.
Also note NetCrunch fault tolerance cluster with VMware: https://www.adremsoft.com/blog/view/blog/10839411992867/highavailability-netcrunch-on-microsoft-failover-clustering
Wrapping Up
Making use of virtualization monitoring with NetCrunch 11 provides a powerful monitoring solution that organizations can take advantage of with their virtualized environments, including VMware vSphere and Microsoft Hyper-V. NetCrunch offers a lot of great functionality including Monitoring packs, conditional alerts, and alert correlation built-in.
NetCrunch licensing is also easy to calculate as they only charge you per node, no matter how many metrics for that node you are monitoring. Be sure to check out more about NetCrunch 11 here.
Google is updating how articles are shown. Don’t miss our leading home lab and tech content, written by humans, by setting Virtualization Howto as a preferred source.
About The Author