Quickly and easily finding issues within an environment, especially virtualized environments can be a challenge. Having the right utilities and tools can be extremely helpful in finding potential hotspots and having visibility to important KPIs within the environment. Today I would like to introduce you to ControUp IT Insights monitoring solution and some of the capabilities of this slick little monitoring solution that alows you to gain quick visibility into the performance of virtualized as well as physical servers as well as Horizon VDI performance monitoring. Let’s take a look at ControlUp VMware Performance and Health Monitoring and see what information we can glean by using the solution.
Installing ControlUp VMware Performance Monitoring
ControlUp is an application that consists of a few components that can be used in various use cases:
- ControlUp Console – The main and only required component
- ControlUp Monitor – Allows installing a noninteractive service on a server to gather data continuously
- ControlUp Agents – Installs a lightweight agent to monitor physical computers in the organization
- ControlUp Insights – In the ControlUp cloud – allows gathering and analyzing data collected from the ControlUp Monitor.
Looking at the ControlUp Console installation it can be installed on the following platforms:
- Windows 7
- Windows 8 and 8.1
- Windows 10
- Windows Server 2008, Windows Server 2008 R2
- Windows Server 2012, Windows Server 2012 R2
- Windows Server 2016.
Additional requirements:
- The Console requires no database.
- All the data you see in it is stored in RAM, which allows for blazingly fast manipulation of data. As a result, ControlUp Console memory usage can be intensive, depending on the number of managed machines.
- A RAM footprint of about 1GB (Working Set) is normal when managing an enterprise with up to 500 live user sessions, while thousands of sessions can bring the console’s RAM usage up to several gigabytes.
Getting up and running with ControlUp is an easy process. Simply download the installation file from ControlUp here: ControlUp Download
Once downloaded, unzip the installation and begin the setup.
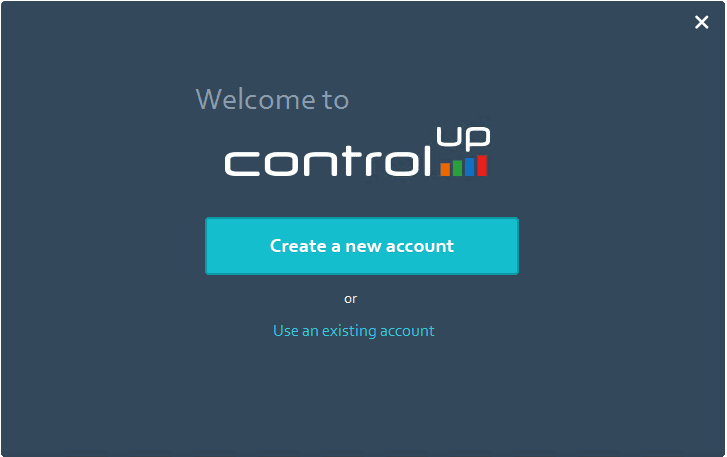
You will need to create a new ControlUp account or use an existing account if you have already provisioned one.
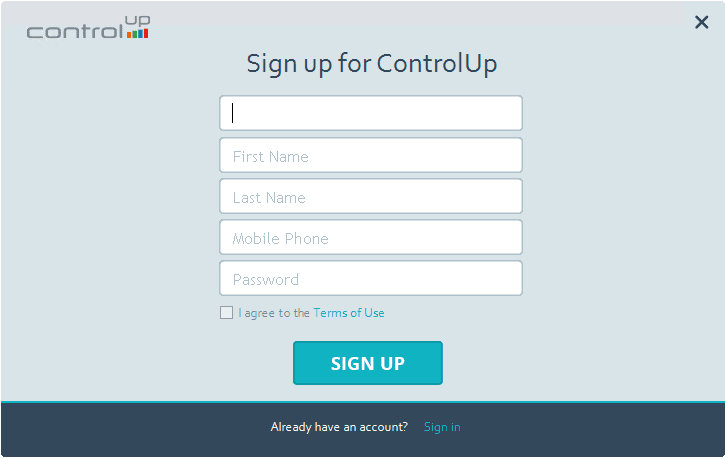
Below, I am signing up for the new account. Pretty straightforward form that will shoot out an email to the email address populated in the form. The email that is generated will contain another URL that will have a string that you click to activate the software.
After activating the software, choose a ControlUp Organization name for the installation.
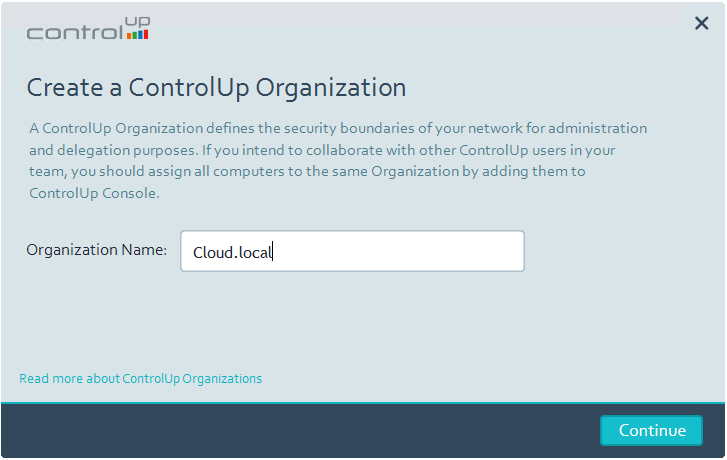
After creating the organization name, the software will finish configuring the installation.

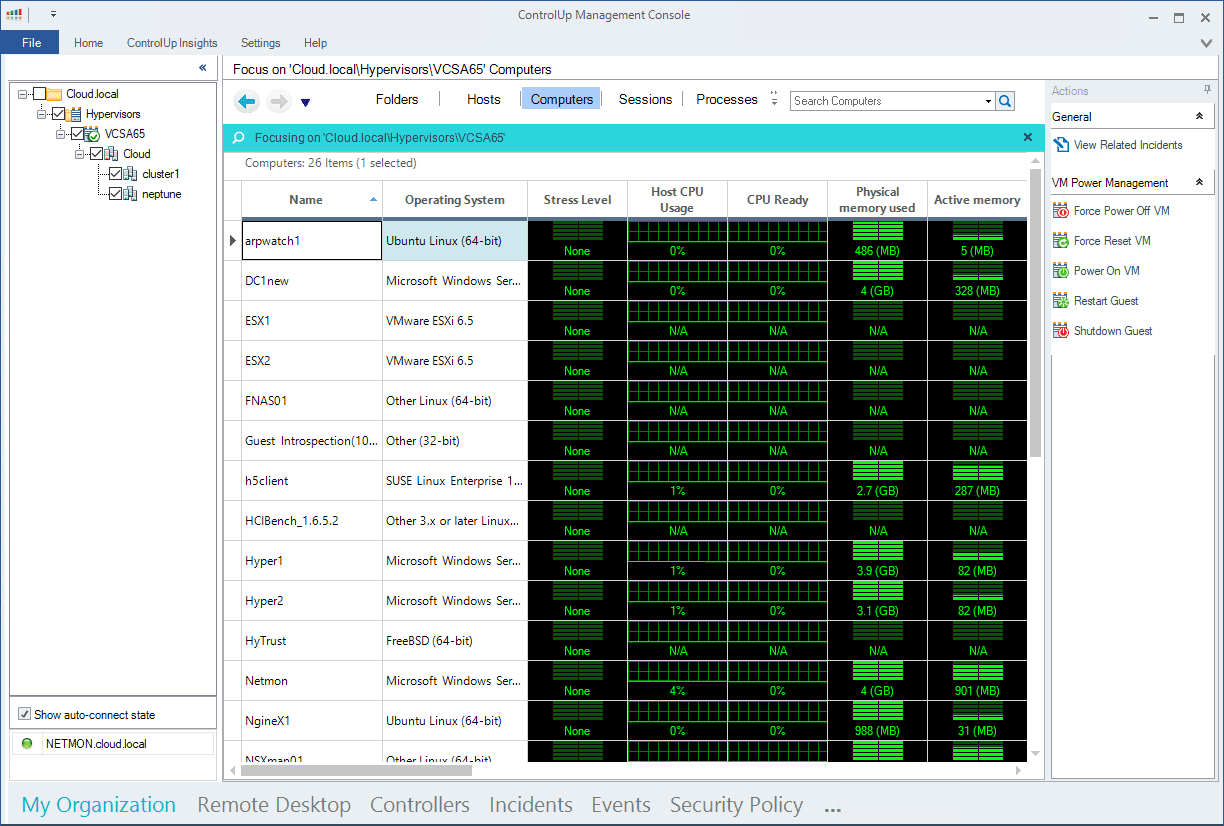
After installation, the ControlUp dashboard will launch with the directive to add computers to ControlUp. You can add Hypervisors and Computers.
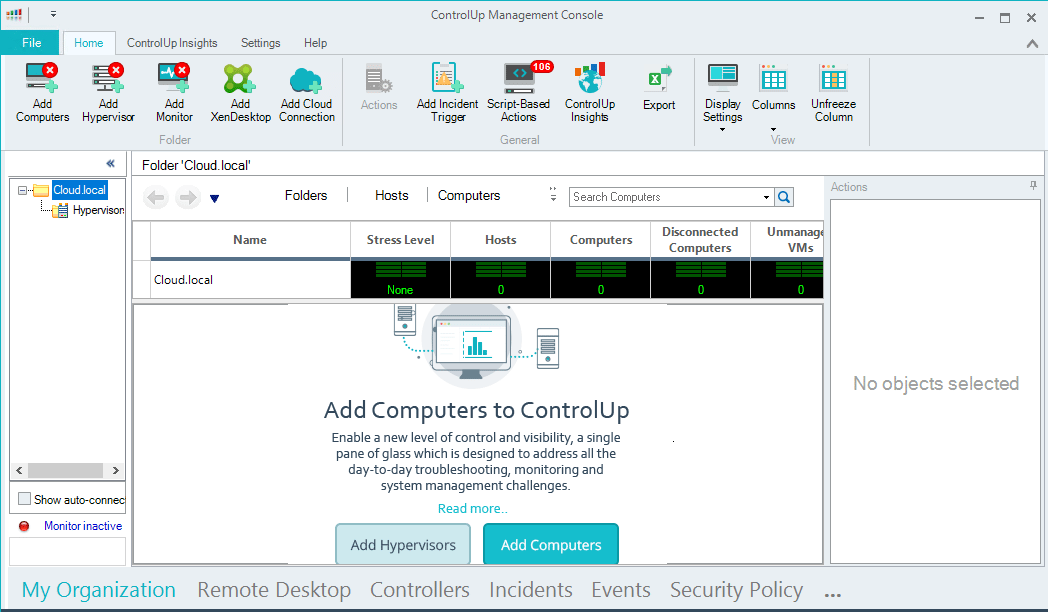
Let’s look at adding a VMware hypervisor connection to ControlUp.
Adding VMware Hypervisor connection to ControlUp
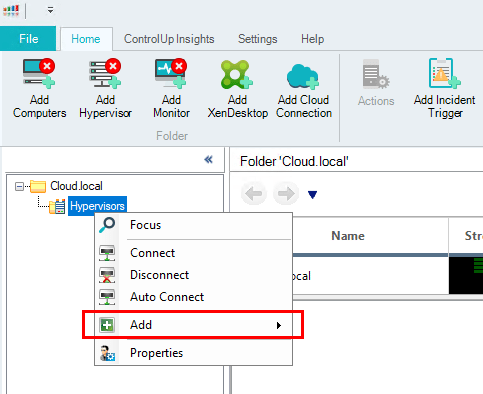
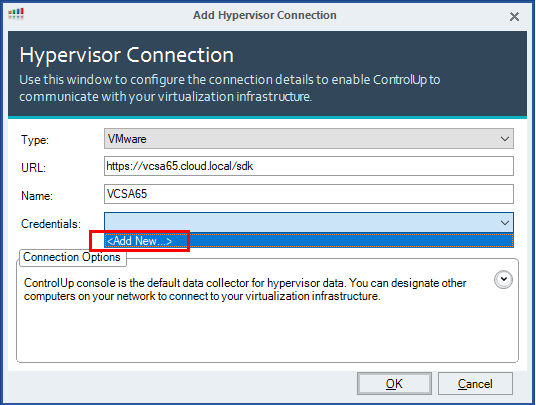
Right-click on the Hypervisors node in the tree and select Add >> Hypervisor to begin the Hypervisor Connection wizard.
The Hypervisor Connection dialog box allows selecting the Type of hypervisor, and URL string for the SDK connection in VMware.
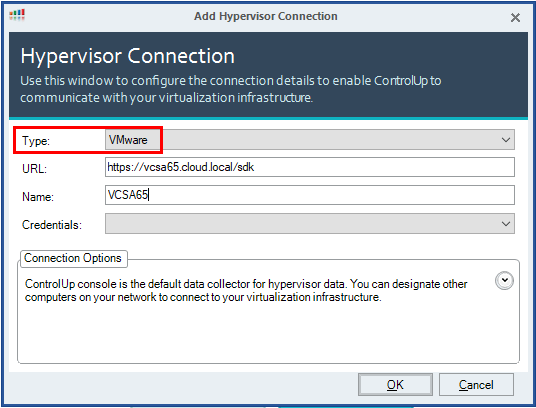
In the Credentials field, click the dropdown and click the Add New link.
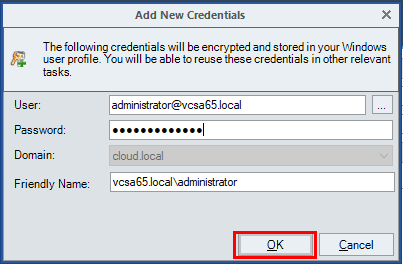
Add the credentials to connect to vCenter Server so you can start gathering information from vCenter on clusters, hosts, and virtual machines.
ControlUp VMware Performance and Health Monitoring
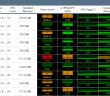
The really cool feature of the ControlUp dashboard is the “Christmas Tree” real time monitoring. The colors change as health or performance conditions present on either the host or virtual machines.
Below we can see Stress Level conditions being presented on various hosts.
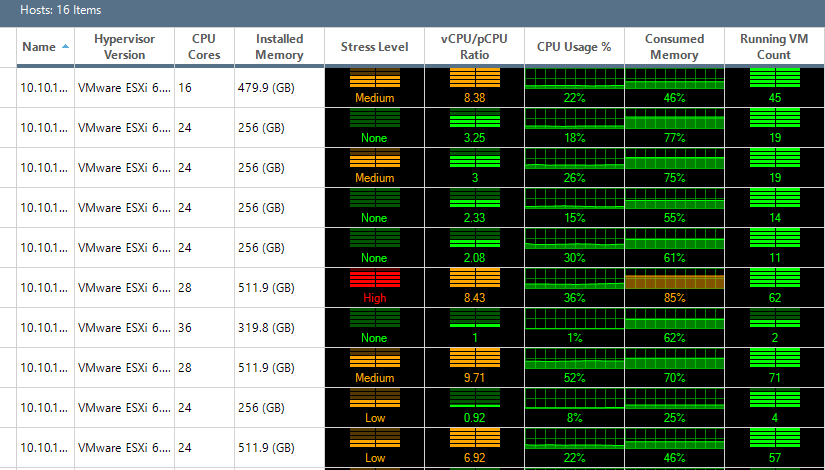
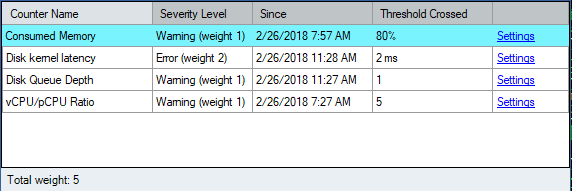
If you click the Stress Level it will allow drilling down into the condition to see the elements that are causing the threshold to present with the alerted stress level. After clicking on a server with a High stress level, the below conditions were displayed.
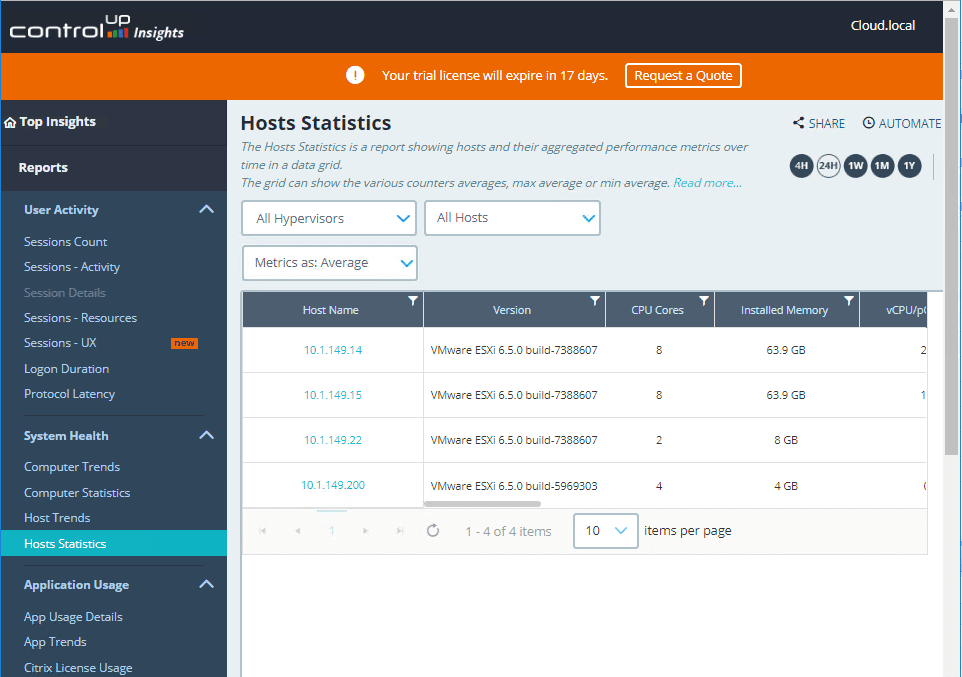
In addition to the real time aspect of the product, there is ControlUp Insights that allows for trending and building of historical data that can help indicate issues or other key performance indicators over time.
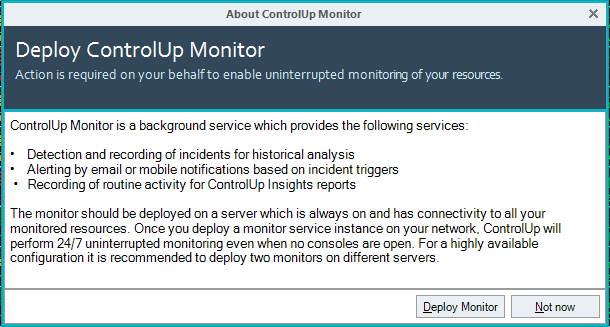
ControlUp Insights depends on the ControlUp Monitor being deployed. Unlike the ControlUp application that can simply run on a workstation, ControlUp Monitor is a background service you deploy on a server that provides 24/7 uninterrupted monitoring. This allows:
- Detection and recording of incidents for historical analysis
- Email alerts or mobile notifications
- Recording of routine activity for ControlUp Insights
This can be deployed directly from the ControlUp application. You select the server you want to install the service on and with the proper credentials you can “push” the service to the server. Additionally, you can have more than one ControlUp monitor which is recommended for high availability.
Thoughts
I found ControlUp VMware Performance and Health Monitoring a breeze with the product. The installation and initial configuration was completed in just a few minutes and has you up and running gathering valuable performance and health data very quickly. I really like the “Christmas tree” real time dashboard that allows quickly spotting “hotspots” within an environment. The ControlUp monitor allows gathering information continuously and feeding this to the ControUp Insights solution in the cloud that allows insightful analytics of that data for trends and other KPI discovery. The above look at the product barely scratches the surface as we didn’t really delve into the agents, alerting, triggers, and so forth. However, check out the ControlUp solution with a free trial and take it for a spin in your environment. All in all, it provides solid VMware monitoring and health alerting that can be found in a quick and easy package.
More in this topic
Discuss this in the Community
Google is updating how articles are shown. Don’t miss our leading home lab and tech content, written by humans, by setting Virtualization Howto as a preferred source.
About The Author
