Troubleshooting performance of any system can be one of the most challenging tasks that administrators face on a daily basis. When it comes to virtualized environments, there is added complexity in troubleshooting since you are dealing with layers of abstraction of the production workloads from the underlying physical infrastructure. There are many components of the virtual infrastructure that can lead to performance issues including the major building blocks of the virtual environment – compute, memory, storage, and network. Anywhere along the chain of these building blocks, you could potentially have a performance issue or bottleneck creating global performance issues across the environment. Having quick and effective visibility to these areas of the VMware vSphere virtual environment is essential to understanding potential performance issues. Additionally, having a tool that applies intelligent analysis and one that helps to point out the performance issues in an intuitive way takes much of the guesswork out of the process and helps to minimize the time it takes to pinpoint issues. Opvizor Performance Analyzer is a great tool that helps tremendously in analyzing VMware vSphere environments and helping adminitrators determine issues quickly. Opvizor has just release version 5.0.2 with a long list of improvements and enhancements. Let’s take a look at Troubleshooting VMware vSphere Performance with Opvizor Performance Analyzer 5.0.2 new release and the new features found in this release.
Opvizor Performance Analyzer 5.0.2 New Features
The Opvizor Performance Analyzer is a Grafana-based graphical tool that allows seeing all the pertinent areas of your VMware vSphere environment by way of dashboards that provide a great way to display performance information in the vSphere environment. One of the great things, out of the box, you get with the Performance Analyzer from Opvizor is the color coding of problem areas or virtual machines. The “ticker-board” style of the information displays problems in red and everything that is good, or within normal parameters is green. So, despite having potentially hundreds of VMs you can easily see where problem areas or virtual machines are presenting.
Before taking a look at a few screenshots of using Opvizor Performance Analyzer 5.0.2, let’s take a look at the new features and enhancements that are contained in this release. In terms of the sheer number of fixes and enhancements in this release, it is massive! Below are details straight from the Opvizor Performance Analyzer 5.0.2 change log.
Performance Improvements
- massive overall performance increase
- completely refactored timeseries backend connector
- completely refactored VMware vSphere Crawler (enhanced scalability, greater performance and better resource efficiency)
- chart rendering caching greatly improved
Functional improvements
- added vscsiStats
- Histograms for VMware vSAN
Backend – Administration
- separated Admin-UI authentication. Admin-Access now uses OS user instead of Dashboard user
- future upgrades of the appliance merges tag sets on dashboards
- Configuring mail in Admin-UI creates an notification channel automatically
- Added telegraf data collector for 32bit Windows
Operating System
- SNMP support automatically pre-installed
- Docker container engine added for future versions
- daily cronjob for configuration backup to second disk
- updated OS data collector packages
- updated Time Series database
Fixes
- Cisco UCS Crawler now accepts non IANA time zone database names from UCS Server
- Meaningful subject for report e-mails
- improved handling of inconsistent VMware data
- online resize now handles 0-length files
- removed wildcard default from AD-Group-Selection
- added hints on several fields in Admin-UI
- Testing of NetApp configuration improved
- detect API-incompatible passwords for NetApp and MS SQL
- Testing of MS SQL now reports errors in detail
- incomplete form validation fixed
- dashboards for extensions are updated automatically on Patch install
- warn on missing admin email
- adjust retention for config and performance
- false positive alerts fixed
- and many more
New dashboards
- Heatmap Virtual Machine
- Highlights Microsoft SQL Server
- VMware Capacity Planning Detail
- VMware VSAN highlights
- VMware vscsiStats Cluster/VM/Disk
- VMware vscsiStats Host/Datastore
- VMware Wasted Resources Potential Savings
Improved dashboards
- Highlights Virtual Machines Disksize:
- fine-grained CPU-Ready and Costop calculation for SMP-machines
- include only current Snapshots in top 5 list
- added guest OS reported free space
- Highlights Virtual Machines:
- added drill down to detail dashboards
- fine-grained CPU-Ready and Costop calculation for SMP-machines
- added drill down to detail dashboards
- Microsoft Windows Host Overview:
- Added Disk Reads/sec, Disk Writes/sec, Disk Read Throughput, Disk Write Throughput
- Starter ESXi Host Troubleshooting:
- added drill down to detail dashboards
- fine-grained CPU-Ready and Costop calculation for SMP-machines
- Starter VMware Virtual Machines:
- added drill down to detail dashboards
- fine-grained CPU-Ready and Costop calculation for SMP-machines
- added NUMA Home Node Migrations
- VMware Performance ESXi Host:
- renamed from VMware Performance Host Single
- added additional NUMA data
- VMware Performance VM Cluster:
- fine-grained CPU-Ready and Costop calculation for SMP-machines
- added drill down to detail dashboards
- VMware Performance VM:
- fine-grained CPU-Ready and Costop calculation for SMP-machines
- VMware VSAN Cache Diskgroup Stats:
- added Read and Write Requests by Size histograms
- added Read and Write Requests by Latency histograms
- VMware VSAN Storage Diskgroup Stats:
- added Read and Write Requests by Size histograms
- added Read and Write Requests by Latency histograms
Opvizor Performance Analyzer 5.0.2 Upgrade Process
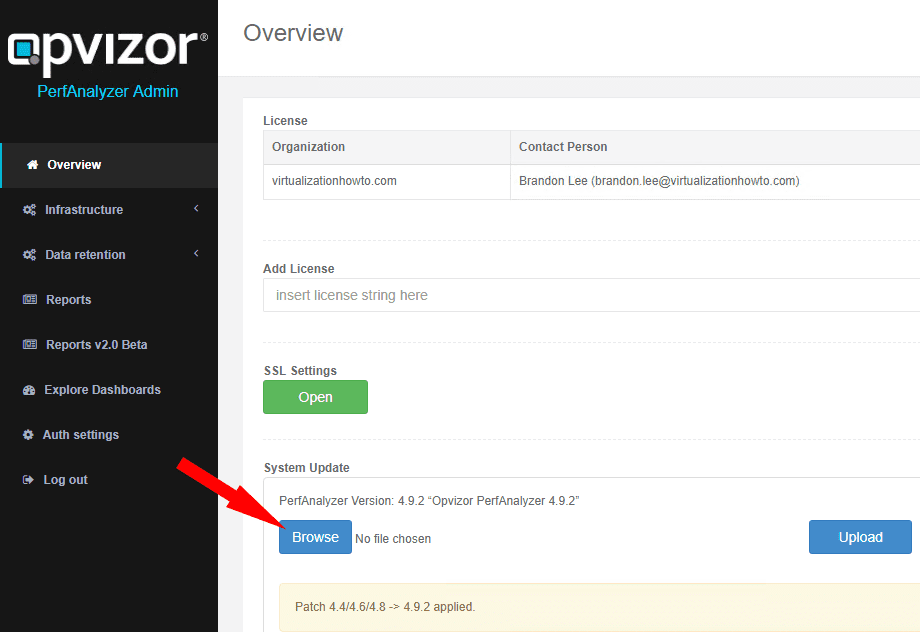
Before using the new Opvizor Performance Analyzer 5.0.2 new features, how do you go about upgrading to this release of the product? Through the “admin” console, you have the ability to upload an upgrade file that will bring the Opvizor Performance Analyzer appliance up to the latest version.
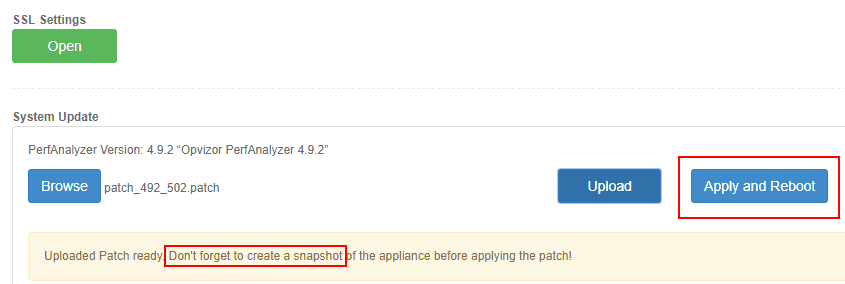
***Note*** The first thing you want to do before following the steps below is to take a quick snapshot of your opvizor appliance.
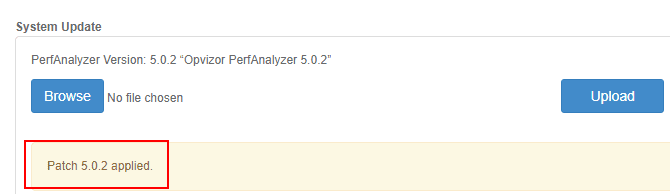
After taking a snapshot, you need to upload the updater file you download from the 5.0.2 change log page. Once you download the update file, visit the Admin link from your appliance UI. Under the System Update section, browse to the update file you downloaded.
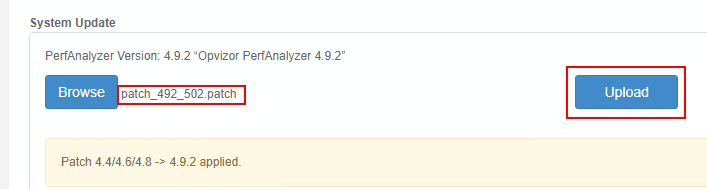
Once you select the file from the browse dialog box, click the Upload button.
Troubleshooting VMware vSphere Performance with Opvizor Performance Analyzer 5.0.2 New Release
There are many great troubleshooting dashboards contained in the new Opvizor Performance Analyzer 5.0.2 release that help pinpoint problem areas in the vSphere environment. Let’s take a look at a few of the really great dashboards that provide tremendous troubleshooting capabilities to vSphere administrators.
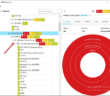
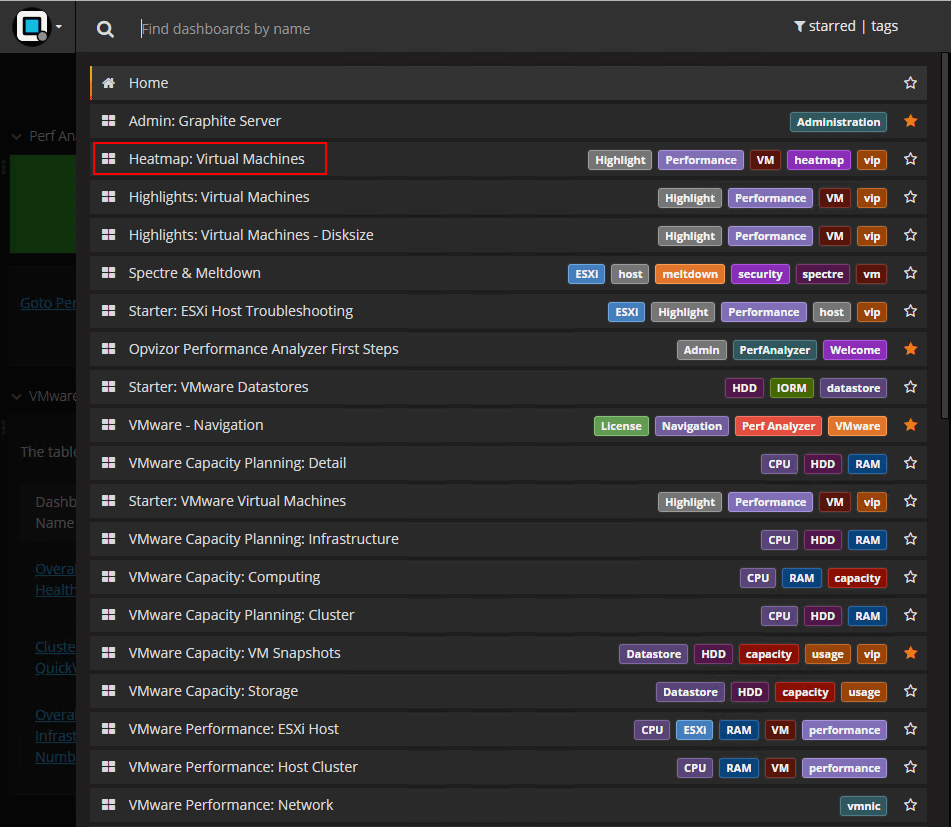
On the dashboards screen, when you pull down the dashboards menu, you will see the wide range and multitude of preconfigured dashboards that come with Opvizor right out of the box. Highlighted below is one of the new dashboards – the Heatmap: Virtual Machines.
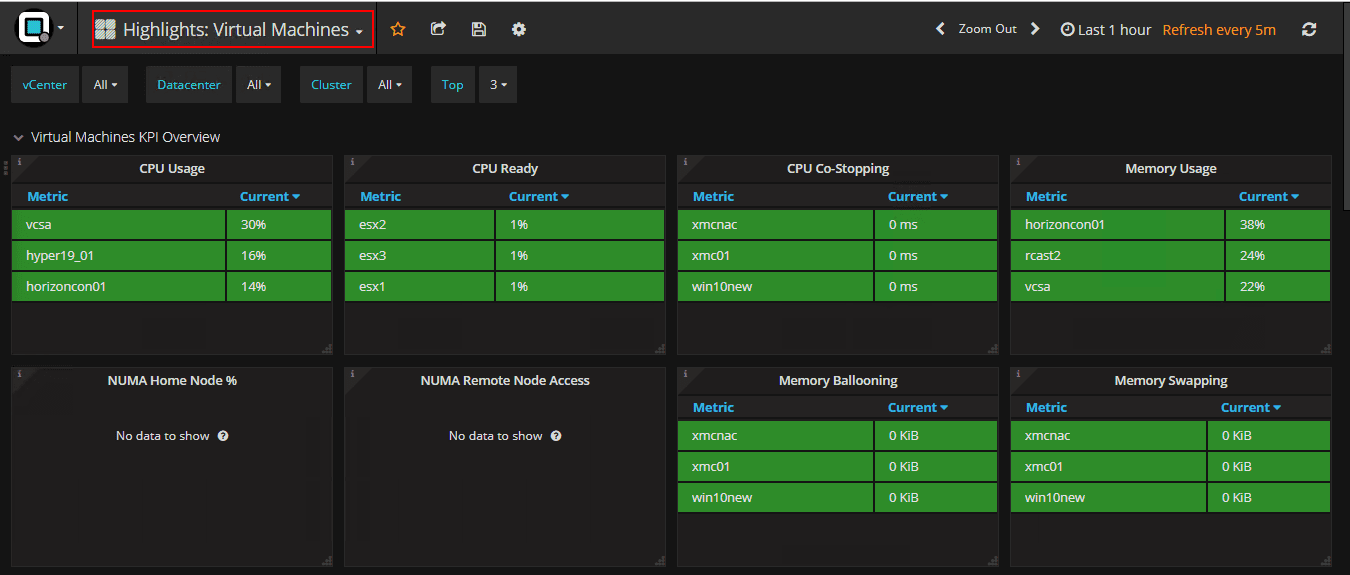
The Highlights: Virtual Machines dashboard makes it easy to see virtual machines that may be struggling or having issues for one reason or another. You get a wealth of valuable KPI metrics such as co-stopping, memory usage, cpu usage, memory swapping, memory ballooning, etc.
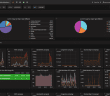
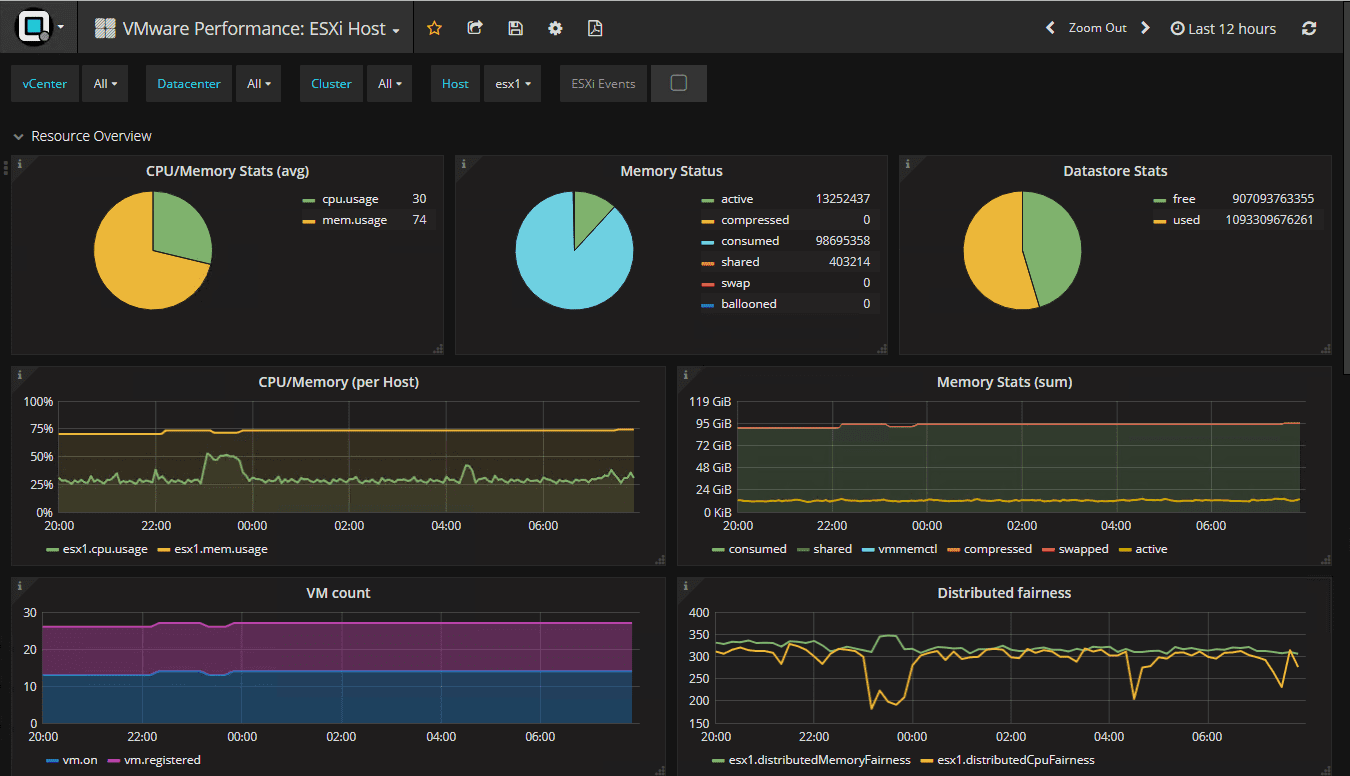
For quickly and easily seeing if a particular ESXi host is struggling, the VMware Performance ESXi Host dashboard gives insightful metrics for a particular host.
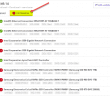
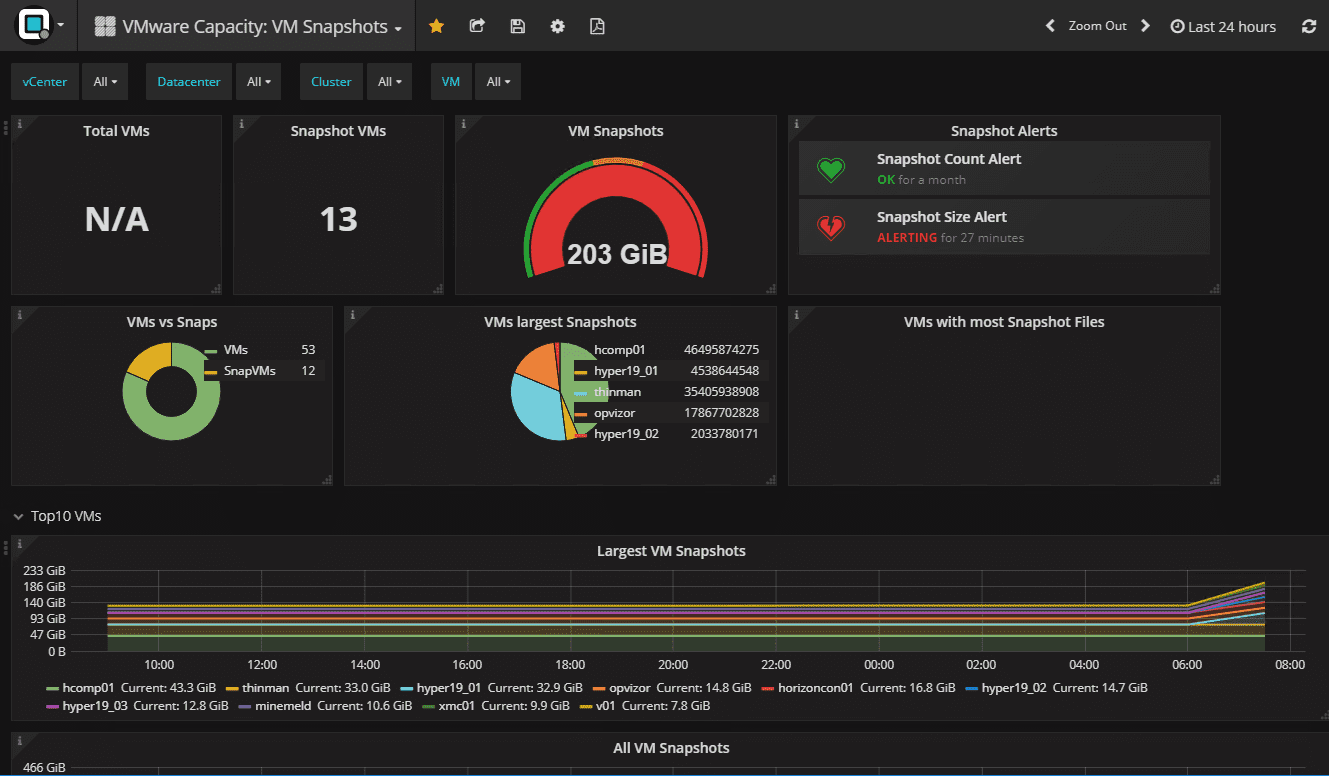
Basic housekeeping and troubleshooting can also be done with the VMware Capacity: VM Snapshots dashboard to determine if you have large snapshots that may have been forgotten about.
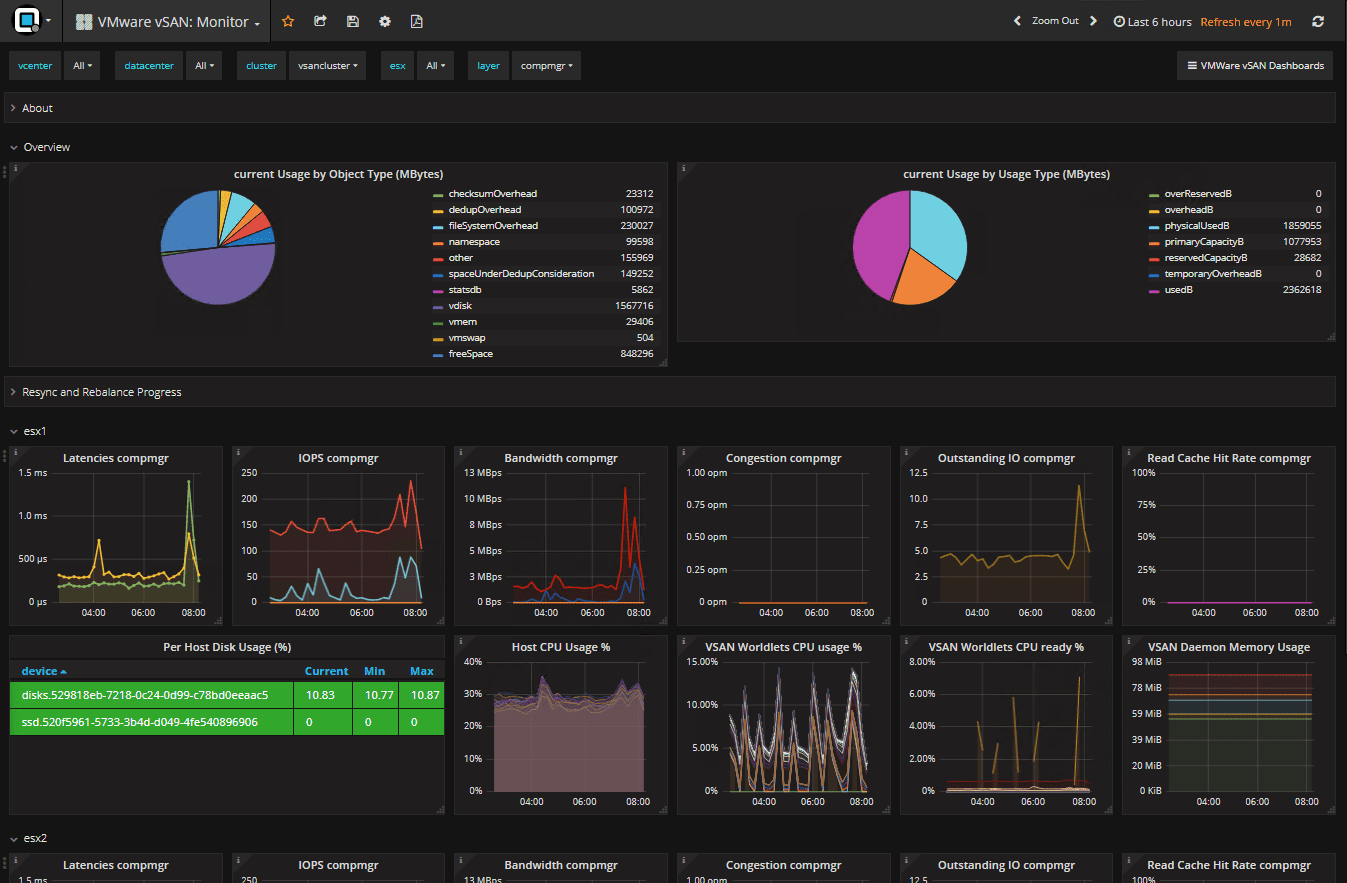
If you are running VMware vSAN, the VMware vSAN Monitor found in Opvizor Performance Analyzer is a great tool. It is a great way to see in one place, all the pertinent metrics for performance, capacity, resync, latency, and other KPI indicators for troubleshooting vSAN.
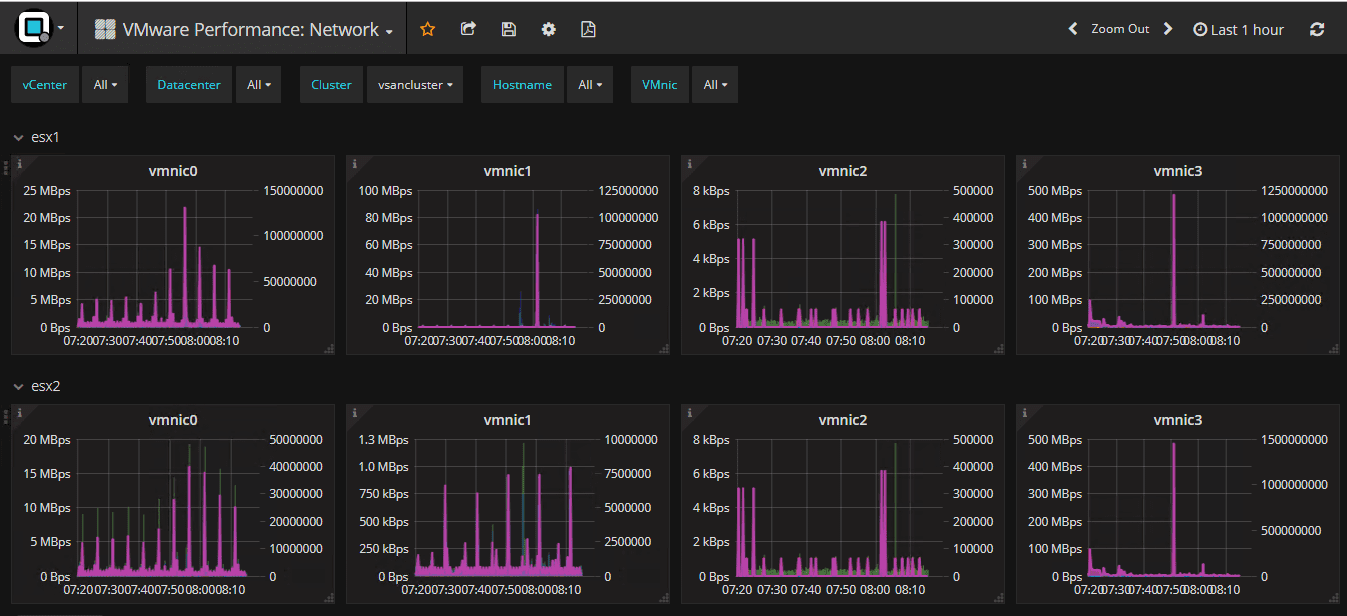
Network troubleshooting is not left out either. The VMware Performance Network dashboard easily shows the network throughput and activity per vmnic on each host in a cluster.
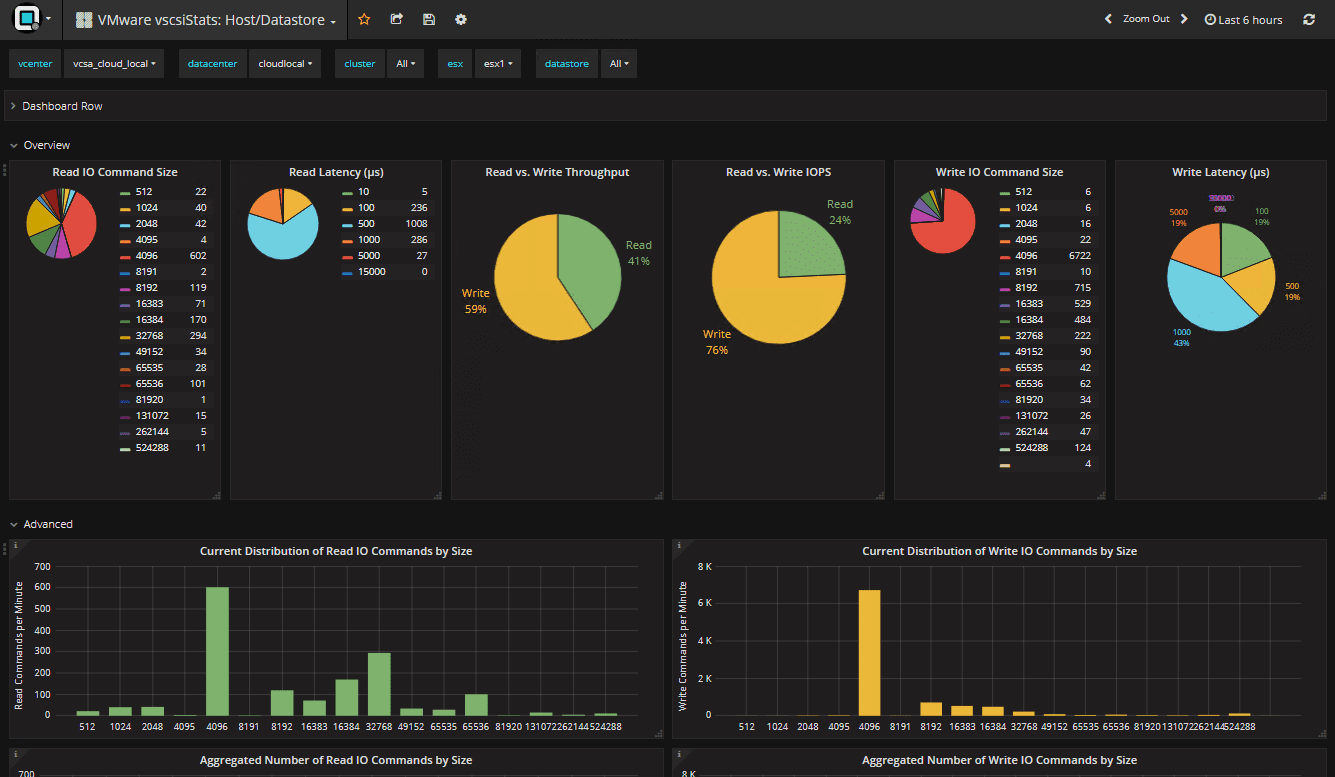
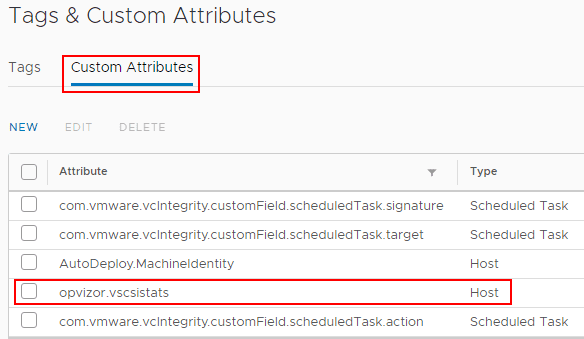
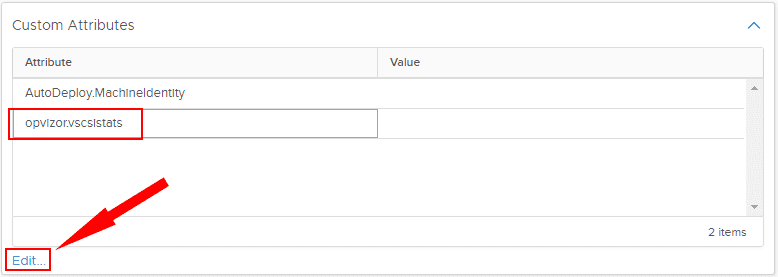
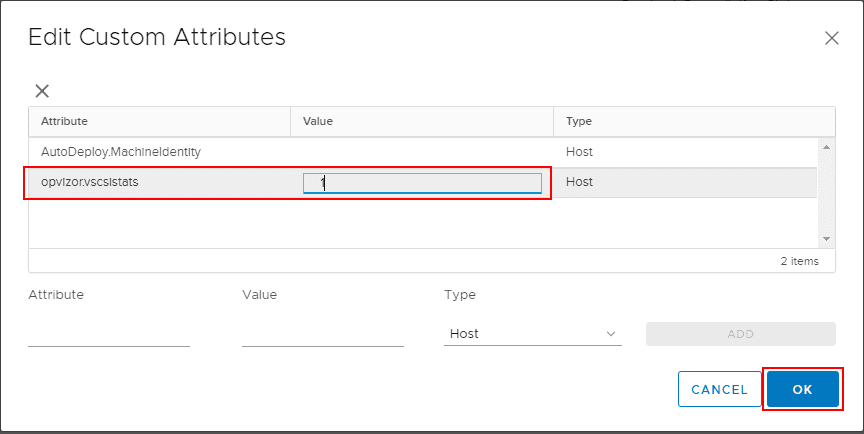
A new addition to this release is the VMware vscsiStats dashboards that can be diplayed on the host/datatstore or cluster level. The vscsiStats is a tool that runs on the ESXi host. it allows in depth analysis of virtual machines, hosts, and datastores with data that is not avaiable in vCenter Server. It is a tool that is recommended to only be enabled when you are actively troubleshooting since it consumes some host resources itself. This release of Opvizor has created an on demand invocation for vscsiStats. It simply requires that you add a Custom Attribute to vCenter Server, applied to the host level, and then enable the attributed by setting its value to “1”.
A quick run through of how to create the custom attribute and enable it for a host is shown below.
Other Notable Troubleshooting Information and Dashboards
There are other great dashboards found in Opvizor Performance Analyzer including a Spectre & Meltdown view of the vSphere environment to show which hosts are patched for Spectre & Meltdown as well as virtual machines that need to be patched, or are patched but need a reboot.
Capacity planning now has a VMware Capacity Planning: Detail dashboard that now shows more information related to capacity per VM and provides an overall utilization check.
Takeaways
Troubleshooting VMware vSphere Performance with Opvizor Performance Analyzer 5.0.2 New Release is now easier than before. Opvizor provides a very unique and graphical way to represent information coming from your vSphere environment with intelligence and insight so that you can quickly discern where issues exist in the compute, storage, and network layers. Troubleshooting a complex vSphere environment can be intimidating and using standard tools and log parsing might take hours or days to uncover underlying issues. With Opvizor Performance Analyzer 5.0.2, your troubleshooting time will no doubt be drastically reduced. I use Opvizor Performance Analyzer in the home lab as well as recommend this to customers looking for an easy way to gather performance information fro their vSphere environment and then intelligently discern where problems exist. Be sure to download a trial version of the Opvizor Performance Analyzer appliance to test it out for your self.
Google is updating how articles are shown. Don’t miss our leading home lab and tech content, written by humans, by setting Virtualization Howto as a preferred source.
About The Author