Monitoring your vSphere environment at the cluster, host, or virtual machine level is key in understanding where performance bottlenecks may exist and why production workloads may not be performing adequately. In addition, monitoring certain vSphere metrics can also help to identify hotspots in the environment before potential performance bottlenecks present themselves. We have covered various tools and utilities that can be used to monitor and troubleshoot performance in a vSphere environment. Today we take a closer look at one of those tools – Opvizor Performance Analyzer. It is an impressive tool to be able to quickly have all the important information at your fingertips. Opvizor comes with a wide range of prebuilt dashboards that display much of the information that vSphere administrators want to see. However, you have the ability as well to create additional dashboards. In this post we will take a look at Opvizor Performance Analyzer VMware Performance Monitoring.
Opvizor Performance Analyzer VMware Performance Monitoring
Opvizor Performance Analyzer is a great product that allows vSphere administrators to quickly get up and running with intelligent VMware Performance Monitoring of important metrics in the vSphere environment. The thing I really like about Opvizor is the prebuilt dashboards. Other vSphere performance monitors and analyzers may include a good number of performance monitoring capabilities, however, by default, YOU have to build all the alerts, dashboards, etc. It is great that right out of the box, this is a powerful preconfigured analyzer and tool for monitoring performance and capacity. The result is that from the first boot of the appliance, it is a value add to any vSphere environment. Additionally, it is built on top of Grafana so the dashboards are beautiful.
Performance Analyzer is deployed via a small OVF appliance. We won’t highlight the deployment process as it is a standard OVA/OVF deploy with no surprises. For the purposes of this post, we are using the Opvizor Performance Analyzer 4.6 appliance.
Features of Opvizor Performance Analyzer include:
- Easy OVF appliance deployment
- Prebuilt Dashboards highlighting performance and capacity views
- Ability to build your own dashboards
- Playlists to rotate through configured dashboards
- Reporting
- Alerting
- Important NUMA metrics, VMkernel Queue, ESXi HBA adapter, and Network compass added in version 4.6
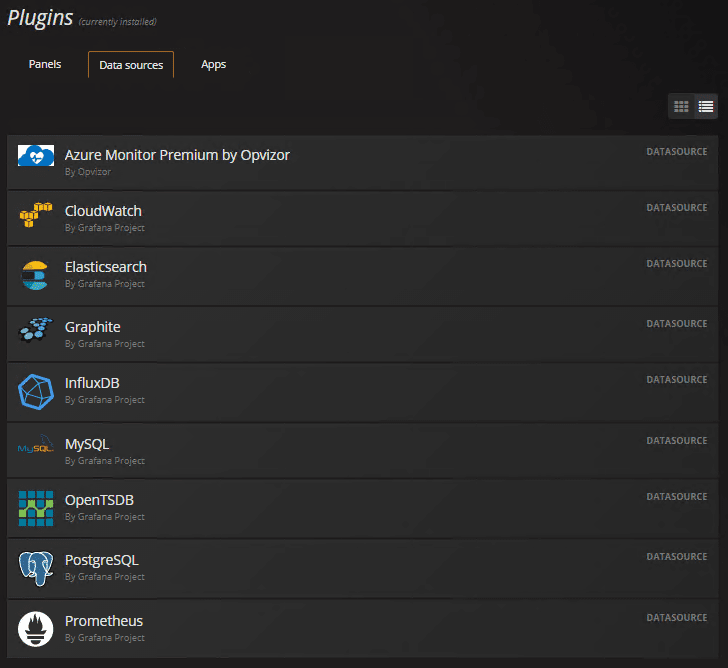
- Tons of integrations, including MS SQL, MySQL, PostgreSQL, InfluxDB, CloudWatch, Azure, Hyper-V, Docker, and others
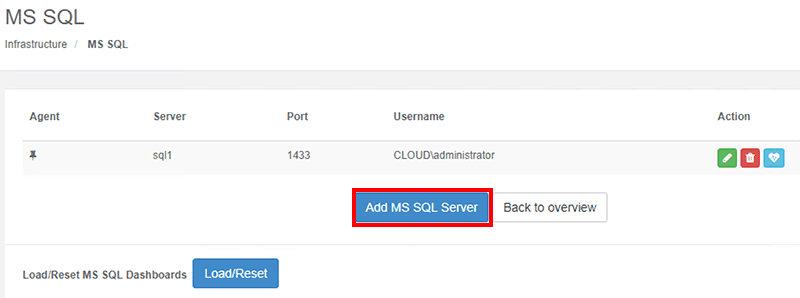
Already included with the 4.6 appliance is the MS SQL integration. You simply add the SQL Server to the appliance with appropriate permissions and Load the MS SQL dashboards. This allows viewing your VM at both the application performance level and the VM performance level.
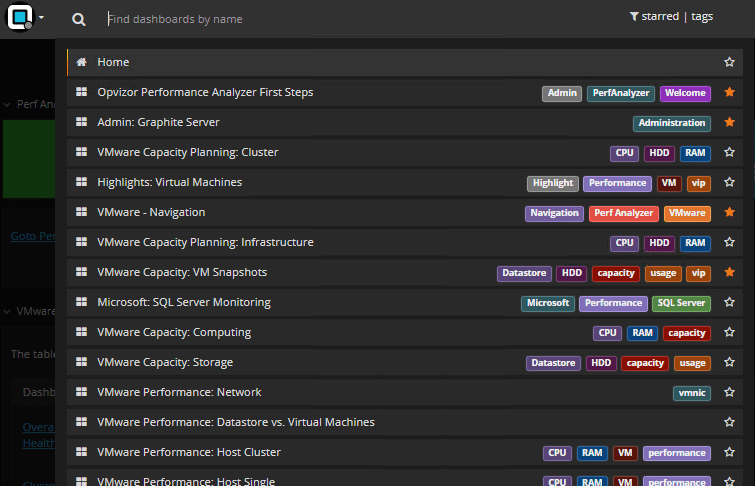
As mentioned, there are a wide variety of prebuilt dashboards covering most of the performance metrics that ones will want to monitor in their environments. Below, the screenshot is only capturing a subset of the default prebuilt dashboards.
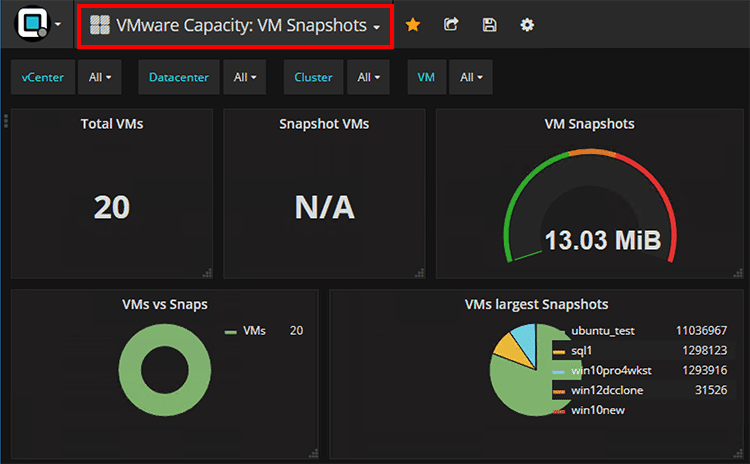
Below is a quick look at just one of the windows in the VMware Capacity – VM Snapshots dashboard. This is a great dashboard to quickly see snapshots in the environment and information concerning those snapshots.
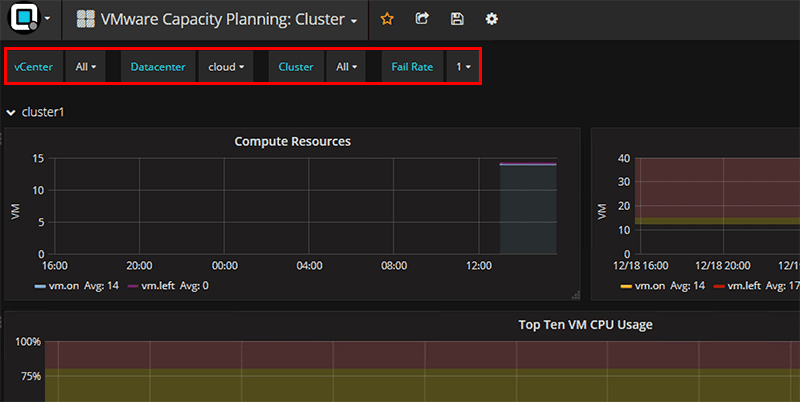
There are a number of capacity planning dashboards as well that help to plan available capacity and areas where resources may be limited.
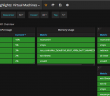
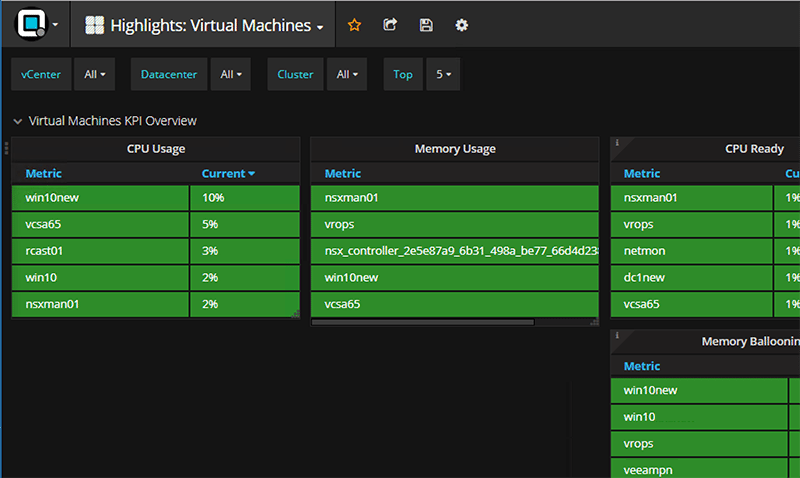
The Highlights: Virtual Machines dashboard is a great resource for a high level view of all VMs in the environment and any hotspots that may be developing. The color changes for each category displayed if the metrics fall outside of performance best practices (CPU usage, CPU Ready, Memory, etc). These views can also be configured to update at specified intervals all the way down to every 5 seconds.
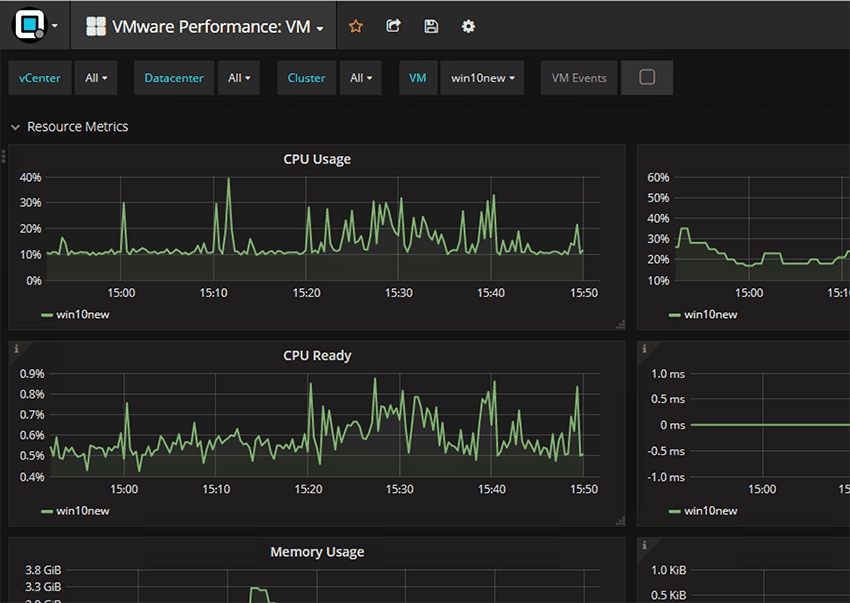
Another great dashboard for monitoring performance, the VMware Performance: VM dashboard. This dashboard allows you to key in on a single VM or a selected number of VMs. By default the dashboard displays crucial performance metrics for a virtual machine, including CPU usage, CPU Ready, CPU co-stop, Memory Usage, Memory Ballooning, Disk Read, Disk Write, vDisk I/O Latency.
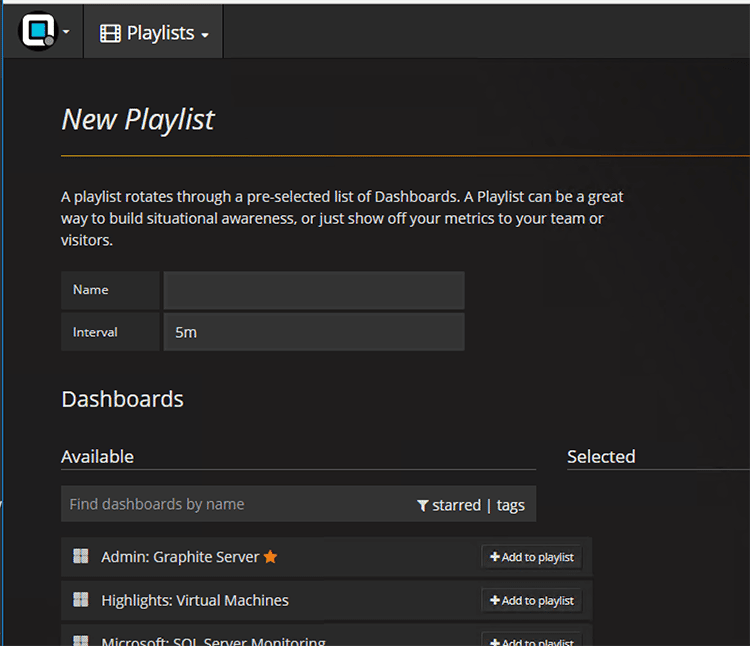
A really cool feature of Opvizor is the ability to create Playlists. Playlists allow cycling through chosen dashboards at specific intervals. You an use this to view a continuously cycling list of dashboards for performance monitoring or to simply show off your environment 🙂 Once the playlist is created, you simply hit the Play button to start cycling through the dashboards at specified intervals.
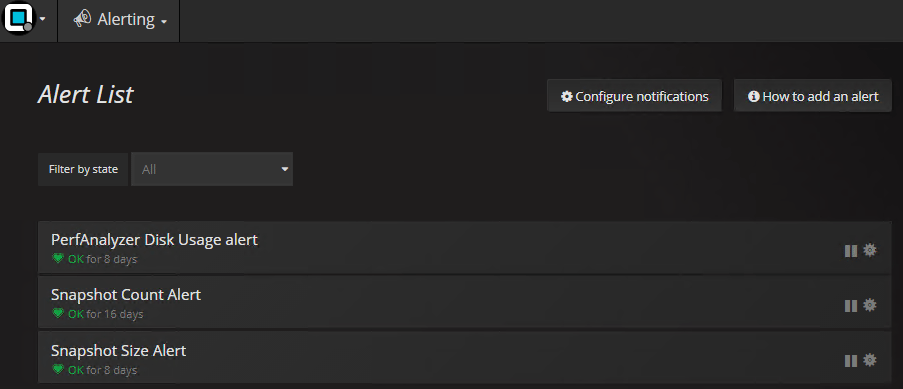
Opvizor alerts allow notifications of certain thresholds once they are reached at specific values and/or seen for a certain amount of time.
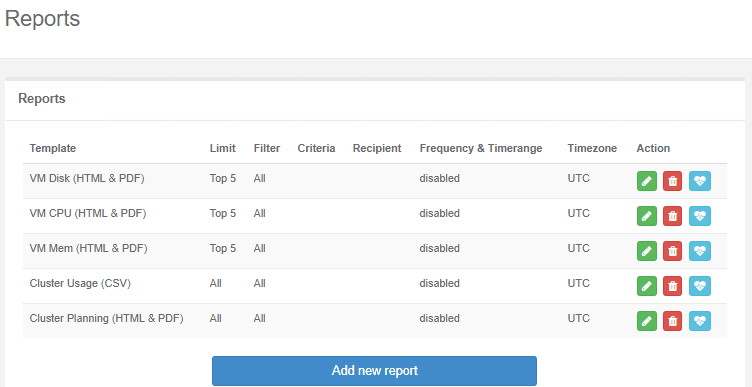
Opvizor also has prebuilt reports that allow email reports to be generated and sent for certain environment health metrics. You can also add new reports as well.
Thoughts
Opvizor Performance Analyzer is one of the best monitoring tools you can spin up and quickly get valuable metrics from your vSphere environment. With Opvizor Performance Analyzer VMware Performance Monitoring, the prebuilt dashboards provide valuable information, displayed intelligently and beautifully in such a way that is extremely intuitive. Opvizor is a pay for product, but does have a 30 day demo appliance you can spin up and take for a test drive. Additionally, there is an online demo environment you can log into and explore without provisioning your own appliance. I give Opvizor Performance Analyzer two thumbs up! Great product, easy to use, and quickly adds value.
More in this topic

Discuss this in the Community
Google is updating how articles are shown. Don’t miss our leading home lab and tech content, written by humans, by setting Virtualization Howto as a preferred source.
About The Author
