Recently, I was troubleshooting an issue with a production VMware vSphere cluster that was presenting with severe performance issues across the board. After triaging the symptoms of the performance issue it pointed to storage as being the culprit for the issue. How do you go about diagnosing a storage performance issue in VMware vSphere? Where do you look? What tools can be used to determine the underlying storage issue? What do you want to have on hand when you begin troubleshooting a production impacting storage performance issue? It is good to think ahead and be prepared for production issues and having a checklist, tools, and documentation handy beforehand and knowing where this is found is crucial to maintaining SLAs. Let’s take a look at VMware vSphere esxi storage performance troubleshooting to examine a few of the crucial items that should be on the checklist before, during, and after troubleshooting.
What information do you need to correctly troubleshoot?
First things first, what do you need to have on hand when you start troubleshooting a vSphere environment, especially focusing in on storage? As is often the case, you think you will “remember” all the login information and other information needed to check all aspects of the vSphere stack, however, when you are under stress and pressure to get things up and running, the last thing you want to do is scramble for information just to get in to ther pertinent aspects of the environment to troubleshoot. When focusing in on storage, what information is helpful and really necessary when troubleshooting VMware vSphere storage?
Basic VMware vSphere storage performance troubleshooting information needed:
Aside from the below, any documentation that speaks to the actual architectural layout of the vSphere cluster is helpful in these situations. If you don’t know how the vSphere cluster is configured, it makes it much more difficult to begin troubleshooting. We all hate documentation and having to document things, but in times of production impacting events, having good documentation that is accurate, and easily accessible, can be a life saver.
ESXi hosts:
- Hostnames/IPs
- Host ESXi version and patch level
- root passwords
- Documented IP addresses for storage vmkernel interfaces.
- Storage configuration – iSCSI, etc
- Network adapters – make, drivers, etc
Storage switches:
- IP addresses used
- Firmware version
- Login to storage switches
- VLANs configured for storage
- Switch configuration – LAG or stacked?
Storage Array:
- IP address of SAN management port
- Firmware level
- LUN configuration, RAID level, number of drives, sizes, drive firmware
- Login to SAN array management interface
- Vendor specific SAN management tools loaded and handy
There can certainly be more documented components that even listed above. However, the more detailed the better when it comes to knowing how things are connected, configured, and designed. Keeping this information up to date when changes are made is crucial as well.
VMware vSphere ESXi Storage Performance Troubleshooting
Now that documentation has been discussed and covered, we can get down to the actual troubleshooting of the storage issue. What are some key areas to begin looking? In my recent case with storage performance troubleshooting, I had a (4) node ESXi cluster that had extremely sluggish VM performance across the board. With the process of most likely causes, if you have performance affected across all your hosts, if you have shared storage, which I did in my case, storage is automatically a very likely culprit. The likelihood of having performance issues at the same time on multiple hosts that isn’t storage related is fairly unlikely. Shared storage is always a good place to start if the performance degradation exists across the vSphere cluster and isn’t limited to a particular host.
Check ESXi Host Device Latency to Storage with ESXTOP
A good place to start is ESXTOP on an ESXi host. Using the storage portion of ESXTOP, you can gain very valuable information when troubleshooting performance. It makes seeing any latency issues very easy. Straight from the VMware KB article found here on troubleshooting storage performance with ESXTOP, you can step through seeing latency values like so:
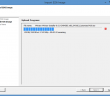
- Start esxtop by typing esxtop at the command line.
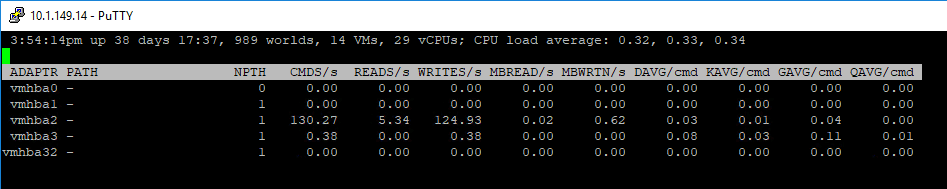
- Press d to switch to disk view (HBA mode).
- To view the entire Device name, press SHIFT + L and enter 36 in Change the name field size.
- Press f to modify the fields that are displayed.
- Press b, c, d, e, h, and j to toggle the fields and press Enter.
- Press s and then 2 to alter the update time to every 2 seconds and press Enter.
For per LUN basis troubleshooting which I found very helpful in this case:
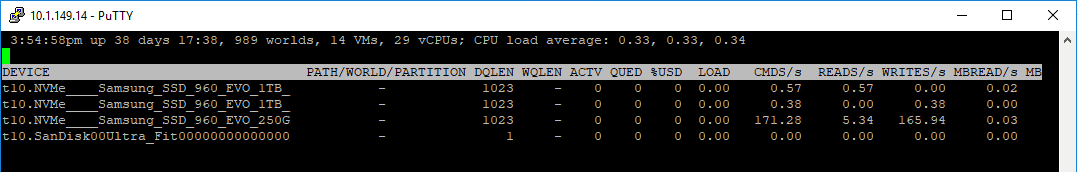
- Start esxtop by typing esxtop from the command line.
- Press u to switch to disk view (LUN mode).
- Press f to modify the fields that are displayed.
- Press b, c, f, and h to toggle the fields and press Enter.
- Press s and then 2 to alter the update time to every 2 seconds and press Enter.
Below, is not a great example of showing LUNs as these are DAS devices. However, in an iSCSI environment, you would see your device names with the above ESXTOP configuration.
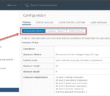
A great command to use to actually map a device name to a “friendly name” or the datastore name that you see in the vSphere client is:
esxcli storage vmfs extent list
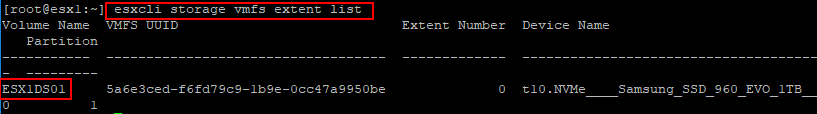 Mapping device name to Partition name or friendly VMware datastore name
ESXTOP Columns to Look at for Storage Performance Troubleshooting
There are (4) columns that really give a good bit of insight to latency issues in ESXTOP using the above monitoring configuration.
- GAVG – Guest Average Latency is the total latency seen from a vSphere guest or your virtual machines. Also, a point to note is that GAVG is made up of the KAVG and DAVG.
- KAVG – Kernel Average Latency is the time an I/O request is waiting in the vSphere storage stack
- QAVG – Queue Average latency is the time spent waiting in a queue in the vSphere storage stack
- DAVG – Device Average Latency is latency coming from the physical hardware, HBA and/or storage device
In the world of latency, a perfect world that is, you would want latency to be “0”. However, in general terms, the anything above 20 milliseconds rule is a good rule of thumb. However, for the above metrics, you should see the following for acceptable performance that doesn’t indicate a storage performance problem.
- GAVG – anything below 20 ms
- KAVG – 0-2 ms
- DAVG – 25ms or less
- QAVG – 0 ms
Good threshold documentation resources:
- http://www.yellow-bricks.com/esxtop/
- https://blogs.vmware.com/vsphere/2012/05/troubleshooting-storage-performance-in-vsphere-part-1-the-basics.html
Log Resources for Troubleshooting Storage Performance Issues
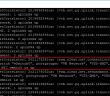
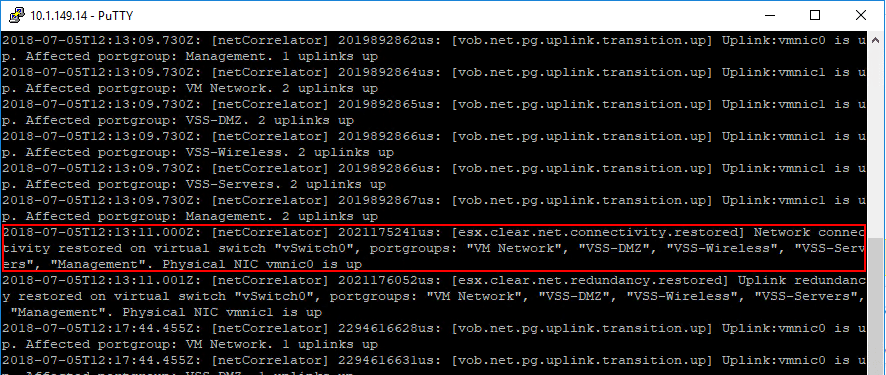
A great log resource to take a look at when seeing if there are potential performance issues with storage or in general is the vobd.log file. This is located in the /var/log directory. You can take a look at the log with the following command after changing the directory to the /var/log location. As you can see below, it captures network related events. Also, if you have storage latency issues, you will get messages regarding storage performance deteriorated with device names, etc.
cat vobd.log | less
Additional VMware vSphere Storage Performance Troubleshooting Tips
A few more tips to note include:
- Check everything in between the physical architecture for your storage network, including iSCSI switches.
- Check your switch logs to make sure there are no errors or other events related to your storage network or the device itself.
- Ping your iSCSI targets from your vmkernel addresses to make sure there are no connectivity issues with the actual iSCSI targets.
- Check your SAN itself – make sure there are no failed drives, storage controller failover events, or any other errors that may affect performance
- Check the free disk space that is available on each LUN mounted to your ESXi hosts
Takeaways
VMware vSphere ESXi Storage Performance Troubleshooting might seem like a daunting task at first. However, with proper documentation, an understanding of your overall architecture with storage and several very good built-in tools, you can easily verify any latency related issues in the environment. Simply seeing that you are having a latency issue and potentially which devices that are experiencing it is a huge help. By using ESXTOP, esxcli command line utilities, vodb.log and other troubleshooting locations such as your switches and SAN storage device will hopefully allow pinpointing the culprit of the latency issue. Always engage VMware tech support as well as vendor specific storage support as they have the tools and expertise to quickly look for problem areas.
Google is updating how articles are shown. Don’t miss our leading home lab and tech content, written by humans, by setting Virtualization Howto as a preferred source.
About The Author