


There are so many new tools out there for home lab related activities. So, I have to pick and choose what I decide to test out in my home lab. But, I typically find myself deploying a lot of new infrastructure solutions. The part I don’t enjoy is keeping track of everything once it is deployed. Documentation and operations related docs about things like Proxmox nodes, Docker hosts, IP addresses, VLANs, firewalls, VMs, containers, etc. For solving this challenge, a new solution called RackPad caught my attention. Let’s look and see what it can do for your home lab operations and documentation.
What is RackPad?
RackPad is an open source infrastructure solution that is specifically built for environment like home labs. It combines several important aspects and features I think for this use case. It brings together inventory management, rack visualization, topology mapping, IP address management, documentation, and many other features, like Proxmox integration.
When you turn up more Proxmox VE Servers, Docker container hosts, AI home labs with MCP servers all over the place, clients, etc, you need something to help you maintain operations and documentation of how things fit together.
After spending some time with it I think it definitely has the potential to be one of the more interesting projects you might try out in your home lab and maybe worth keeping around and using long term.
Installing RackPad in the home lab
One of the things that I like about RackPad is that it gives us a native Docker installation that makes spinning up the solution in the home lab extremely easy. There are a couple of ways you can install RackPad with a bash script that sets the Docker configuration up for you, or a manual approach.
Below is the recommended no-clone install that uses the GHCR image:
sudo apt-get update
sudo apt-get install -y curl ca-certificates
curl -fsSL https://raw.githubusercontent.com/Kobii-git/Rackpad/main/scripts/install-docker.sh | bash
You can also control the tag that you want to use with the following. I used the LATEST designation.
curl -fsSL https://raw.githubusercontent.com/Kobii-git/Rackpad/main/scripts/install-docker.sh -o /tmp/install-rackpad.sh
RACKPAD_TAG=1.5.10 bash /tmp/install-rackpad.sh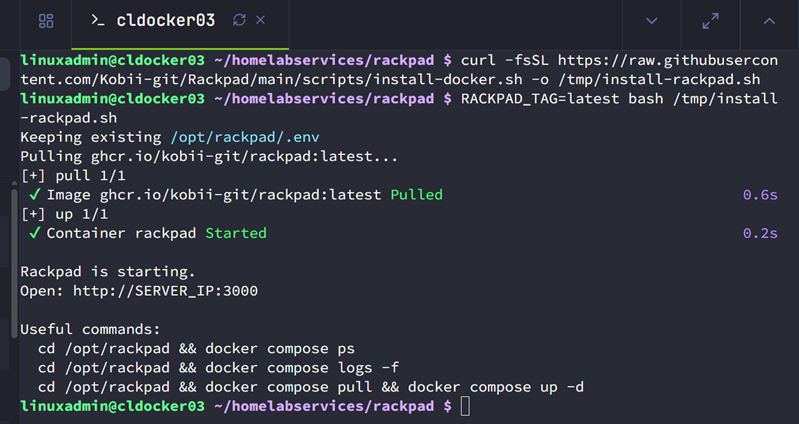
After browsing out to the Docker container host on port 3000, its default port, you will see the configuration for the admin account:
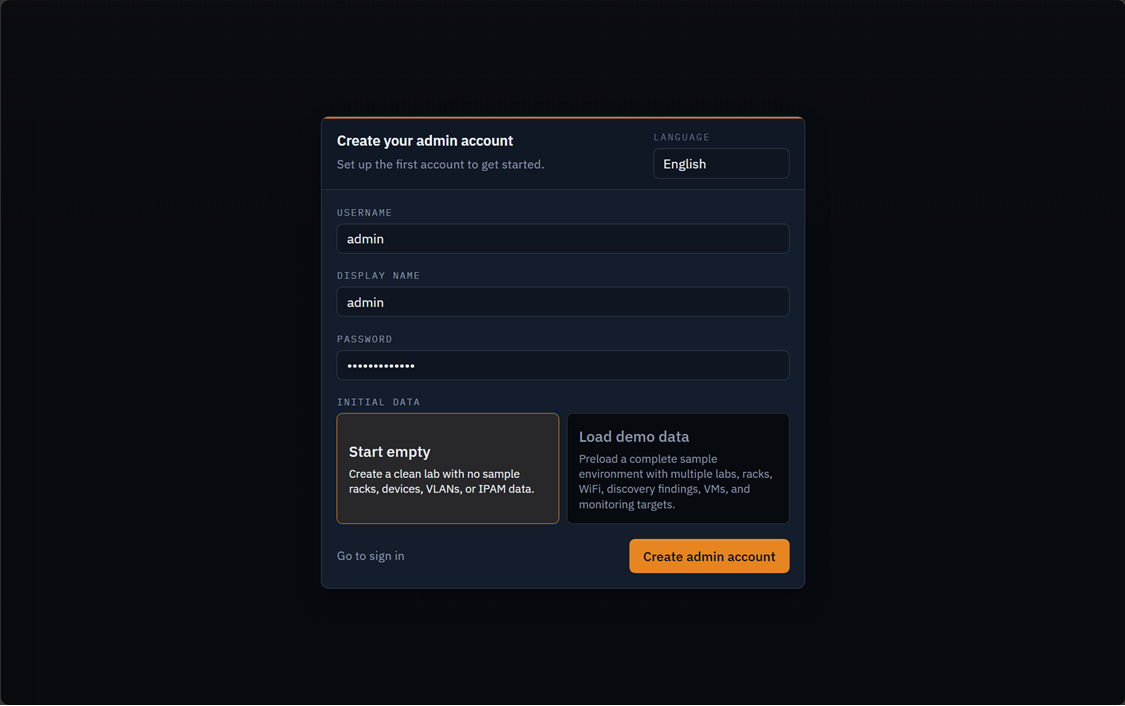
I actually spun up a couple of instances of RackPad. I created one with the demo data and one that was empty. I did this just so I could have a view of things with data already populated to get more familiar with the solution.
RackPad dashboard
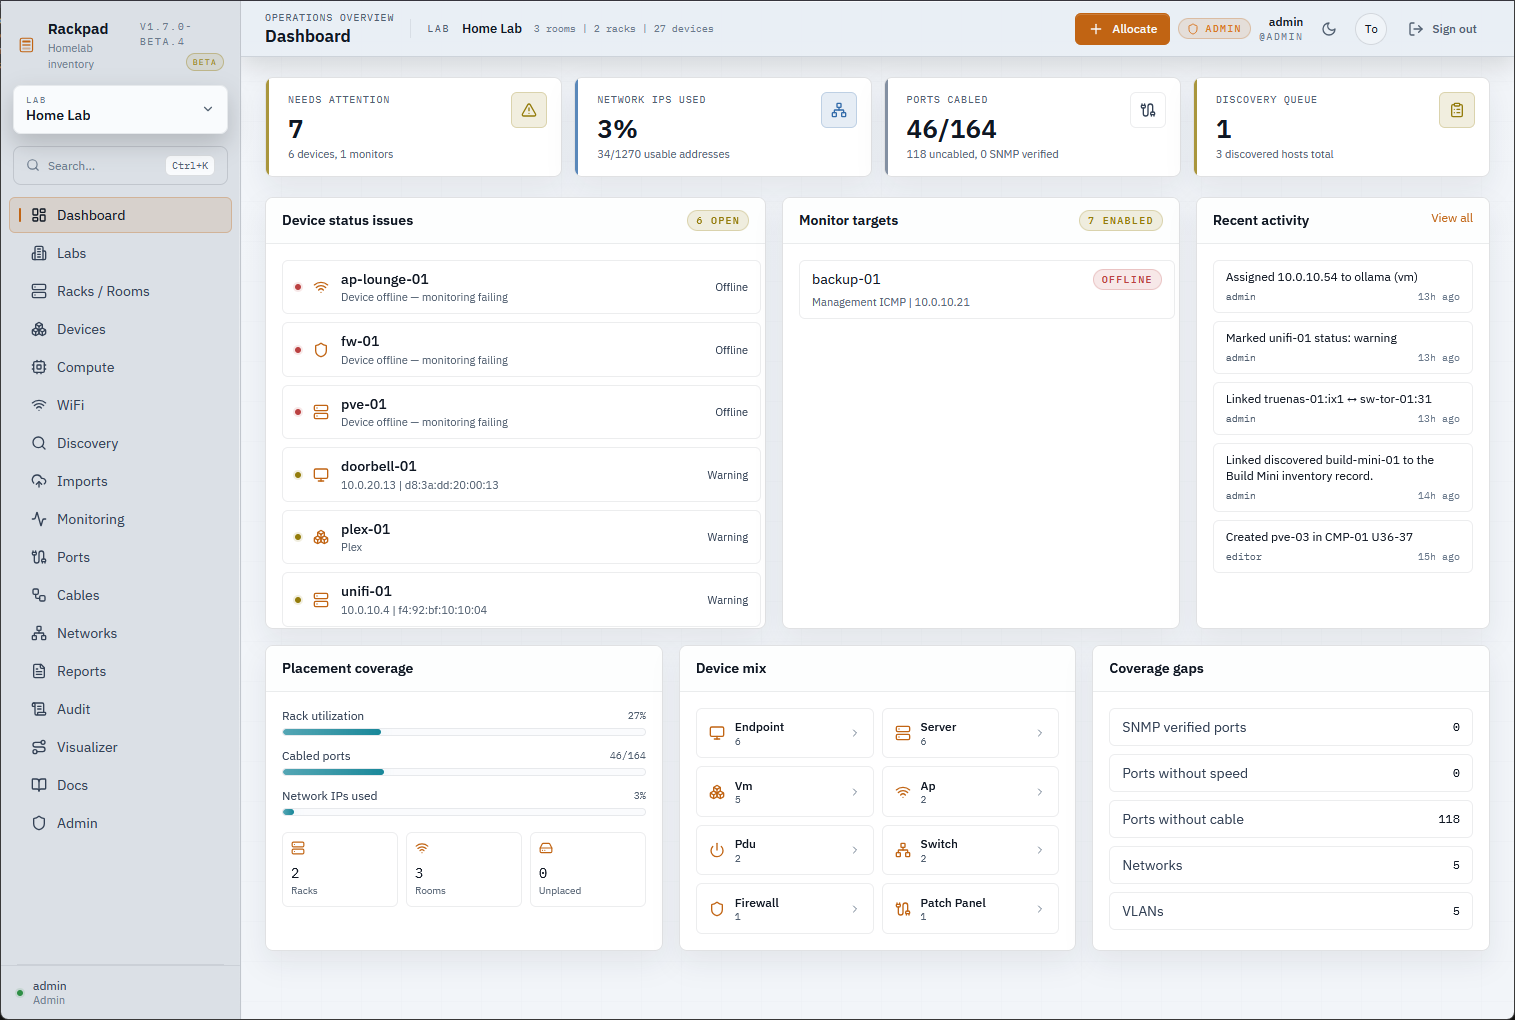
Once you get access to your RackPad instance after the initial setup, you will be taken to the RackPad dashboard. This is taken from the instance I spun up with demo data, so you can see how everything looks when information is populated.
I really like the dashboard overview that you get with RackPad. With the RackPad dashboard you get an overview of your home lab environment, including things that it has flagged as needing attention:
- Device status issues – Devices that have warning or offline statuses
- Monitor targets – Targets that you have monitored and their statuses
- Placement coverage – Things like rack utilization, cabled ports, network IPs used, etc
- Device mix status – The types of devices in your environment
- Coverage gaps – looks to identify things like ports without speed indicators, ports without cable, etc
Labs screen
In the Labs screen, you can see different labs that you have configured as separate environments. I really like this concept as it allows you to have designations for different setups or configurations that you may have for your primary lab, DR, or even something offsite.
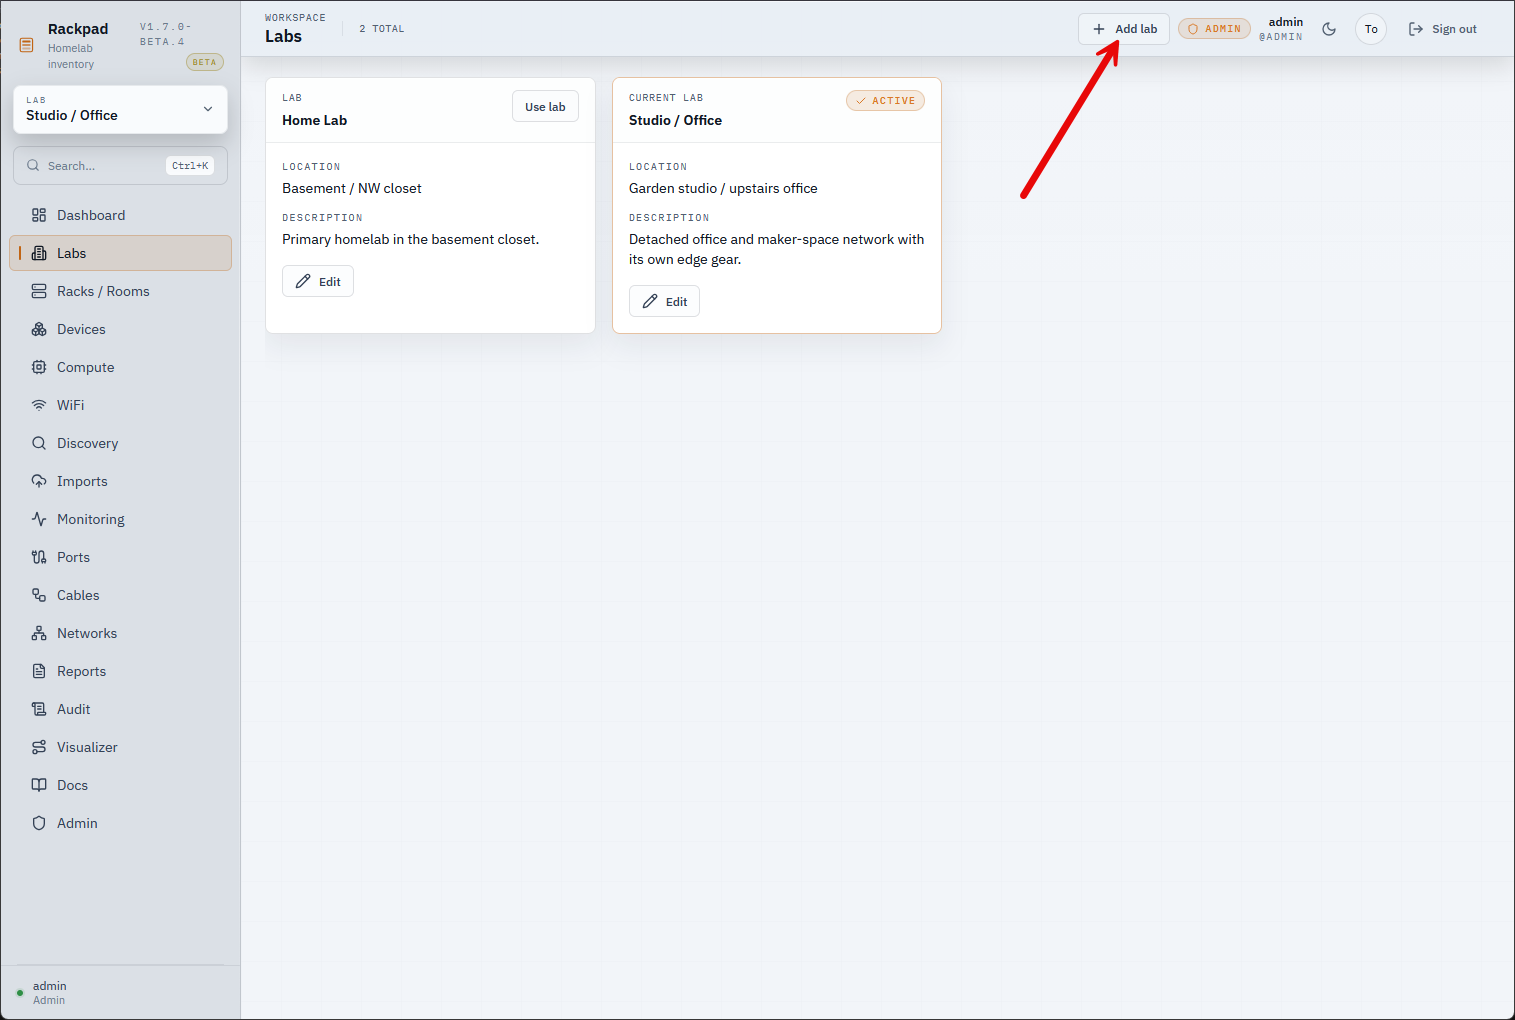
So these different tiles are different labs and then you can click the + Add Lab to add a configuration to the Labs screen. The only thing here I think that could be better is that you have the ability to choose to view one lab or the other, but not both. It would be nice to have an “All Labs” option in the dropdown to view everything in total.
Racks / Rooms screen
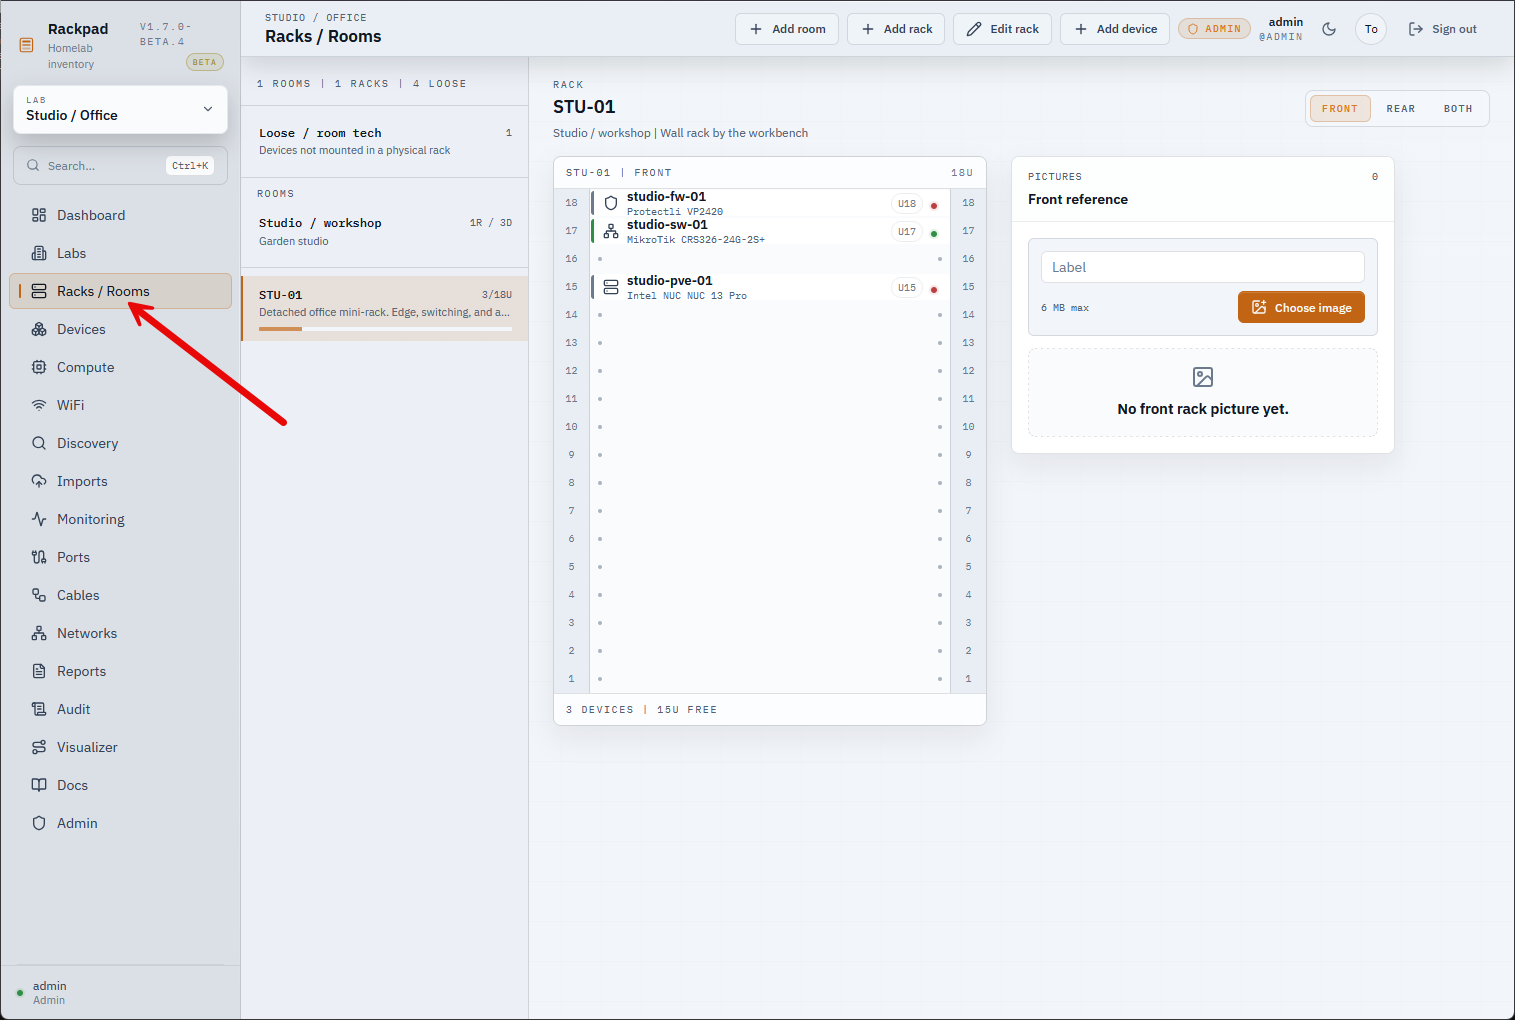
On the Racks / Rooms screen, you can add and configure racks to your RackPad config. You can include a real image of your rack along with the logical configuration and rack U designations. There is also front, rear, and both views.
Devices
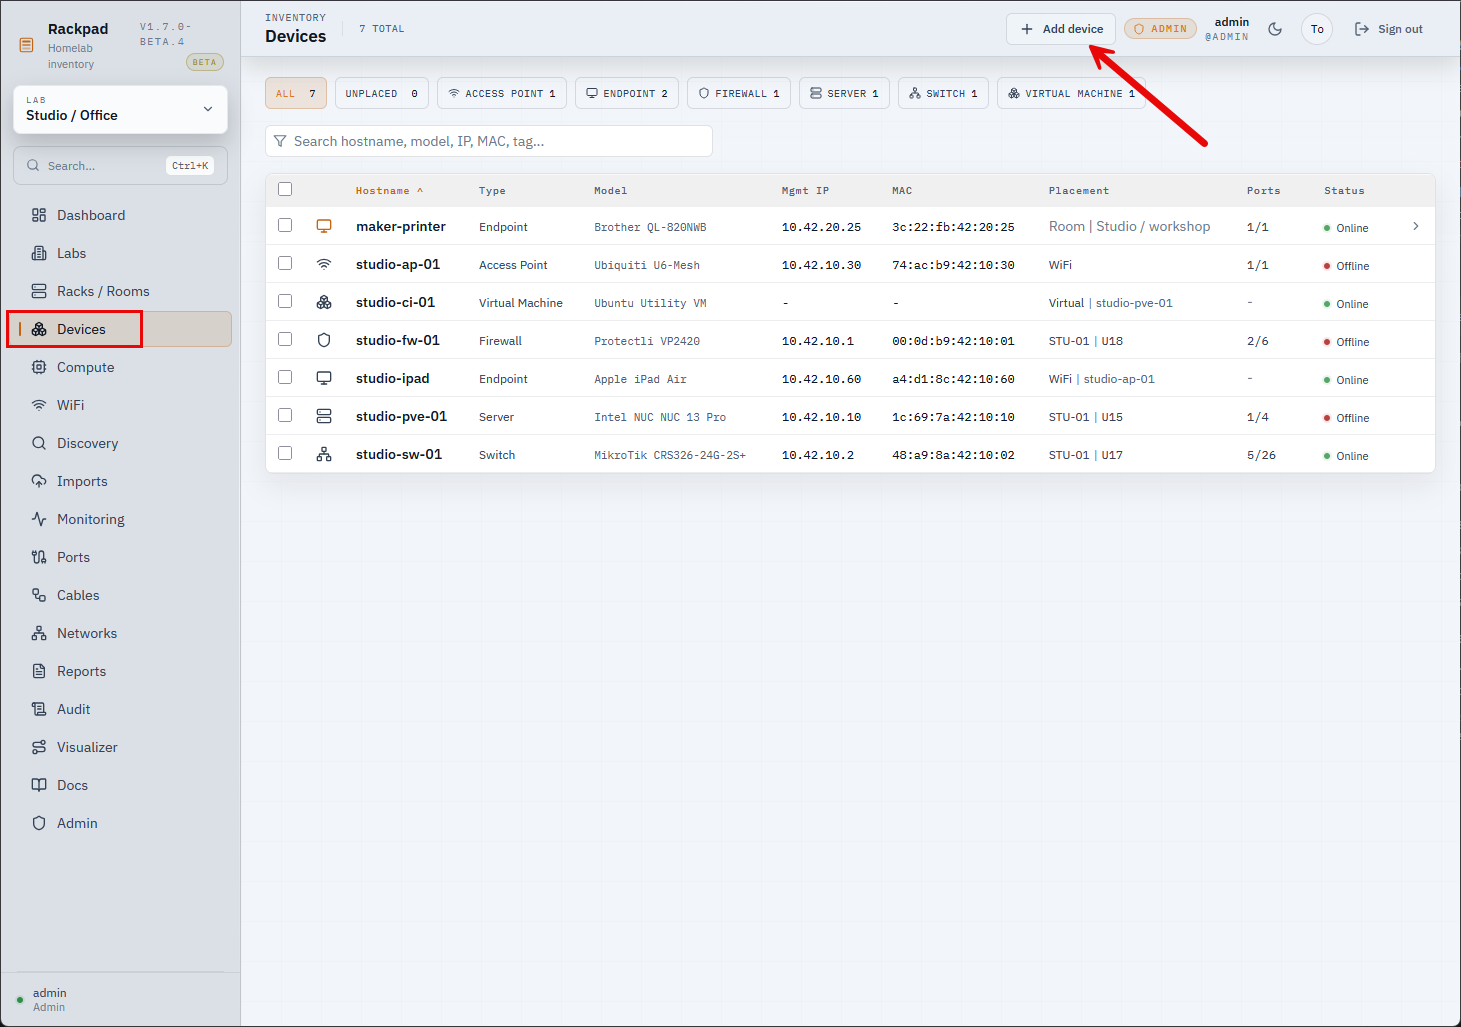
The Devices screen shows the devices that are added in the home lab we have focus on.
Compute
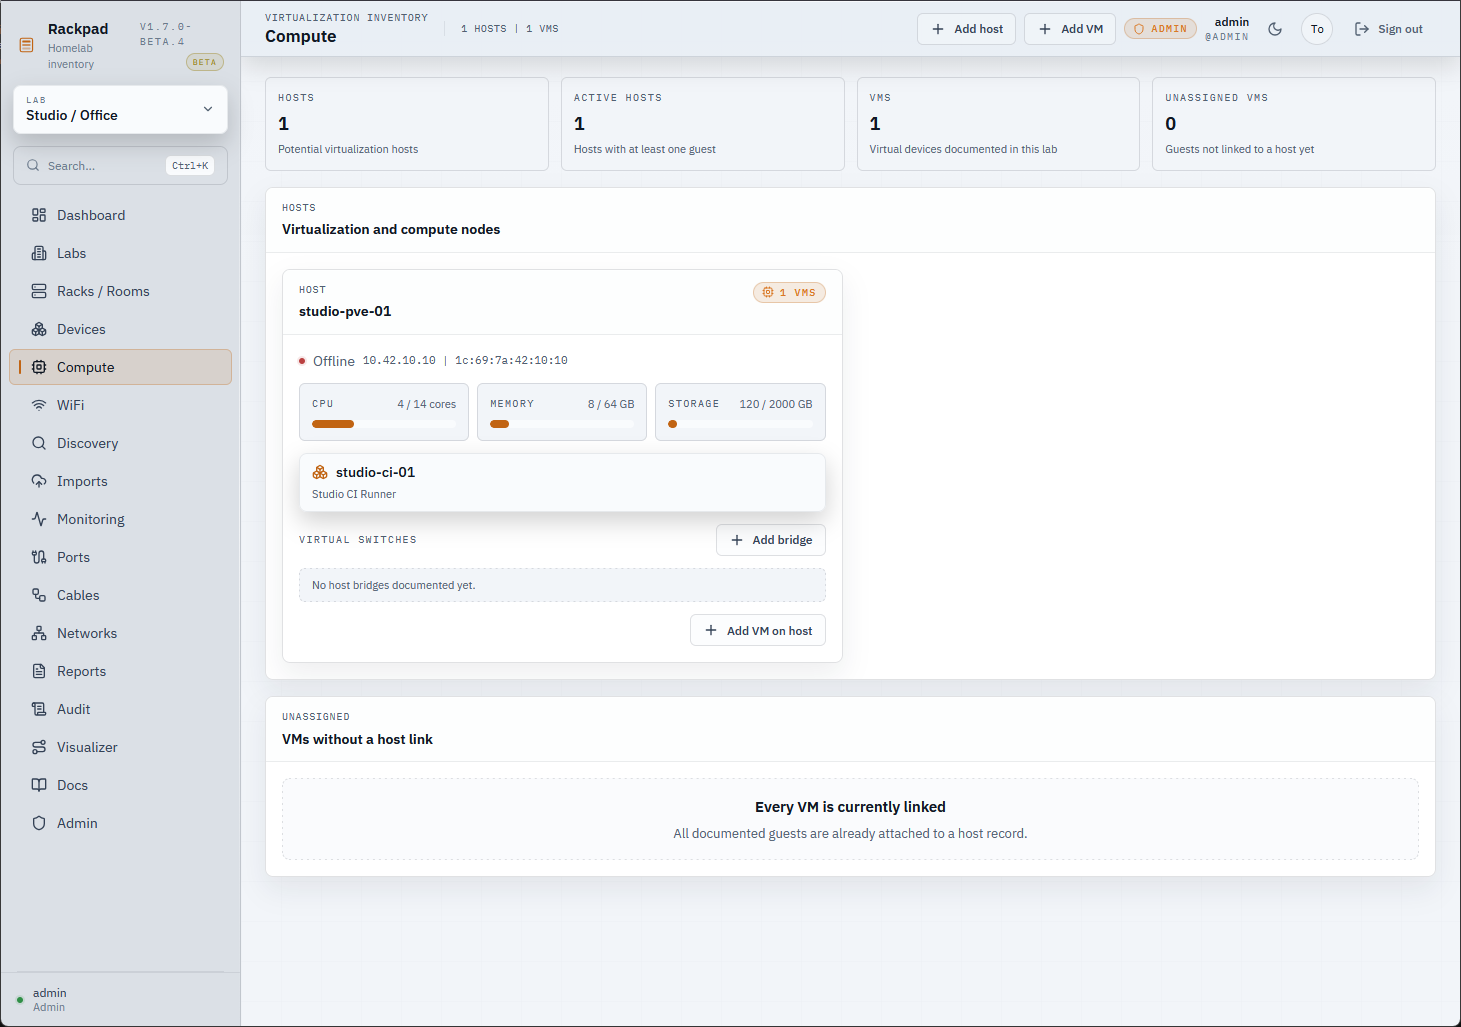
The Compute dashboard is interesting I think since it has integration with Proxmox VE Server. Most of us in the home lab these days are running Proxmox VE Server as our hypervisor of choice. You can see the RackPad shows your virtualization and compute nodes. It also pulls the list of VMs running on the host and notes whether or not the VM is linked.
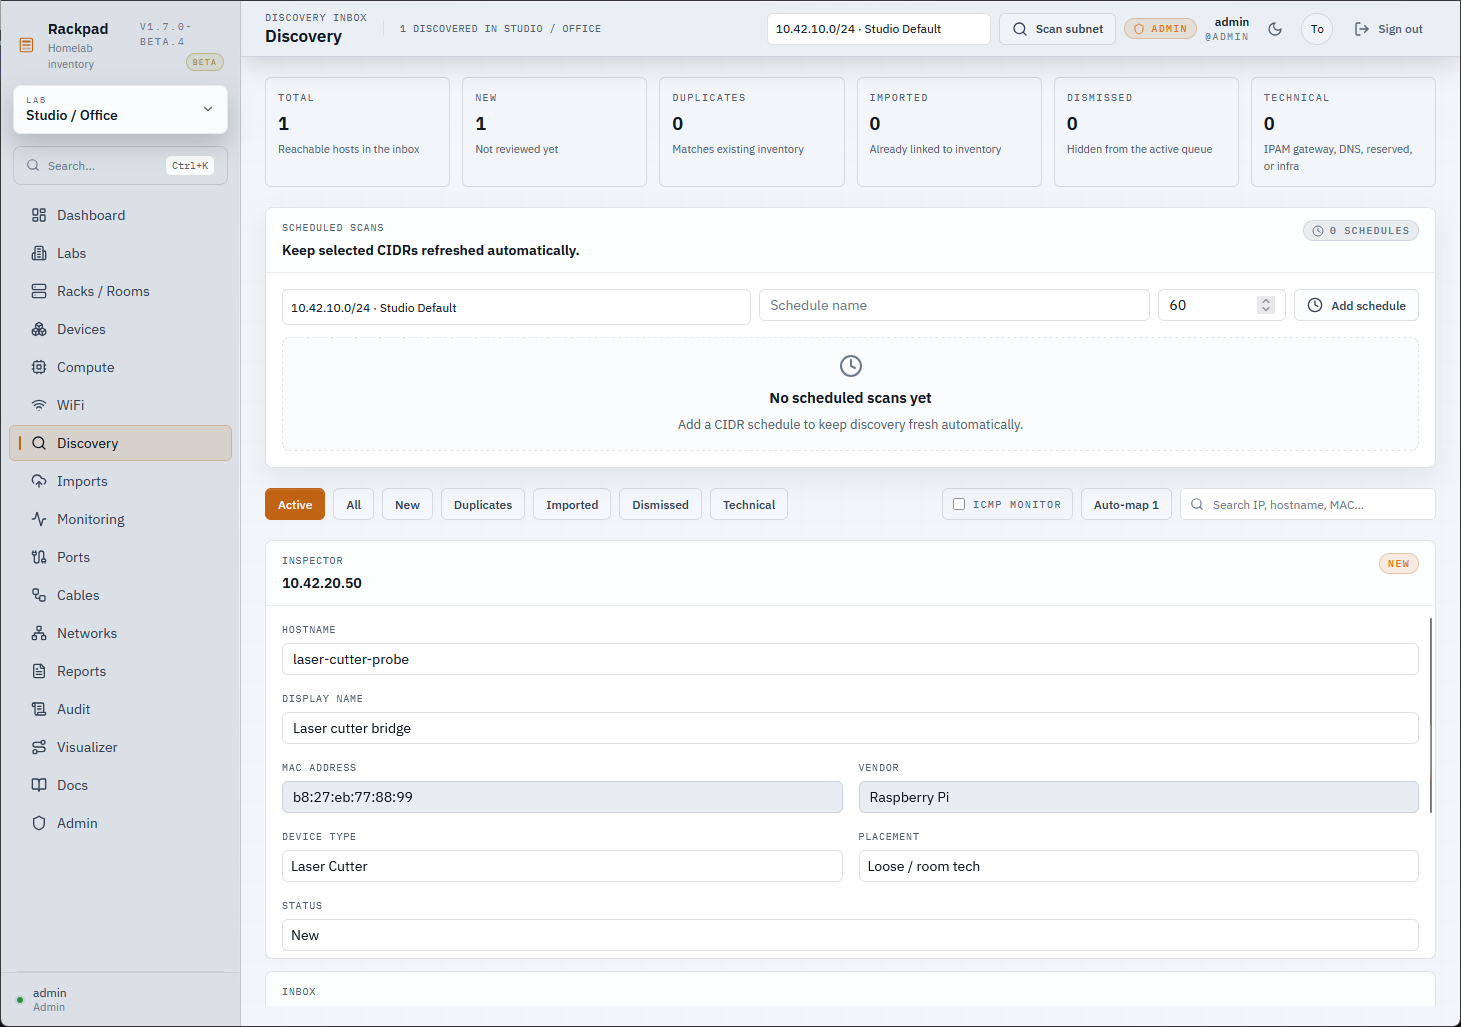
Discovery
On the Discovery screen, you can scan subnets and find devices. You can also scan your subnets to keep the list of clients and devices fresh. You can add details to resources found in the subnet. You can also gather MAC addresses as well. But to do that, note the following: MAC discovery needs layer-2 visibility. Docker bridge networking, Docker Desktop, routed VLANs, VPNs, or missing NET_RAW/CAP_NET_RAW access can hide MAC addresses from Rackpad. On Linux or Proxmox LXC installs, use the host-discovery compose variant or run Rackpad with host networking plus NET_RAW/NET_ADMIN.
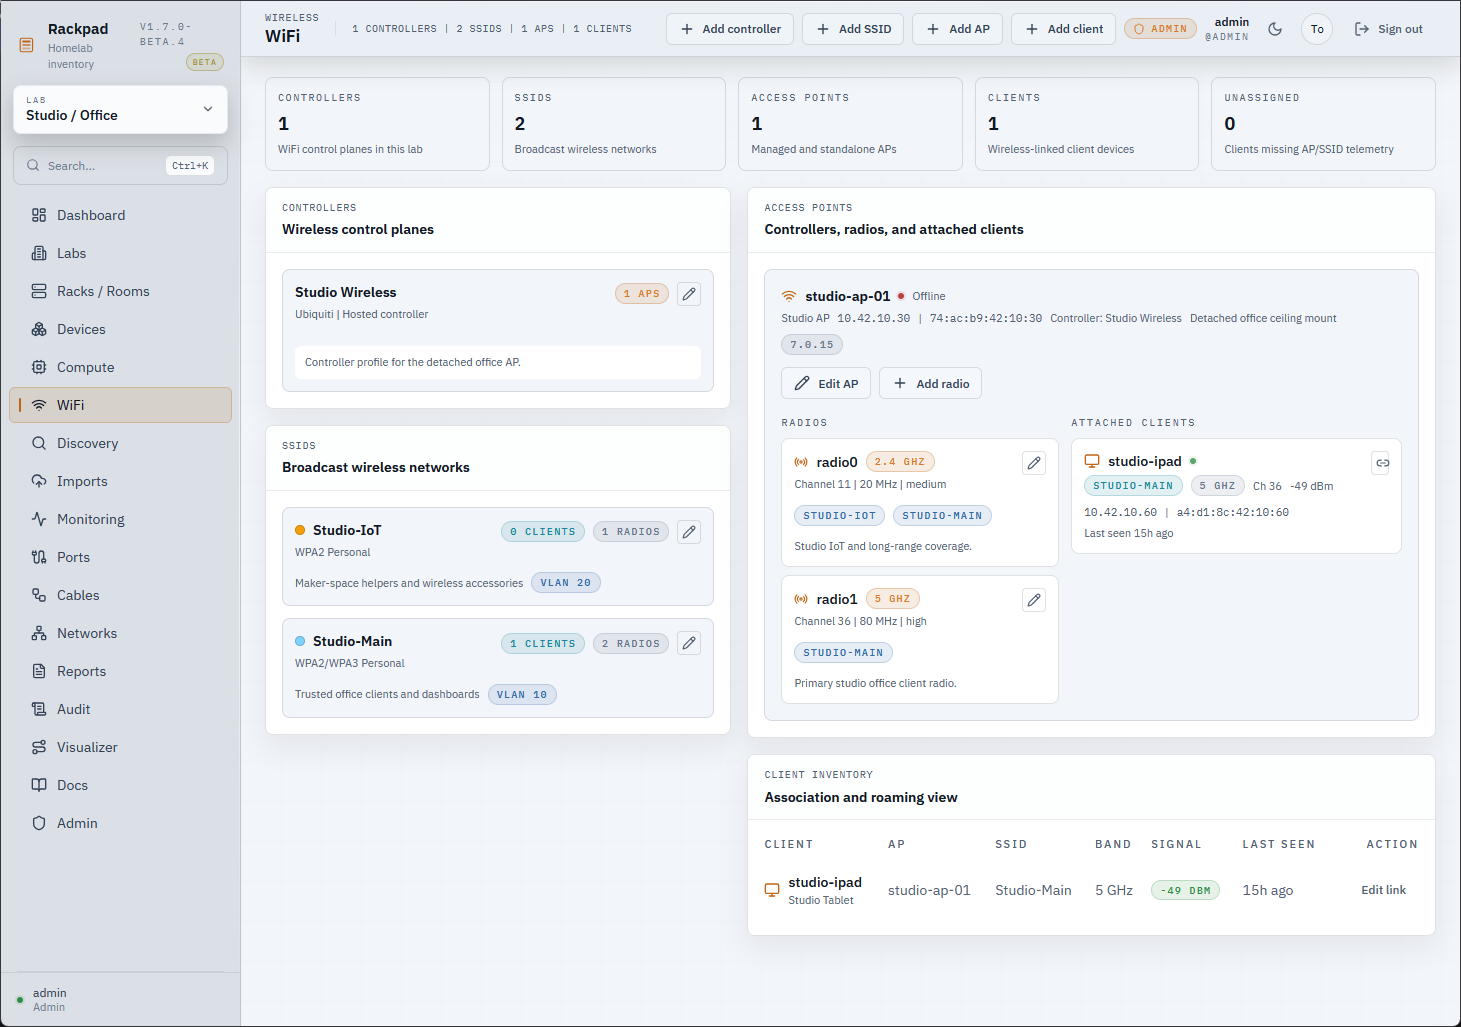
WiFi
On the WiFi screen, you get a lot of information that can be gathered and customized for wireless resources in your home lab environment. These include your controllers, SSIDs, access points, clients, radios, associations and roaming views.
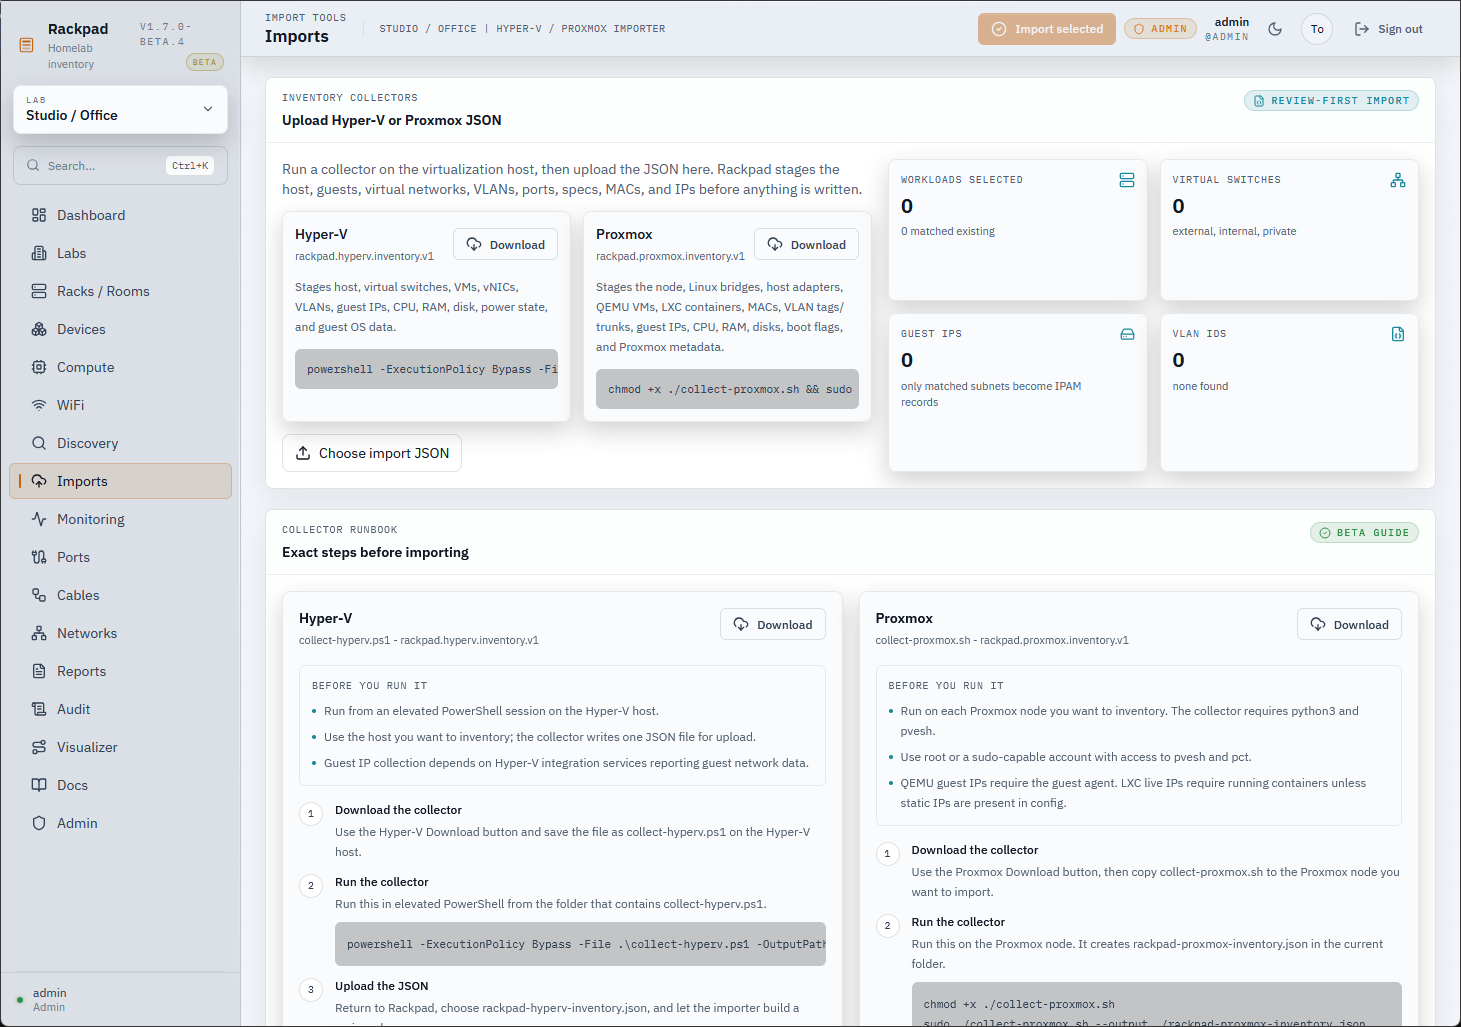
Imports
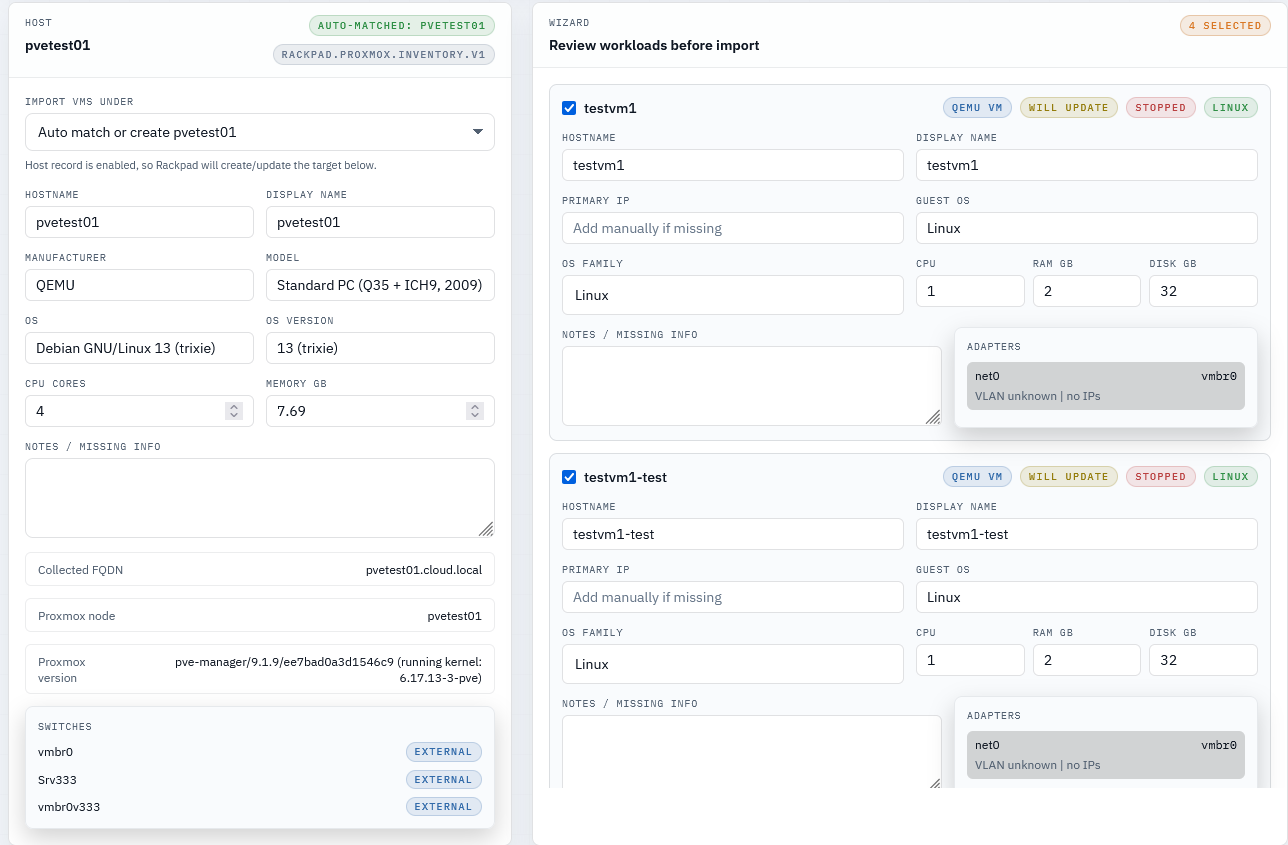
The imports screen is interesting as well. Here you can run a collector on the virtualization host. This gets JSON that you can upload. Rackpad stages the host, guests, virtual networks, VLANs, ports, MACs, and IP addressses.
For Proxox specifically, this includes:
- Linux bridges
- host adapters
- QEMU VMs
- LXC containers
- MACs
- VLAN tags, trunks
- guest IPs
- CPU
- RAM
- disks
- Boot flags
- Proxmox metadata
Below, I have downloaded the collect-proxmox.sh file from Rackpad, uploaded to my Proxmox VE Server host in the home lab and ran the script.

Monitoring
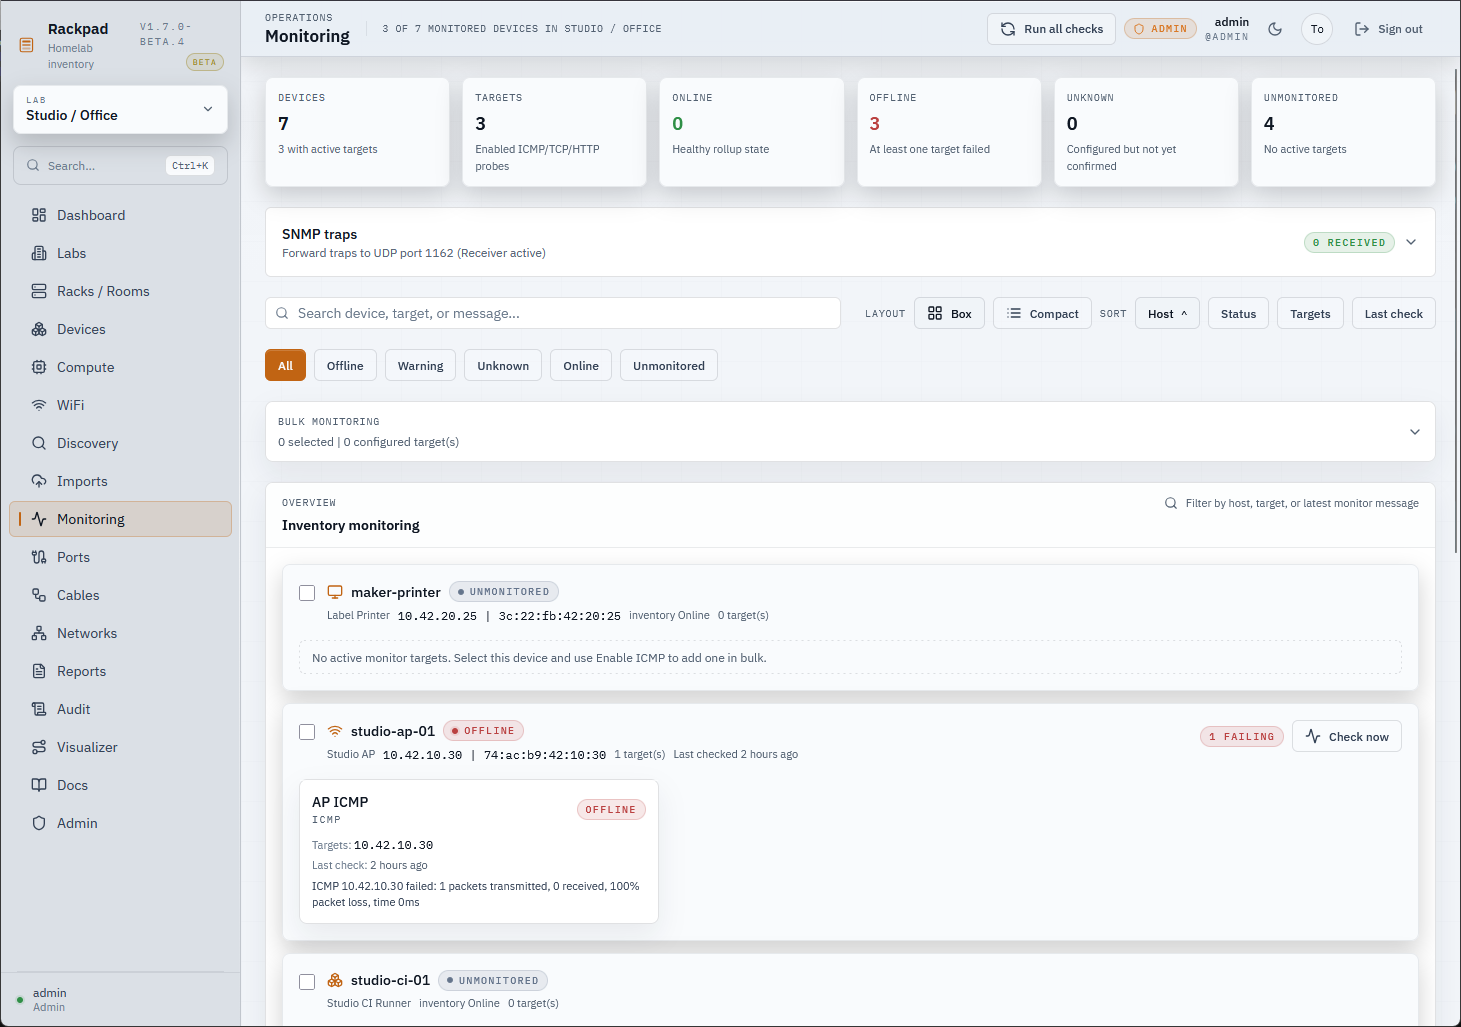
The monitoring screen allows you to configure various checks on your devices and endpoints, including SNMP traps, and inventory monitoring with ICMP.
Ports
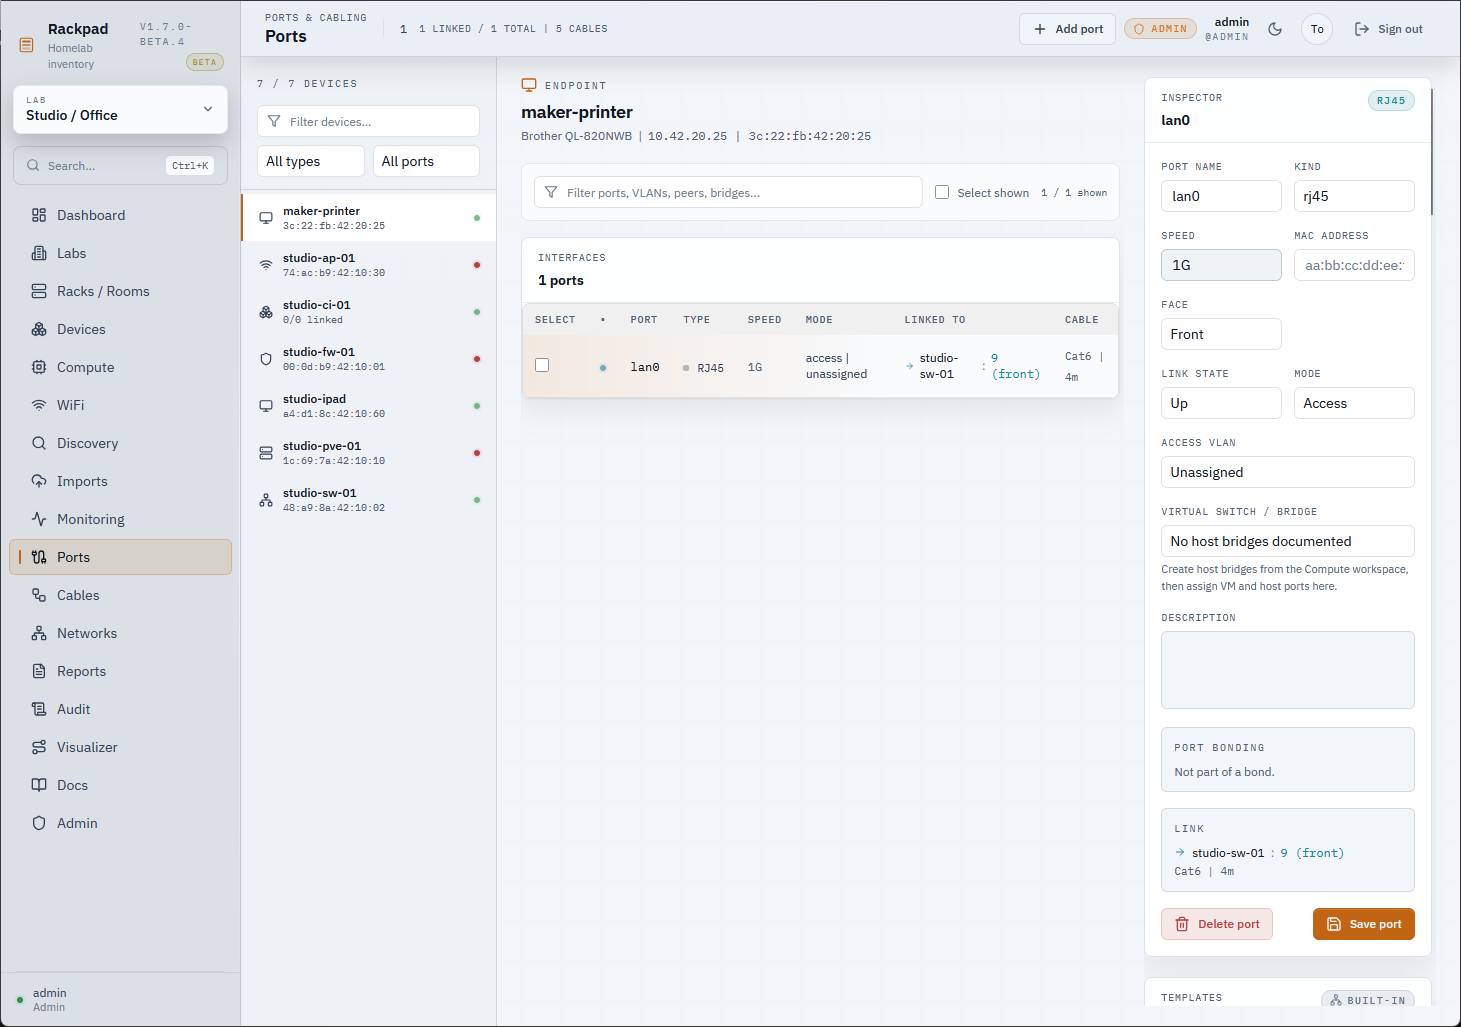
The ports screen gets pretty granular. You can configure and document each individual port in your home lab network. You can record things like port name, the kind of port, speed of the port, mac address, link state, etc.
Cables
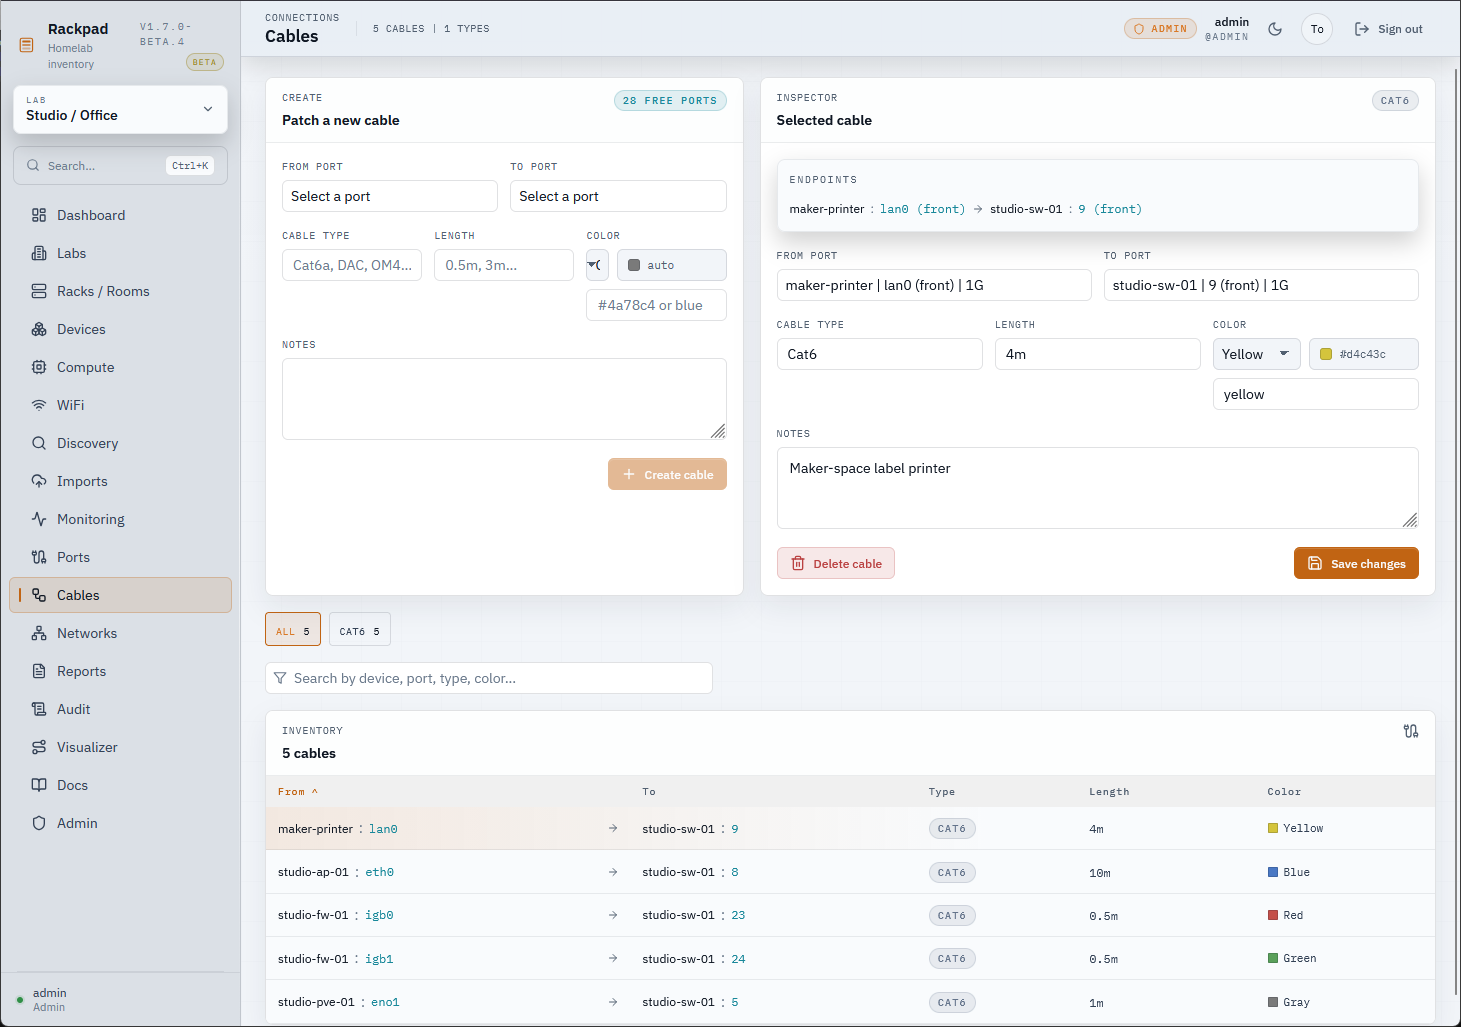
On the cables screen, you can record cables to various devices, type of cable, length, and color used.
Networks
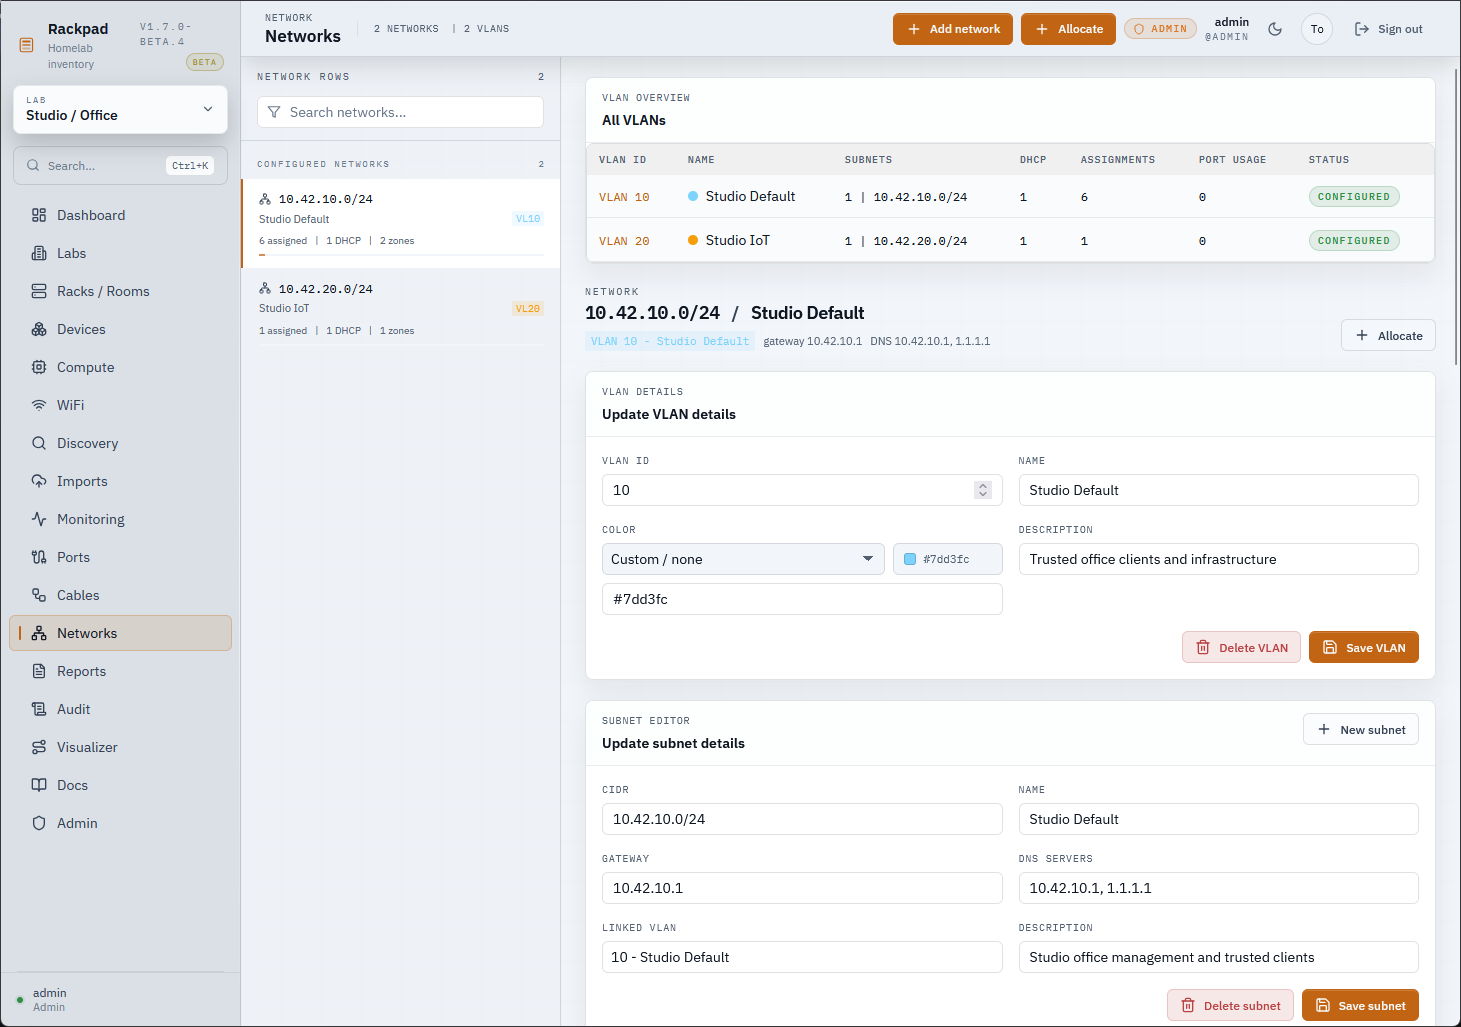
The networks screen allows you to record your home lab networks that you are running. Here you can also attach the network to a VLAN. The networks found here are the ones that you are able to run scans against in the Discovery screen.
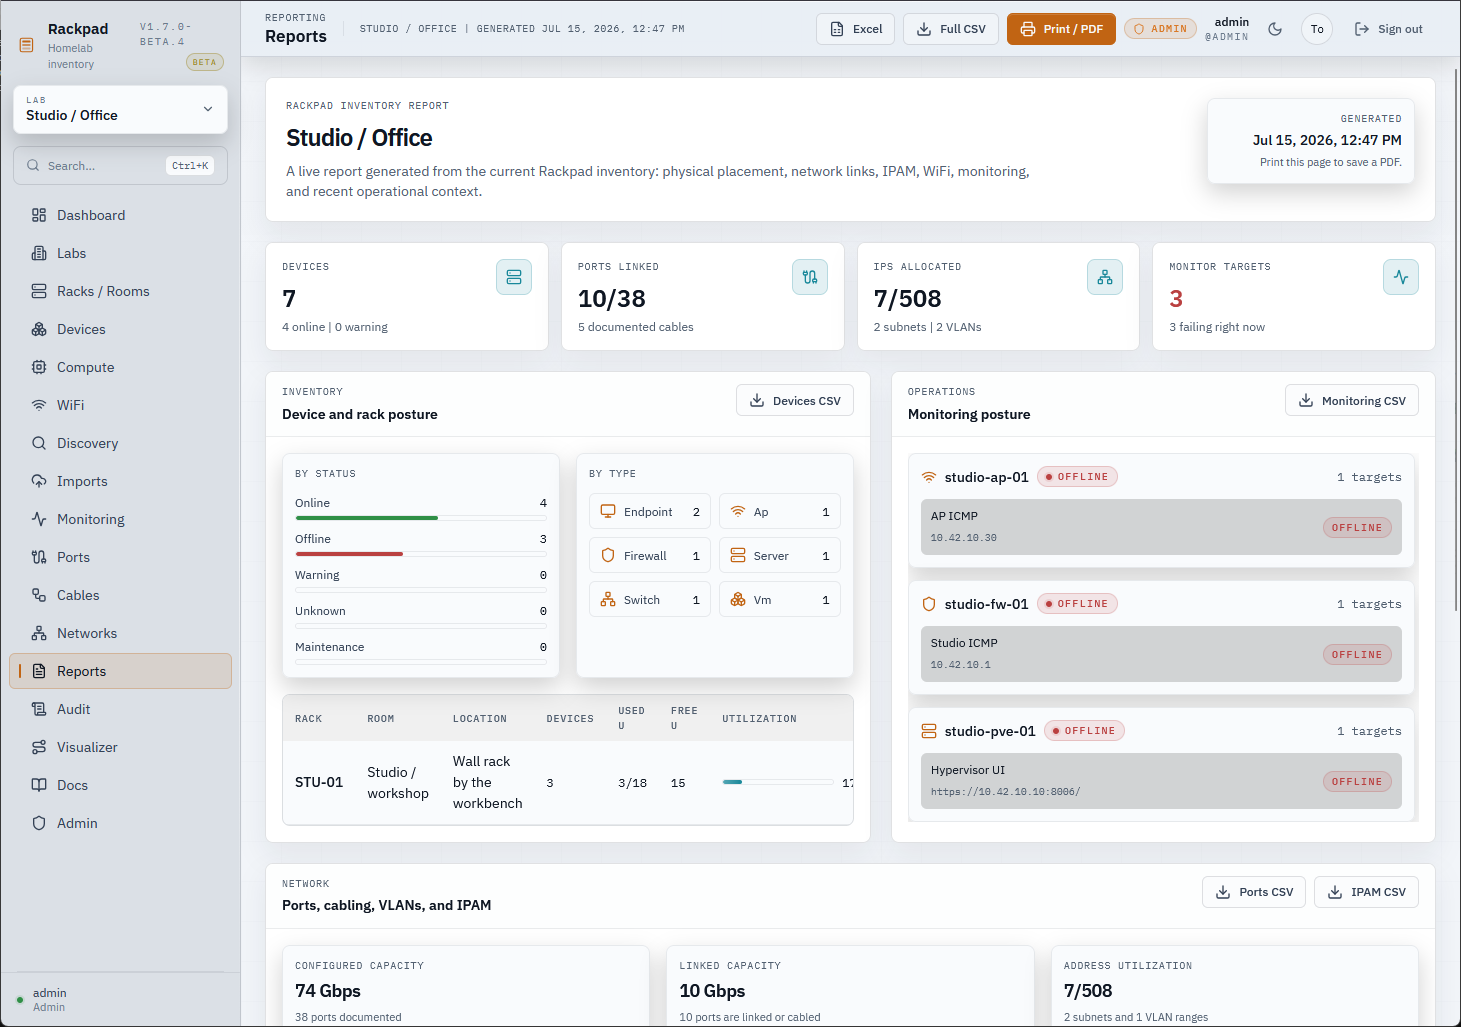
Reports
The reports screen lets you export and print reports in PDF, CSV, or other formats like Excel. This gives you a great overview report of your environment.
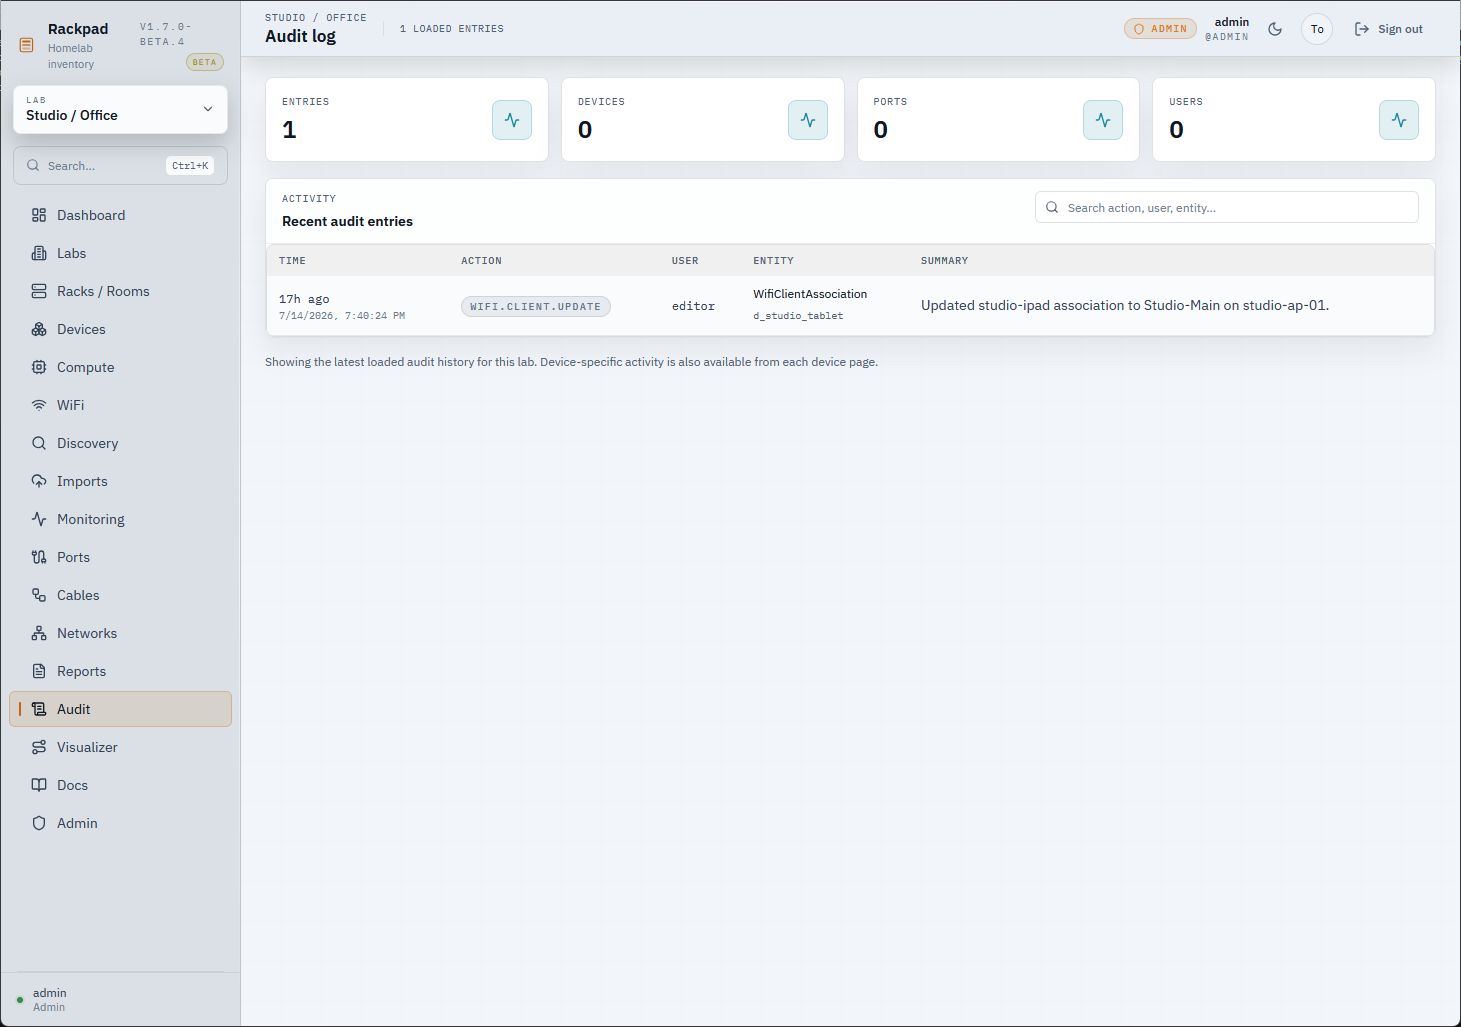
Audit logging
On the audit logging screen you can audit activities and record things done inside the solution and know who did what.
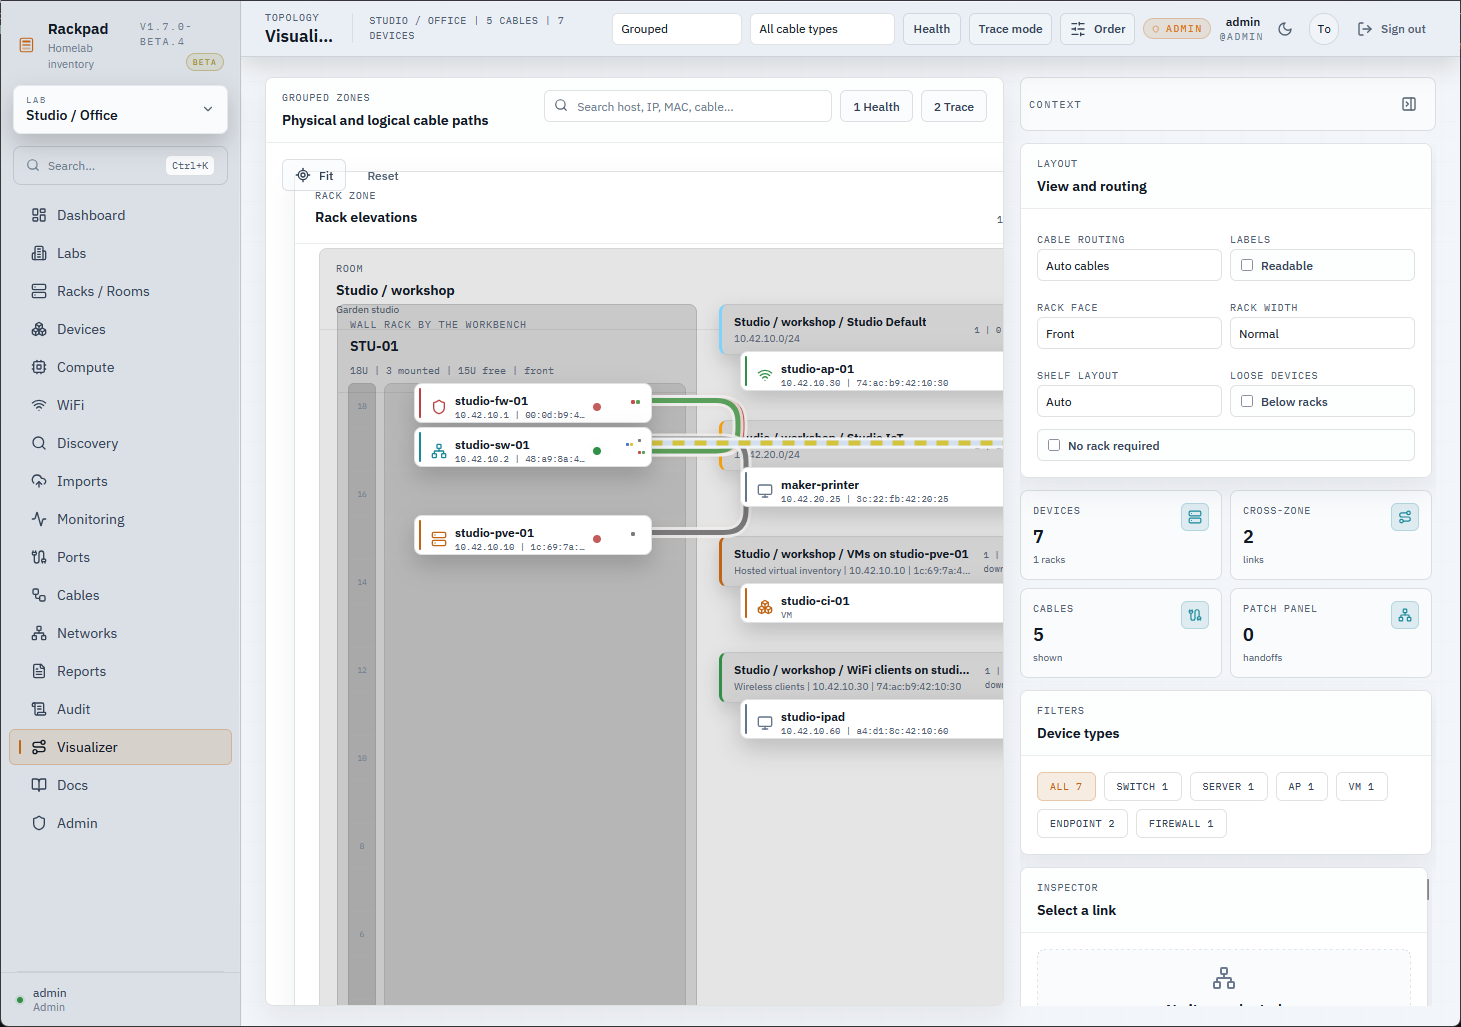
Visualizer
The RackPad Visualizer is one of the coolest dashboards as part of RackPad. You can see it in the static image below, but it gives you visualizations of the packet flows over the cables and to and from which devices on this screen.
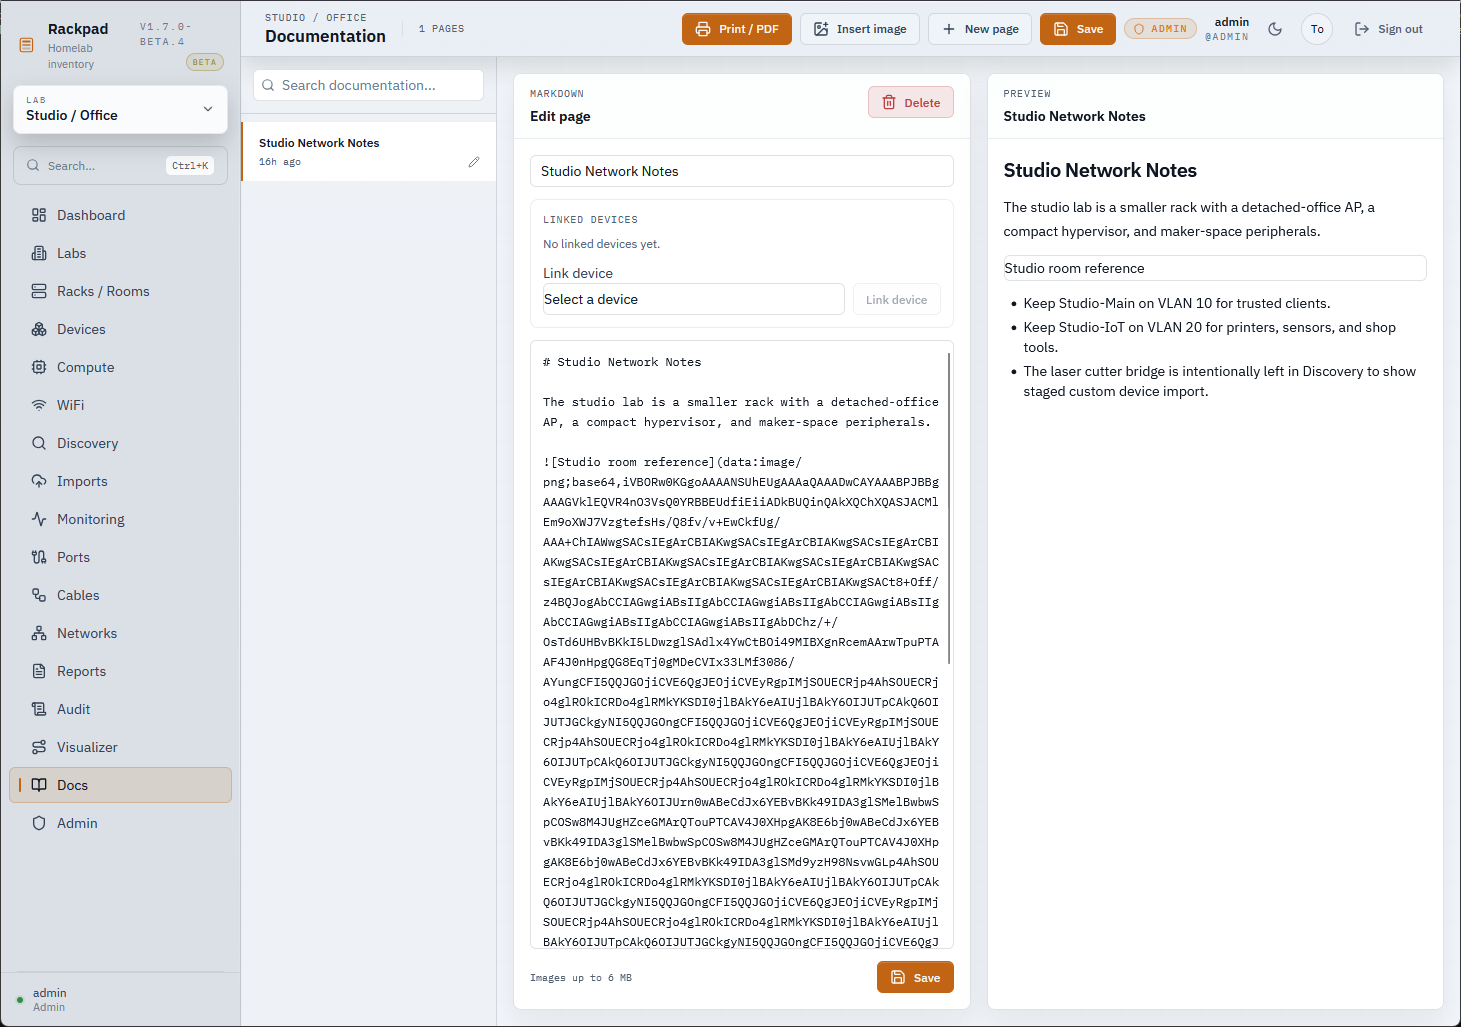
Docs
Another nice touch with the solution is the Docs screen. On the Docs screen you can create runbooks and other documentation on your home lab environment. You can add pages, upload images, print, and export to PDF from here.
Where I’d like to see it continue growing
This looks like it is a great project to start out with. I think it encapsulates a lot of what we like to have in our home lab documentation and operations toolsets. But, like any tool out there, there is still a lot of room for continued development and growth. I would like to see deeper and “automated” integrations with solutions like Proxmox VE Server.
It is great that we can export data from Proxmox using the export script provided, but this is all a manual process. It would be great to see the tool gather this information using the Proxmox API instead. This way it would be automated and there wouldn’t be any “sneakernetting” of files between hosts and systems. Integrations with Home Assistant and other tools would be welcomed as well.
The project looks to be actively developed at the moment so hopefully the momentum will continue and additional features and capabilities will be added.
Wrapping up
RackPad is a solution that I will definitely be keeping an eye on and adding to the list of “watching” projects. I love these little tools like this where an idea meets real world needs in the home lab and tools can be built to solve the problems that we are facing. The developer has done a good job encapsulating a lot of the pain points in the various screens where you can gather various types of information, including hardware, network information, Proxmox environments, virtual machines, Docker, etc. How about you? Is this a solution you have tried out in your home lab? I would love to know down in the comments.
More in this topic



Google is updating how articles are shown. Don’t miss our leading home lab and tech content, written by humans, by setting Virtualization Howto as a preferred source.
About The Author