Whenever you are troubleshooting network issues at a very deep level or trying to troubleshoot advanced or complex issues in the environment, you will always see mention of a packet capture to get to the bottom of issues. Wireshark has historically been the tool that everyone uses for their go-to packet analysis for years and it still is one of the most powerful utilities available out there for understanding what exactly is going on in the network. I still use Wireshark regularly as there are situations where nothing else provides the level of detail that Wireshark offers. However, I stumbled onto a different tool that I found myself opening first before Wireshark. That tool is Sniffnet. When I first came across it, I thought it would just be another lightweight network monitoring tool, but it turned out to be more than that. This is now the first app that I launch to see what is happening on the network. Let’s take a look at why.
What is Sniffnet?
Sniffnet is an open-source network monitoring and packet inspection tool that is designed to be a much more intuitive and easier way to gather network statistics. It is licensed under both the MIT and Apache 2.0 license for use. So, while Wireshark is a very technical tool, Sniffnet is also technical but focuses more on the user experience.
One of the first things you will notice once you start using Sniffnet is that the information feels useable and consumable in a way that you really don’t get when you first start using Wireshark without understanding filtering. It is openly developed for Windows, Linux, and macOS.
What information do you get with one of the Sniffnet captures? You get the following:
- Active network connections
- Network hosts
- Protocol usage
- Traffic statistics
- Geographic connection data
- Packet filtering
- Bandwidth utilization
- Service identification
The interface stood out to me in that it automatically feels modern out of the gate. Many network tools still look and feel like utilities from twenty years ago, including Wireshark in my honest opinion. Sniffnet on the other hand looks like an application built for today’s systems and users.
Installing Sniffnet in your home lab network
Installation of Sniffnet is super easy and intuitive. It is basically the same “next, next, finish” type process that we are used to with other applications. I installed this on a Windows workstation and the process was super easy. Linux and macOS are very similar as well.
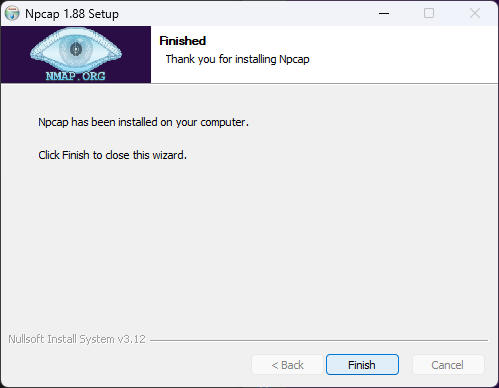
Below is a screenshot of finalizing the install of Sniffnet. As it notes, you will need to install Npcap utility as well for packet captures.
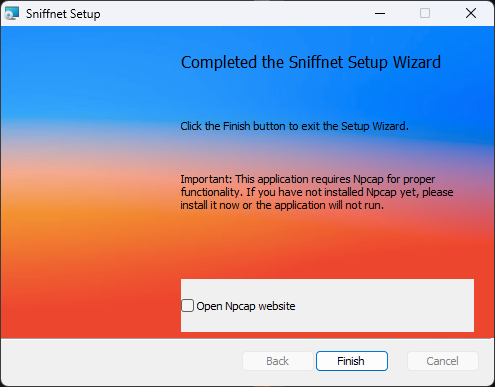
After being taken to the website by clicking the Open Npcap websitet checkbox above, I installed Npcap and rebooted the workstation.
Launching the Sniffnet interface
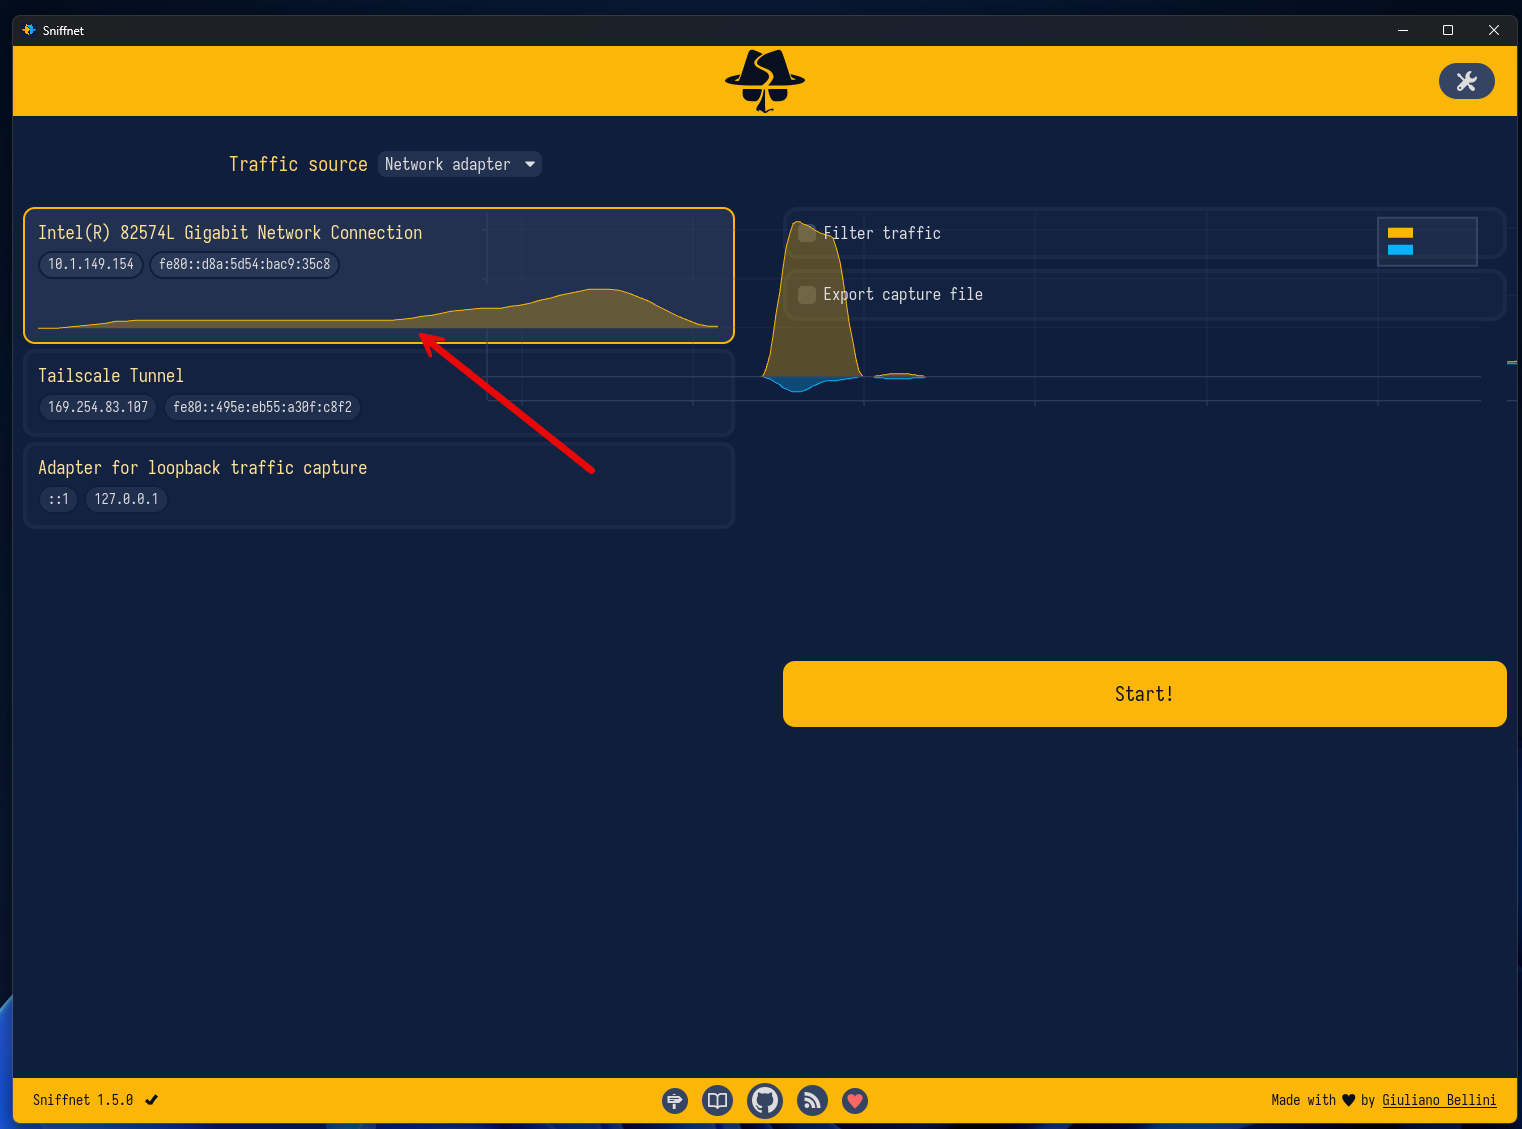
After you get it installed, launch the Sniffnet interface, and choose the network interface you want to use for your packet captures and then click Start.
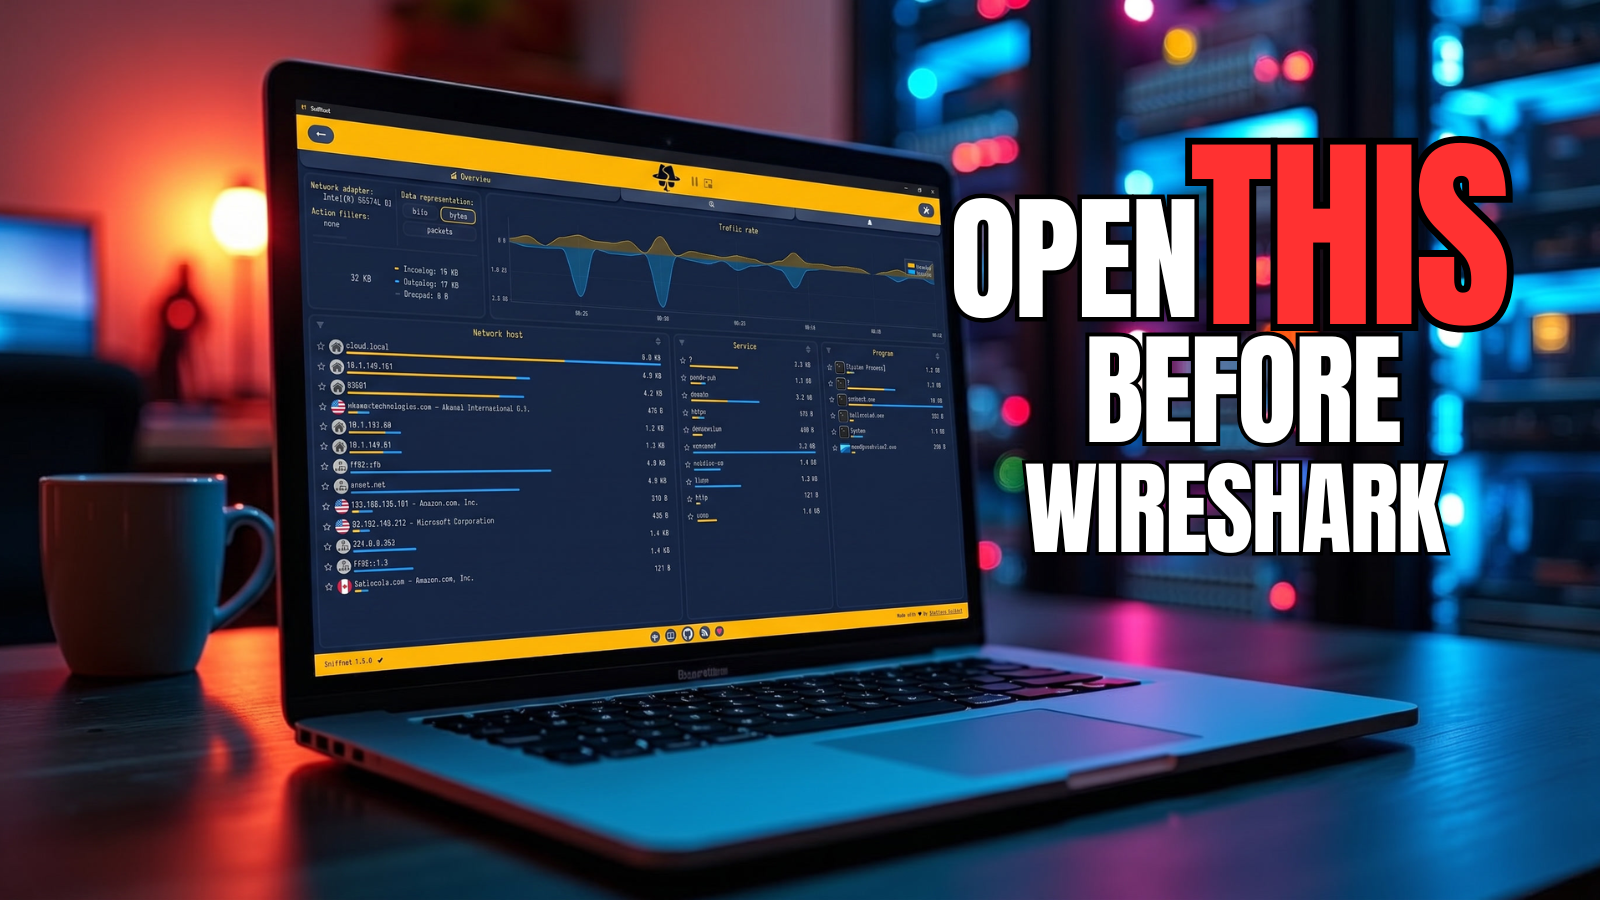
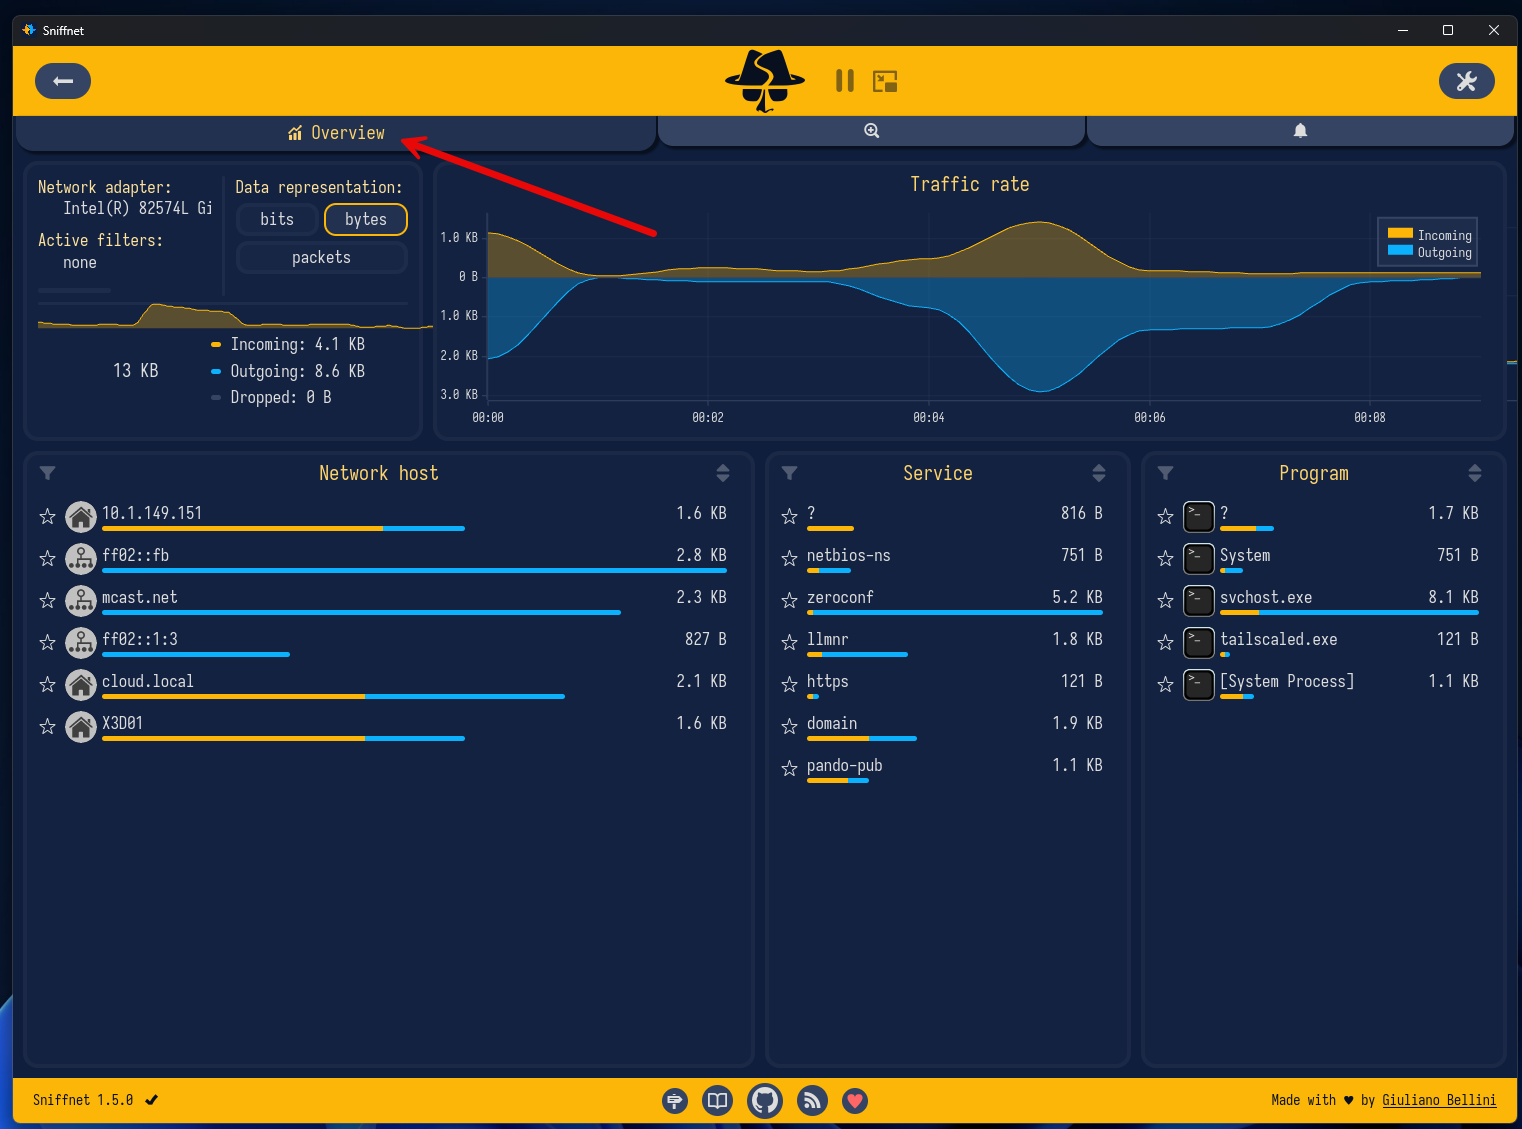
The packet capture screen will default you into the Overview screen which I found to be a great “overview” of your network traffic. You can see data representation, traffic rate, incoming, outgoing, dropped, network hosts, services, and programs.
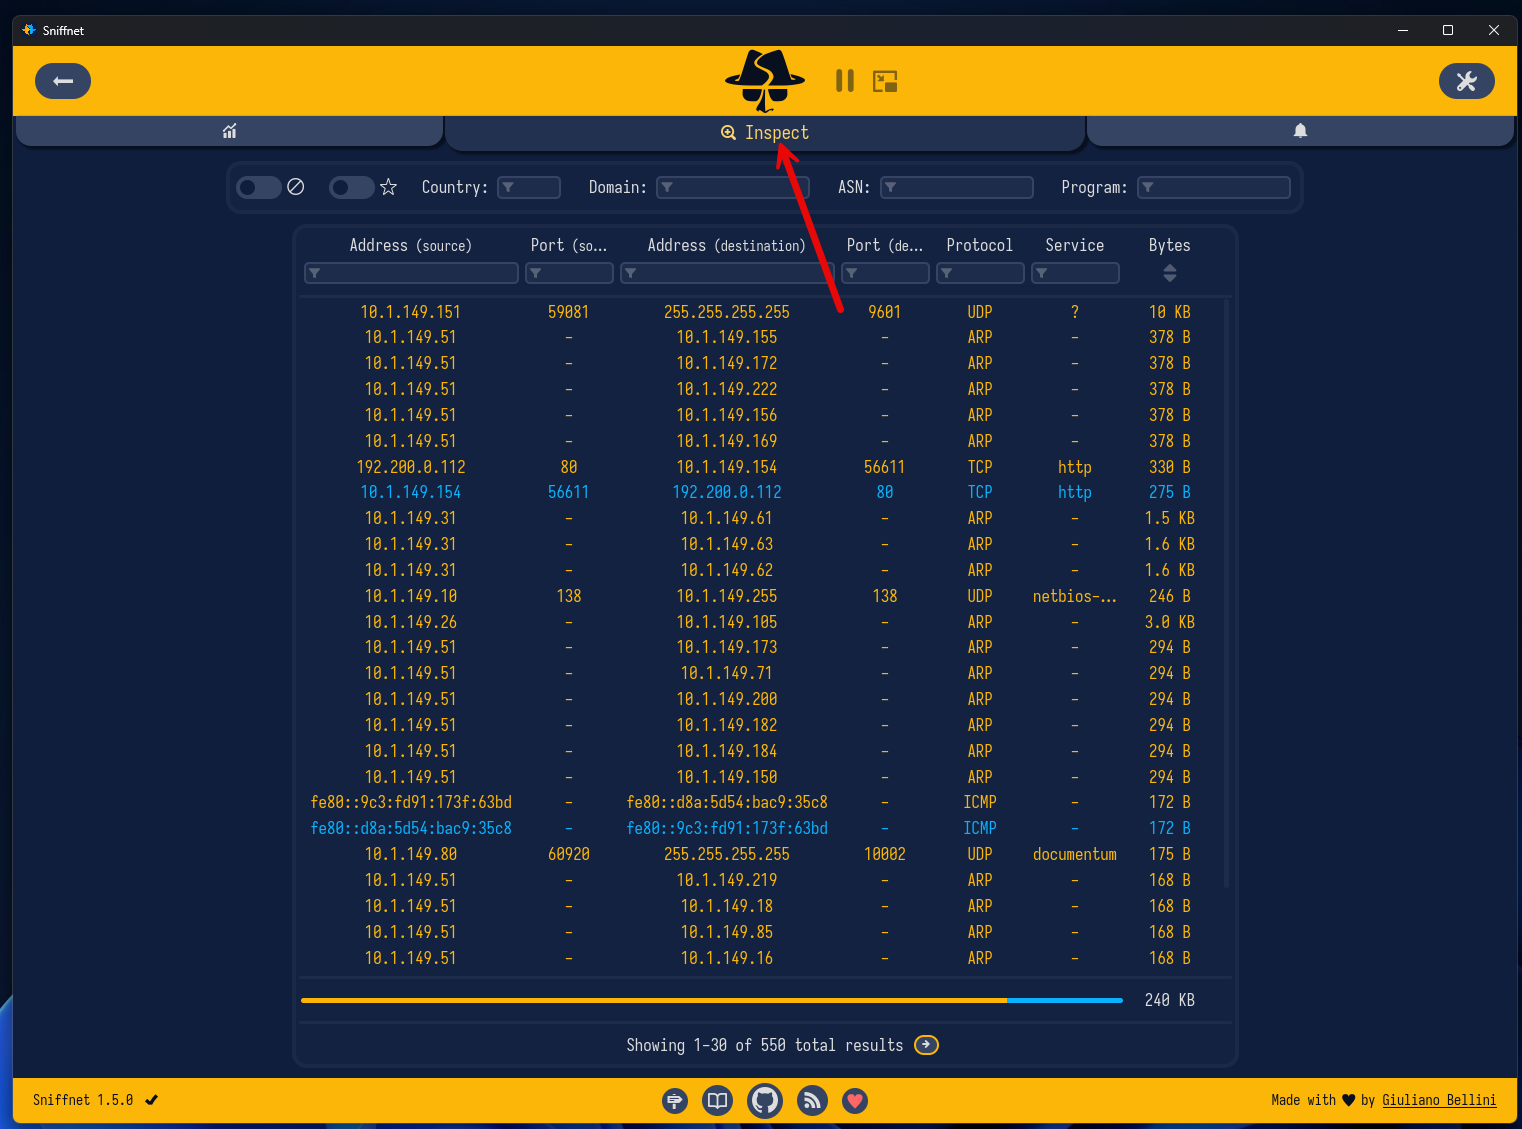
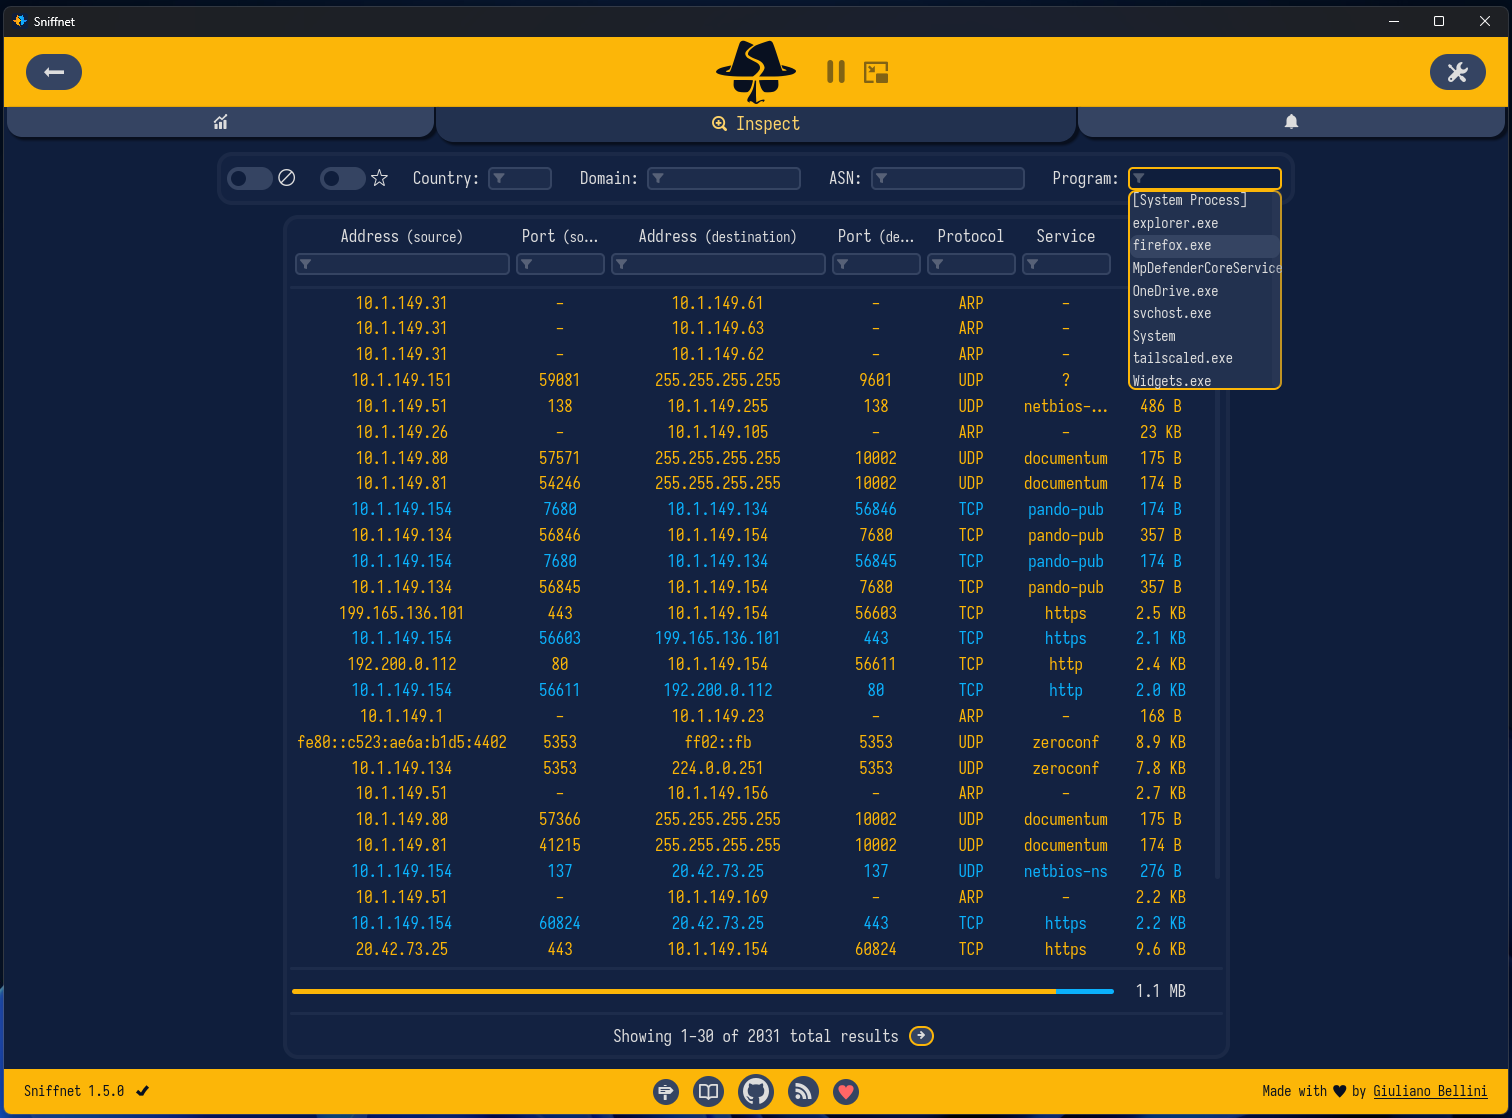
On the Inspect screen, here you see a view that can be drilled into with even more detail and you can see the ability to filter and select various network traffic.
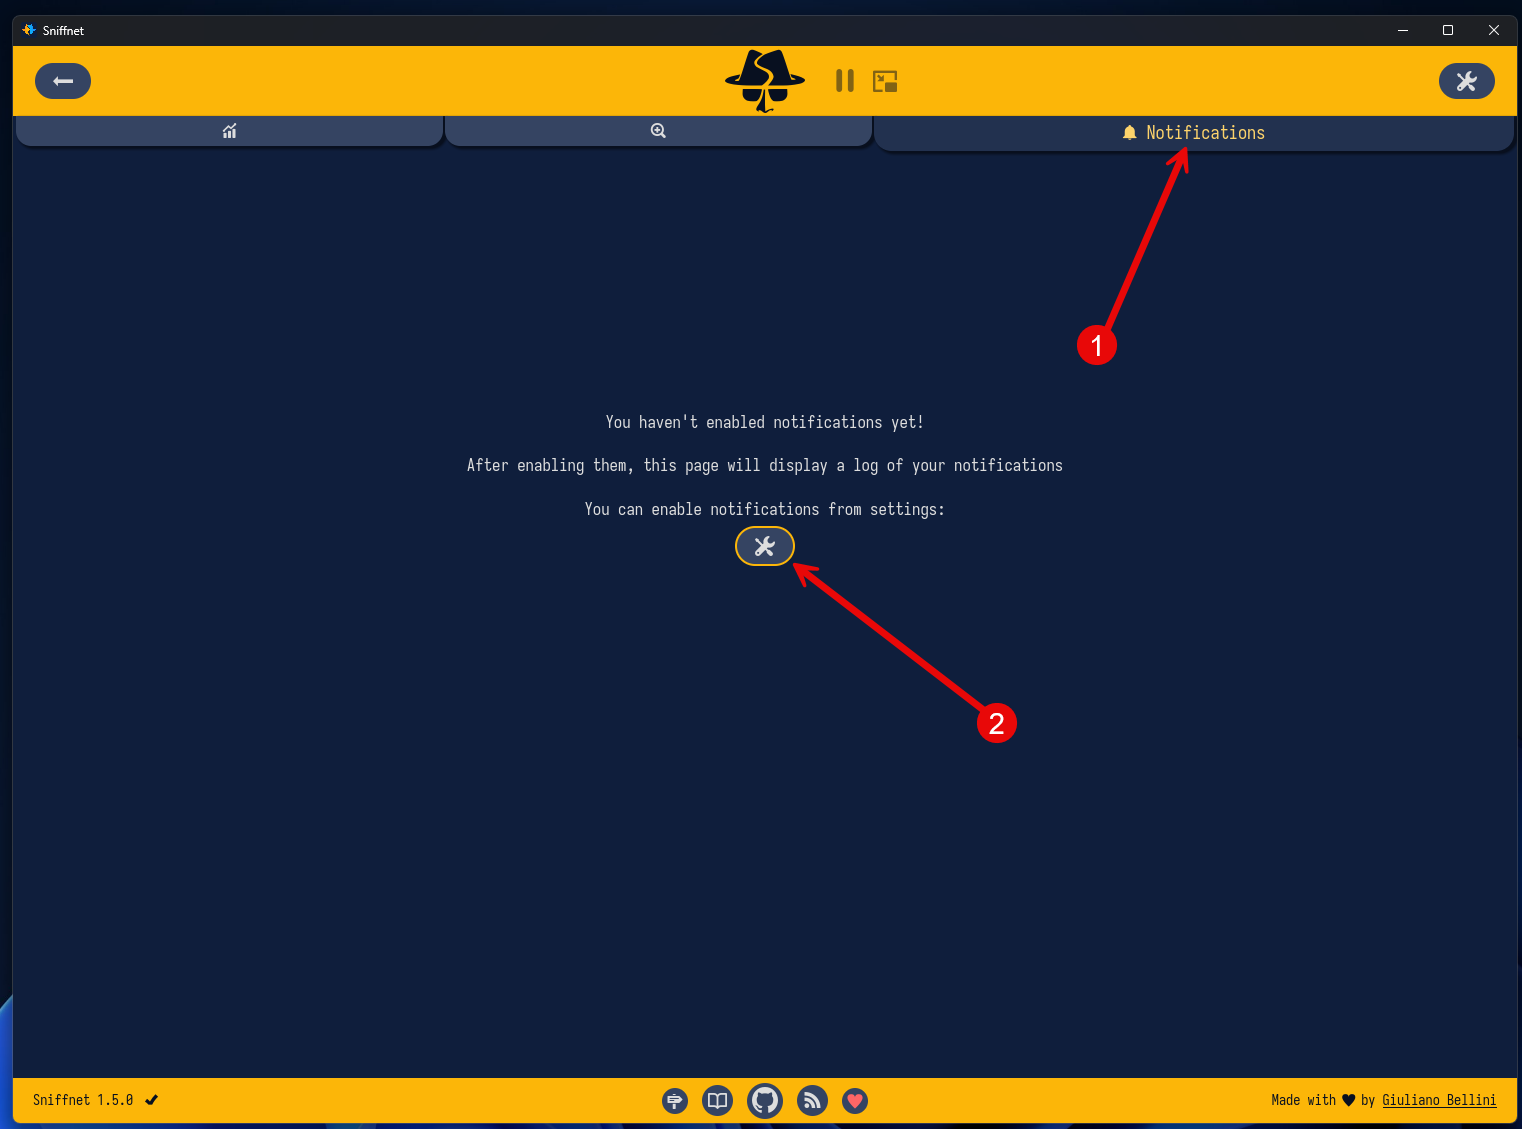
On the last tab, we have the Notification tab, where we can setup notifications to sound when various traffic types are seen.
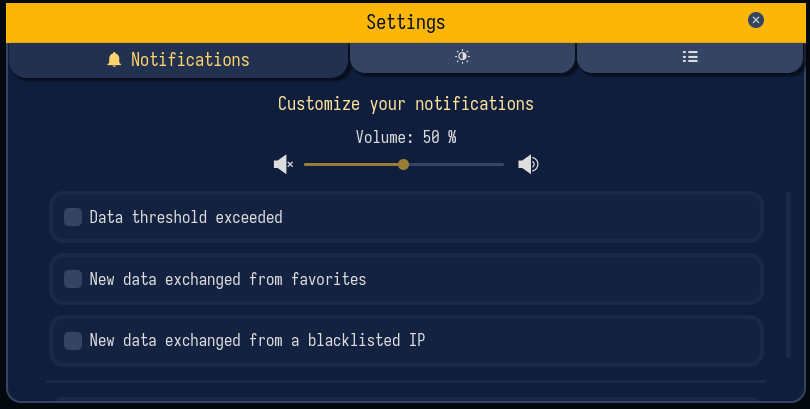
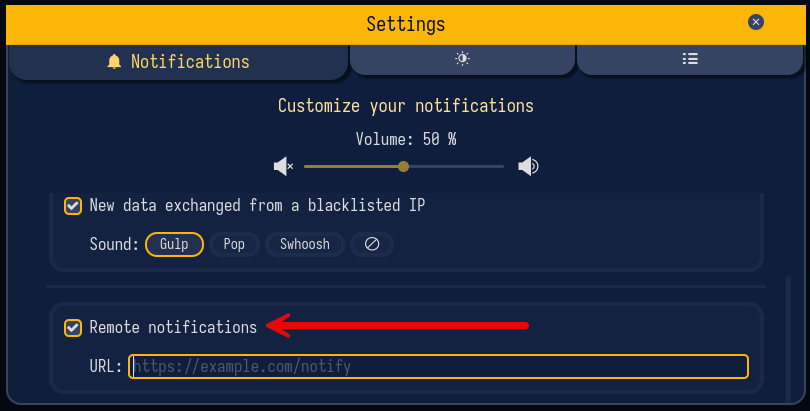
Here we see the settings dialog box where we can configure and customize notifications, including the volume of the notifications, and various filters here:
- Data threshold exceeded
- New data exchanged from favorites
- New data exchanged from a blacklisted IP
One of the really cool things you can flag on is Remote notifications where you can put in a URL such as a Gotify or Notify URL.
Sniffnet’s filtering capabilities for troubleshooting and investigating
One of the great features I think with Sniffnet is the ability it gives you to filter traffic in your packet captures. Here you have several filters, including:
- Show only blacklisted IPs
- Show only IPs listed in favorites
- Country
- Domain
- ASN
- Program
- Address (source)
- Port (source)
- Address (destination
- Port (destination)
- Protocol
- Service
- Bytes
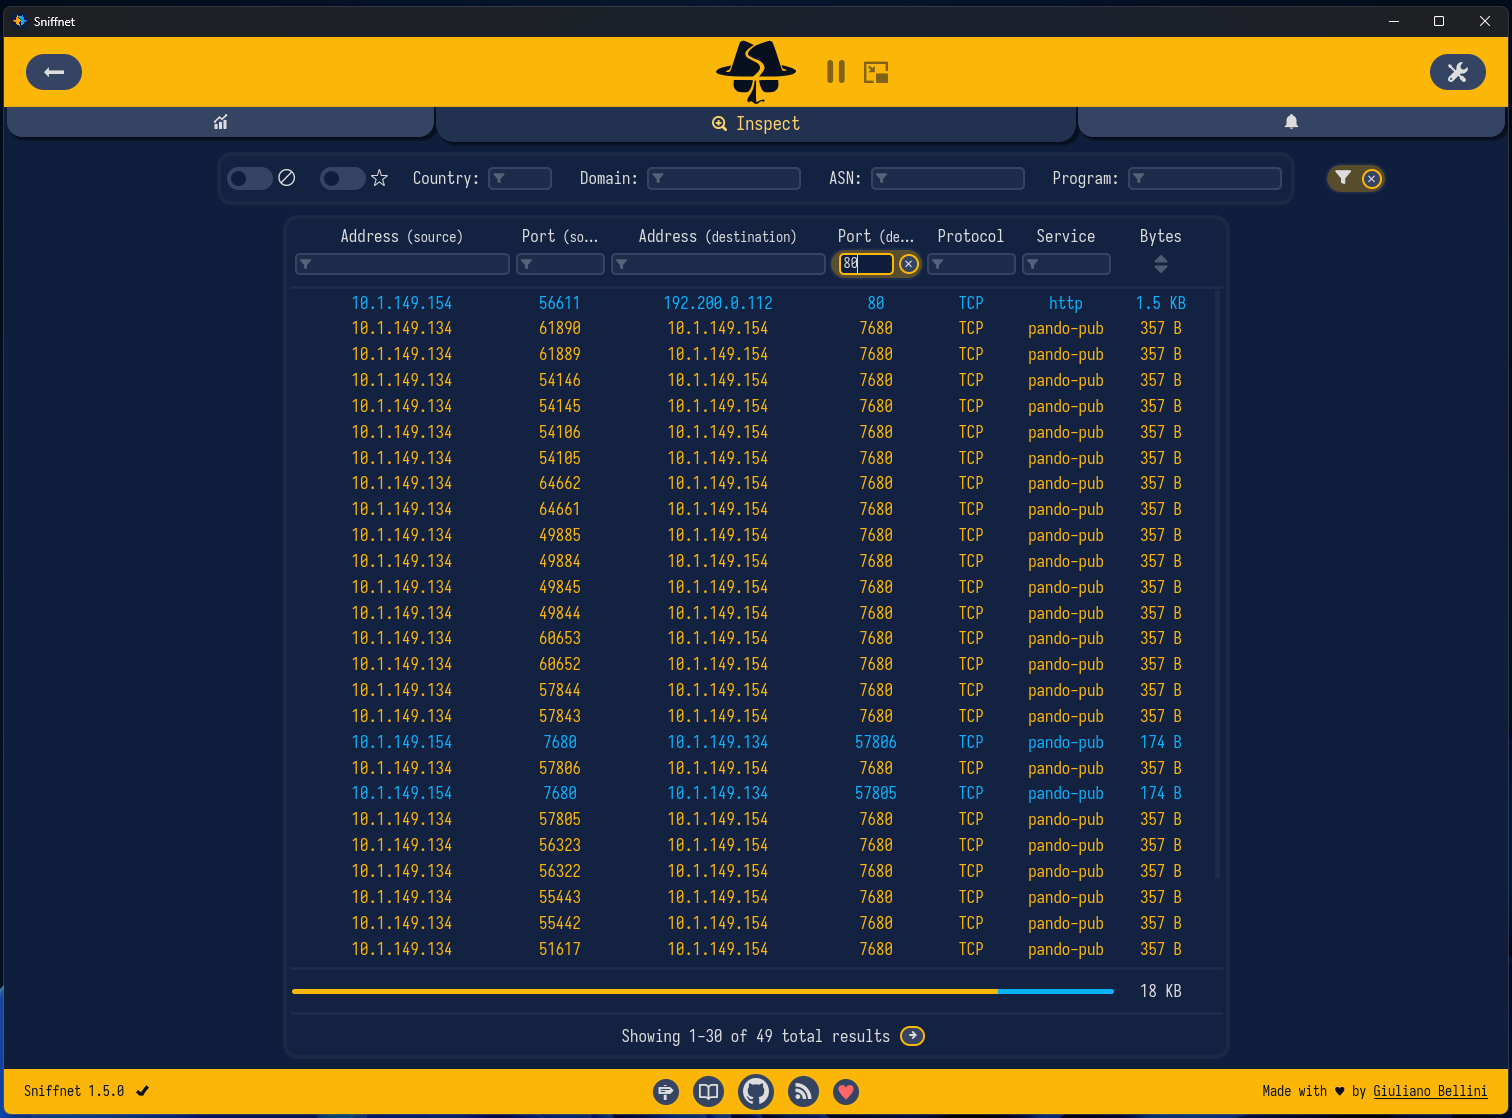
Below, I am filtering based on the destination port:
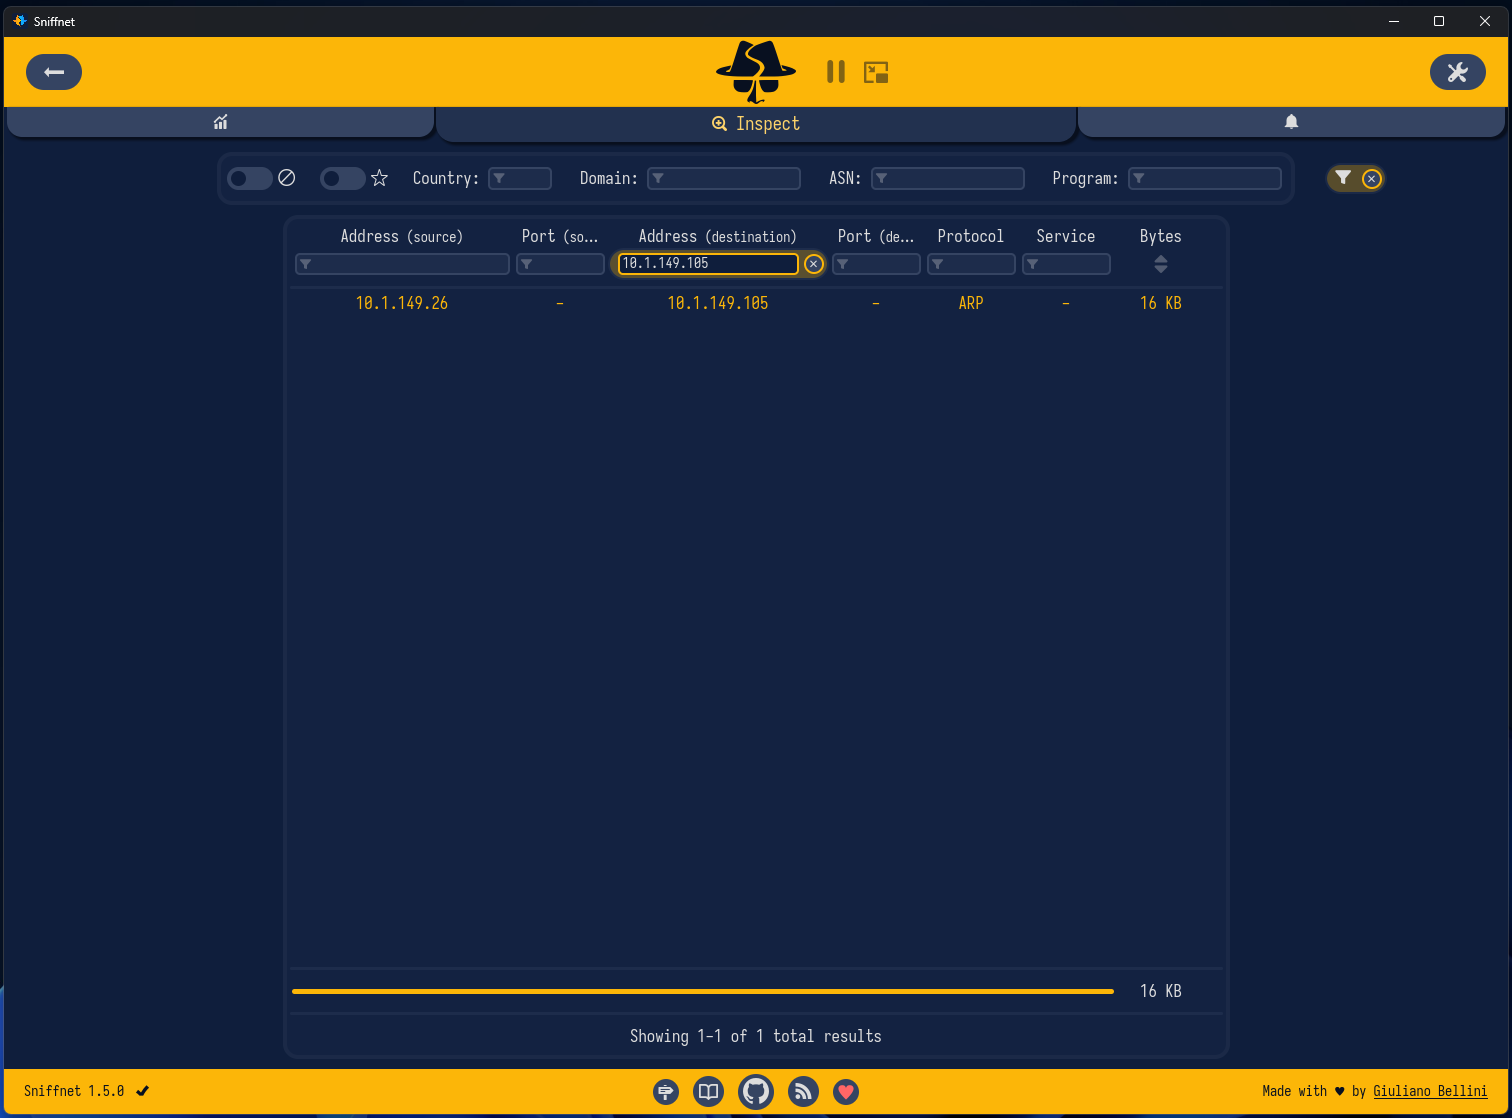
You can filter based on the destination IP which is helpful when you are troubleshooting flows or traffic to a specific destination.
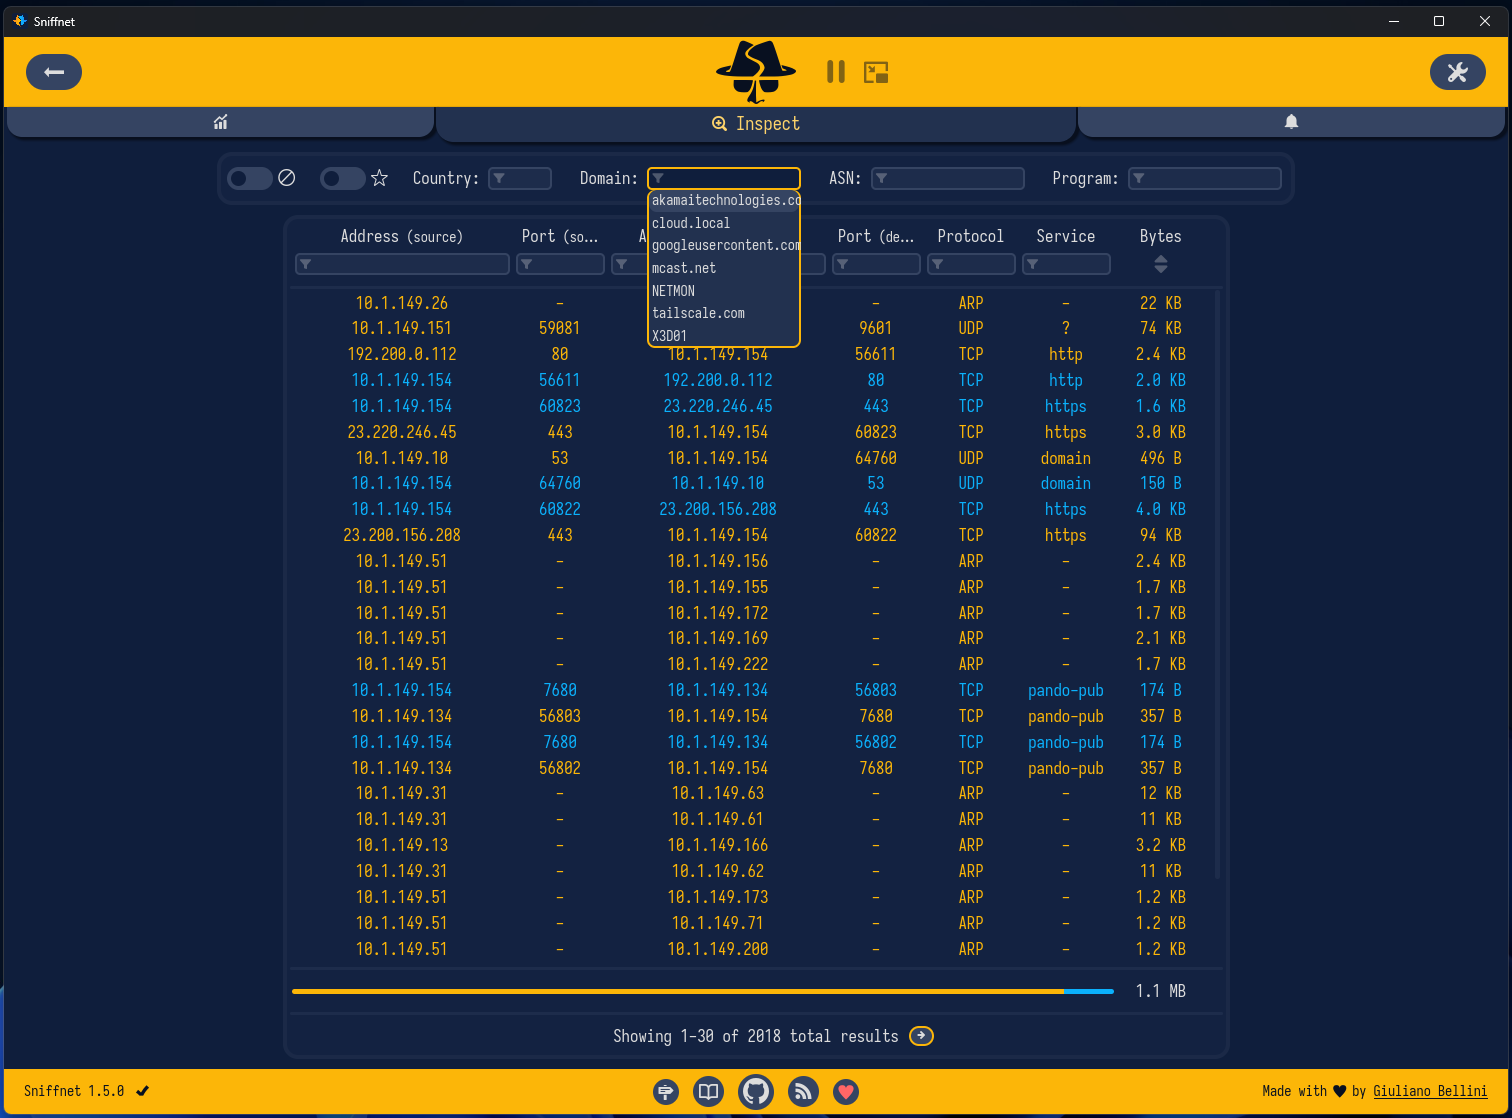
Also helpful is the domain filter. This allows you to filter based on specific domains and see traffic for only those specific domain names.
The Program view is super helpful as well. This allows you to see only the traffic associated with a specific program you are using. Again, this is great for forensics or general troubleshooting.
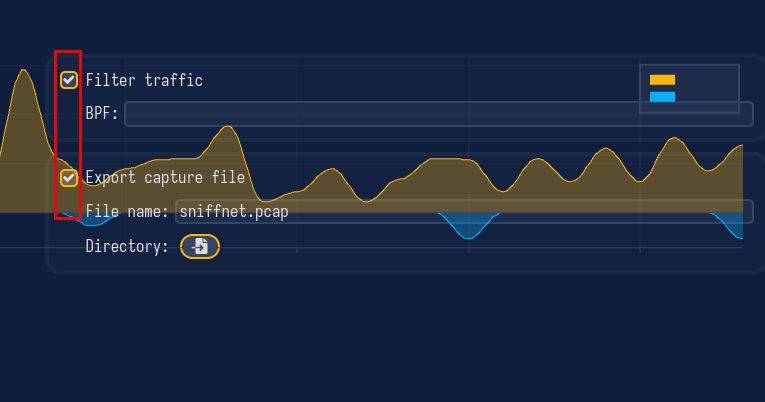
A couple of options that I missed the first few times I used Sniffnet are the Filter traffic and Export capture file options.
- Filter traffic BPF: When checked, Sniffnet applies a BPF (Berkeley Packet Filter) expression to the capture. The BPF field underneath lets you specify exactly what traffic to capture so you can use expressions like you would use in Wireshark, i.e. host 192.168.1.10
- Export capture file: When checked, Sniffnet writes the captured packets to a .pcap file while it is running.
Why I started using it in my home lab
When it comes to network troubleshooting, getting a view of things from a network packet level is a sure way to see exactly what is going on when troubleshooting or investigating issues. Wireshark has always been my goto. But I am like most. I use Wireshark enough to remember the basic queries and such but sometimes it feels a little “much” for what you are trying to do.
A lot of troubleshooting scenarios and sessions don’t really require packet-level detail included in traditional Wireshark captures. Sometimes I just want answers to questions like:
- What systems are talking?
- How much traffic is being generated?
- What protocols are being used?
- Which destinations are receiving traffic?
- Is there unexpected activity happening?
Instead of being buried in packet details, Sniffnet can give you all of the pertinent details without overwhelming you with other information that is not needed for individual packets. For quick investigations, this is often exactly what I need.
Where Wireshark still wins compared to Sniffnet
I think there are still cases where you would choose Wireshark over Sniffnet. Sniffnet isn’t and isn’t trying to be a replacement for Wireshark. So, you may have situations where Wireshark is still the better tool to use in troubleshooting. What might some of those scenarios be? You would probably still want to use Wireshark if you need to:
- Analyze packets
- Troubleshoot protocol negotiation
- Investigate TLS handshakes
- Examine DNS responses
- Decode application traffic
- Analyze retransmissions
- Inspect packet timing
Wireshark is still the unmatched champion to answer those types of very detailed and low-level questions. The reason I continue to use both tools is that they solve different problems. Sniffnet helps me understand what is happening. Wireshark helps me understand exactly why it is happening. I think that understanding both of those strengths is important when deciding which tool to use.
| Feature | Sniffnet | Wireshark |
|---|---|---|
| Ease of use | Easy | Moderate to Advanced |
| Network visibility at a glance | Excellent | Good |
| Visual dashboards | Excellent | Limited |
| Deep packet analysis | Limited | Excellent |
| Protocol troubleshooting | Basic | Excellent |
| Learning curve | Low | High |
| Best for | Understanding what is happening | Understanding why it is happening |
Wrapping up
I still choose to use Wireshark on a regular basis for understanding certain things. However, Sniffnet has definitely shown me that it is a tool that is worth launching when basic or general network information. It surprised me just how easy it was to use. The interface is super intuitive and after just a couple of minutes or so, I already felt like I had used the tool for an extended period of time and was comfortable with the information I was being presented with network flows. I think for home lab enthusiasts, self-hosters, network engineers, or really anyone who enjoys understanding how their systems communicate, it is worth trying out. What about you? Have you heard about Sniffnet? Are you currently using Wireshark as your goto network troubleshooting tool?
More in this topic
Discuss this in the Community
Google is updating how articles are shown. Don’t miss our leading home lab and tech content, written by humans, by setting Virtualization Howto as a preferred source.
About The Author
