If you saw my earlier post a few weeks back covering Scanopy, you already know there are many different solutions out there that can scan your network and generate diagrams automatically. When you have a tool that will do this, it is a huge step forward. If you have drawn things out manually, you will know the pain I am referring to here. But, there is still a gap. The tools we have today are great at creating a snapshot of your environment. But you don’t necessarily have something that is a “live” look at your environment as it is running and changing. This is where a tool called Homelable feels a bit different. Let’s look at this new tool, what it can do and how you can use it in your home lab environment.
What is Homelable
Homelable is a self-hosted infrastructure visualization tool that lets you build and maintain a visual map of your environment. While it does this, it also fetches real-time status checks to the things you care about in your lab or other environment.
Granted, it is not trying to replace your monitoring stack. It is not trying to replace your documentation either that you may already have in place. I think this solution sits somewhere in between. Real-time checks is the feature that takes Homelable from interesting to genuinely useful.
You can attach health checks to nodes and services using things like ping, HTTP, HTTPS, TCP, SSH, and Prometheus endpoints. With this, your map is not just showing structure. It is showing state. If something goes down, you can see it immediately. If multiple services depend on a component that fails, you can visually trace it. This will be helpful when troubleshooting systems like reverse proxies, container stacks, or distributed storage.
Why visualizing your home lab actually matters
Taking a step back for just a minute, why is visualizing your home lab something that you should view as important? Well, like production environments, as our home lab grows, the hardest part isn’t necessarily building it, but keeping track of it. You start to layer on technologies on top of one another. This includes things like Proxmox nodes, Proxmox Backup Server, virtual machines, containers, storage clusters, reverse proxies, VLANs, and other integrations.
Then, if you have something break, you are not left just trying to trace dependencies across your multiple systems. This is something that slows all of us down. Having a visual map that can reflect the state of your infrastructure when things go sideways is key.
Deploying Homelable in your home lab
Getting started is super simple if you are already running a Docker host in your lab. You can use the container image for Homelable that you can deploy with a minimal Docker Compose configuration. You basically just pull down the install script that unpacks the docker compose file and then you bring the docker compose stack up.
curl -fsSL https://raw.githubusercontent.com/Pouzor/homelable/main/install.sh | bash

#Change into the directory it creates
cd homelable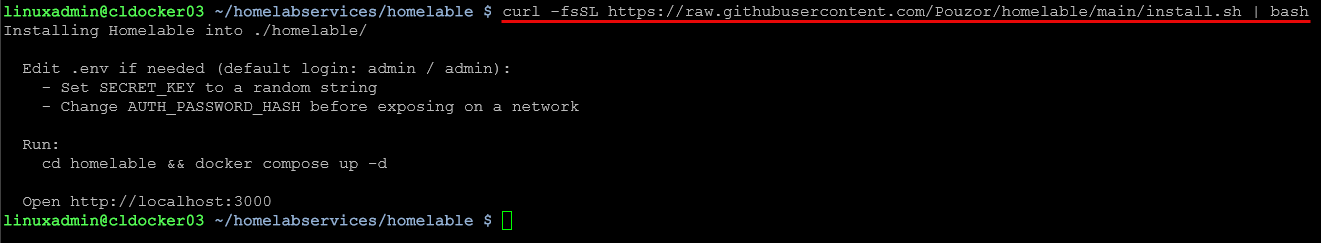
Deploy it with:
docker compose up -d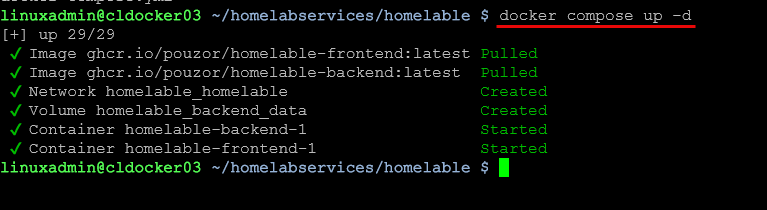
After that, you can access the interface for Homelable at:
http://your-server-ip:3000The default admin password if you haven’t changed anything in the config is admin/admin.
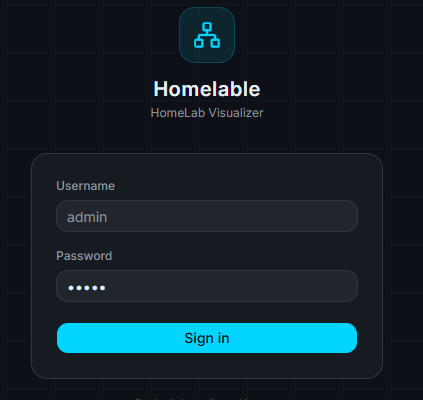
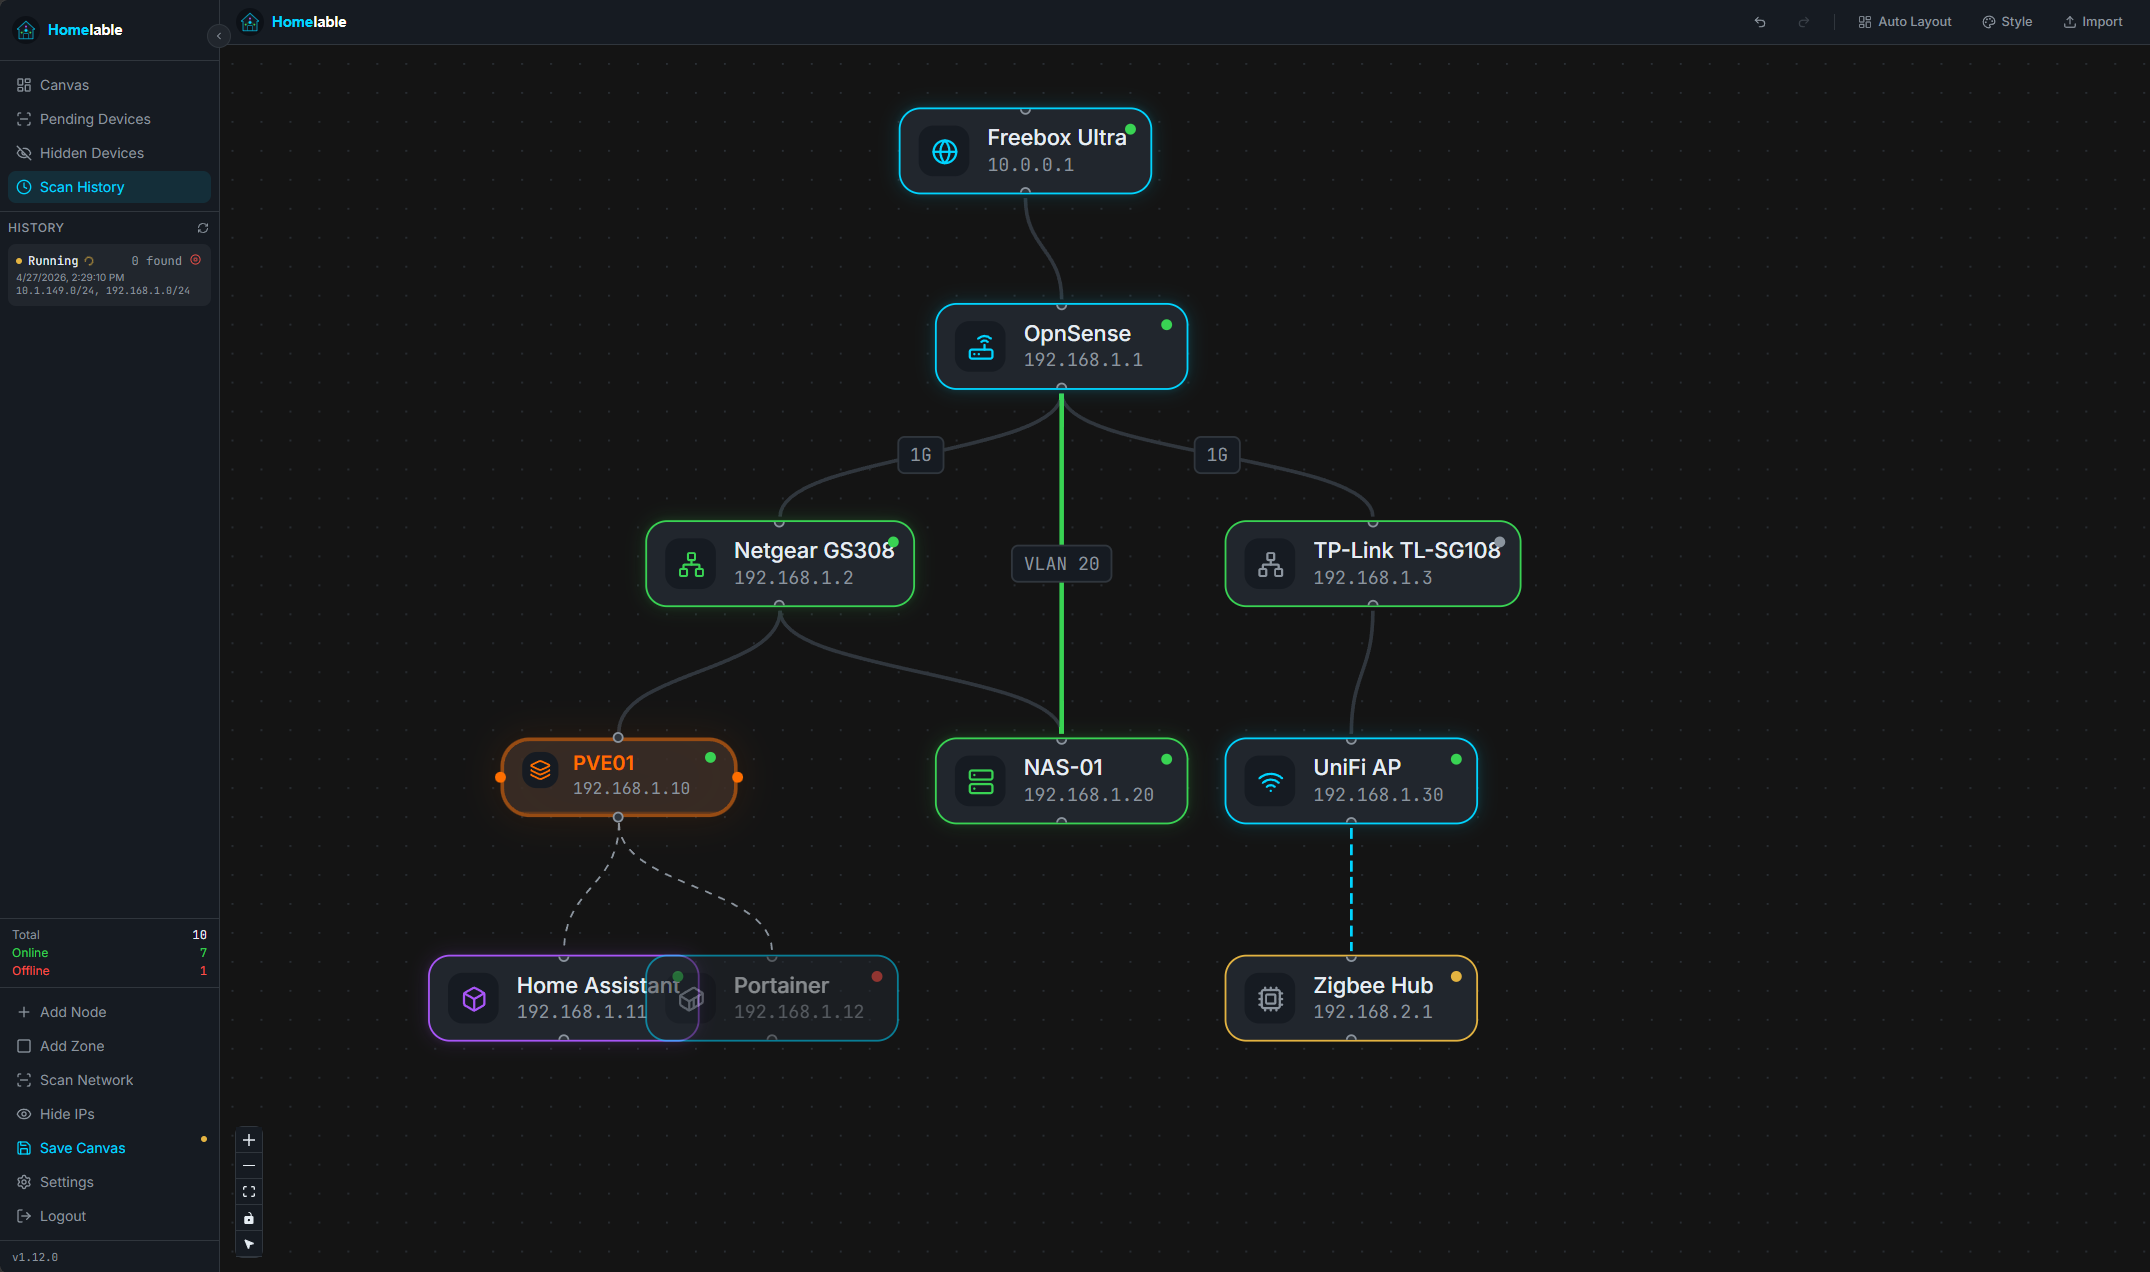
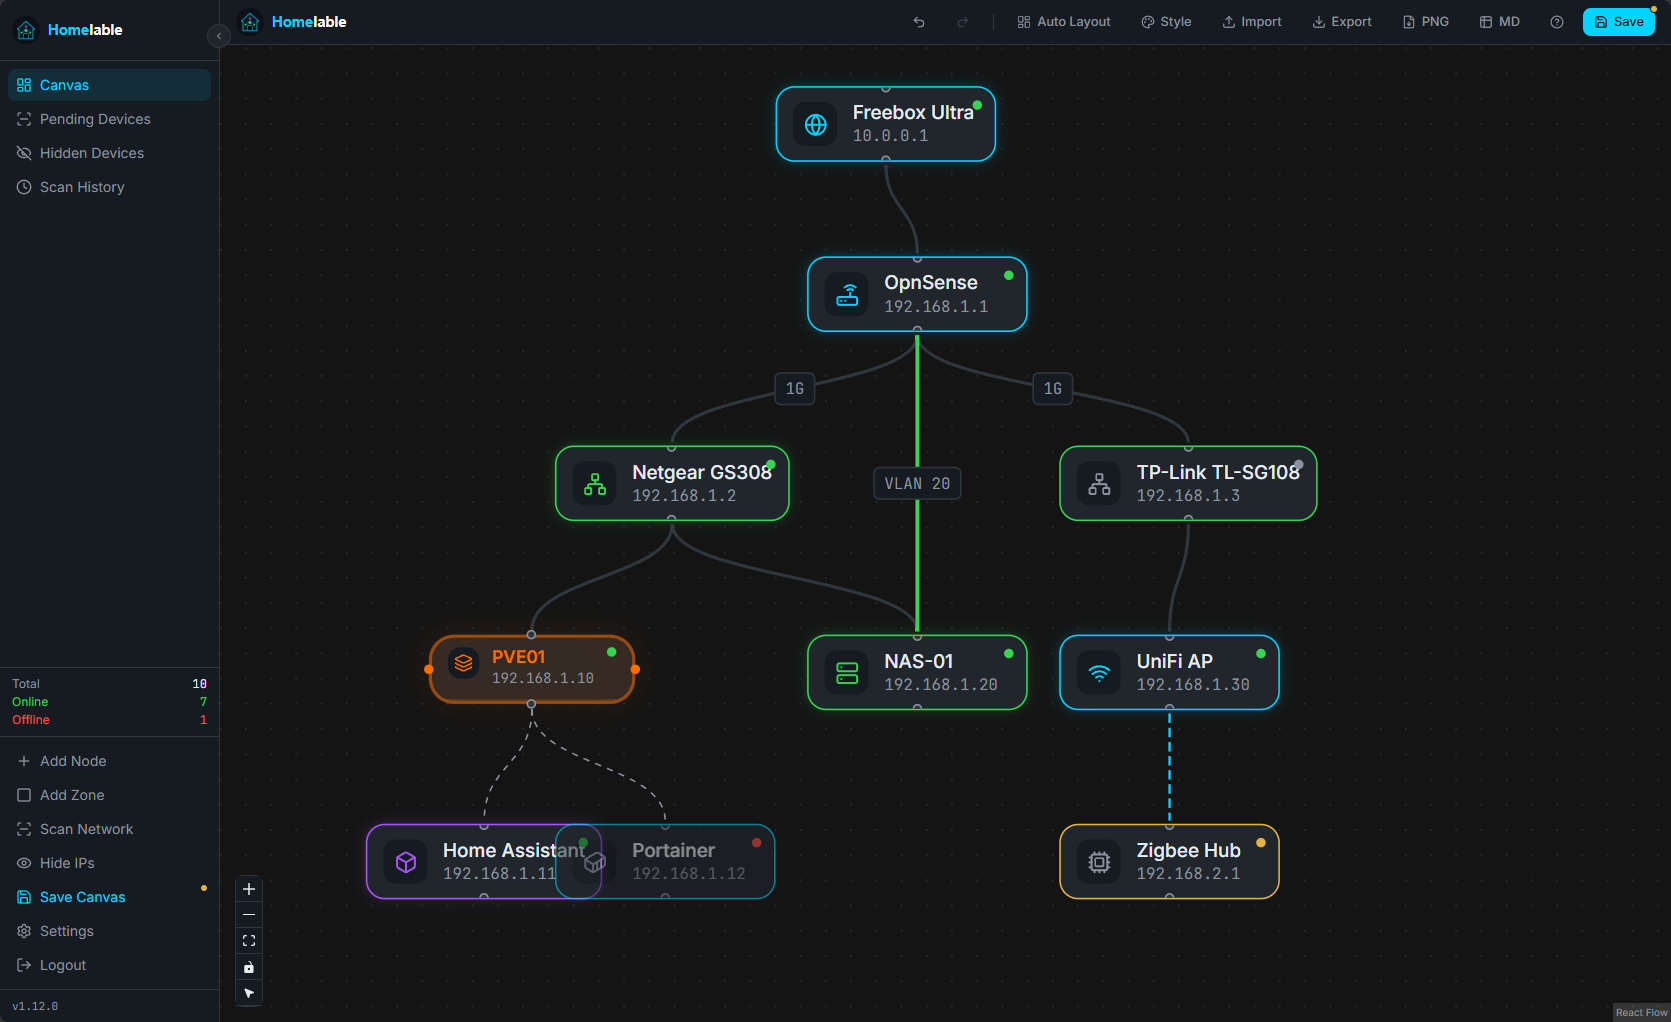
When you log in for the first time, you will see an example diagram that comes out of the box to give you an idea of what it looks like. Overall, I like the styling with how it represents everything and dark mode by default. You can play around with this default diagram just to get a feel for how things operate which is a nice touch.
Scanning your network
There are a couple of notes regarding scanning your network. You can actually input your network ranges in the .env file that is pulled down with the above command we noted for getting up and running.
# Scanner JSON array of CIDR ranges to scan
SCANNER_RANGES=["192.168.1.0/24"]
# Status checker interval in seconds
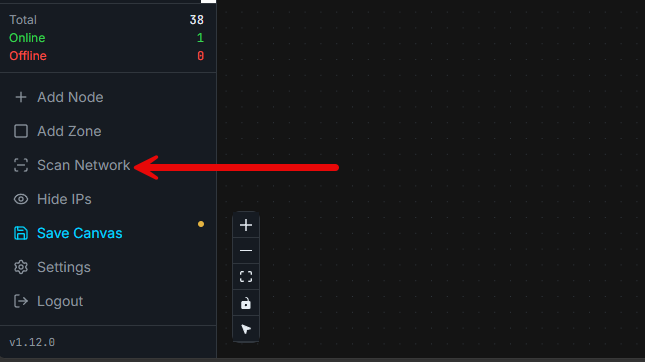
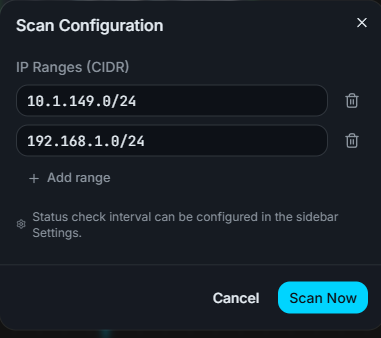
STATUS_CHECKER_INTERVAL=60You can also manually add subnets to scan in the Homelable interface. In the lower left-hand corner of the interface, you can click the Scan Network option.
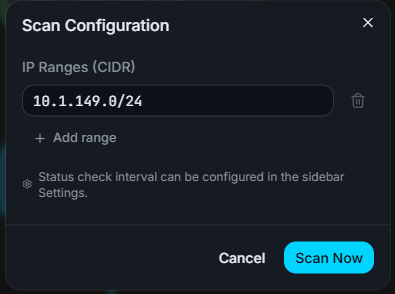
Also, if you click the + Add range button, you can add additional ranges to the same scan so that it scans multiple ranges at once so you don’t have to do these one at a time.
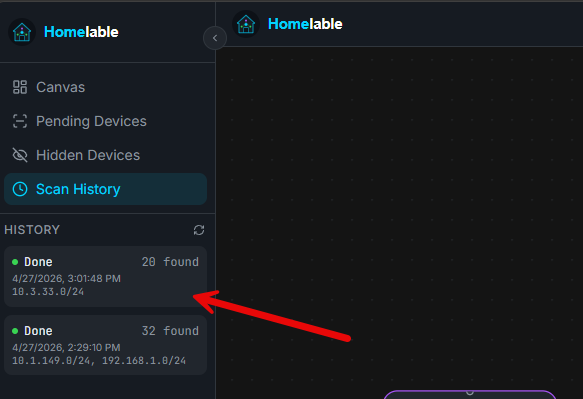
You can see under the Scan History if the scan is still running or if it is completed.
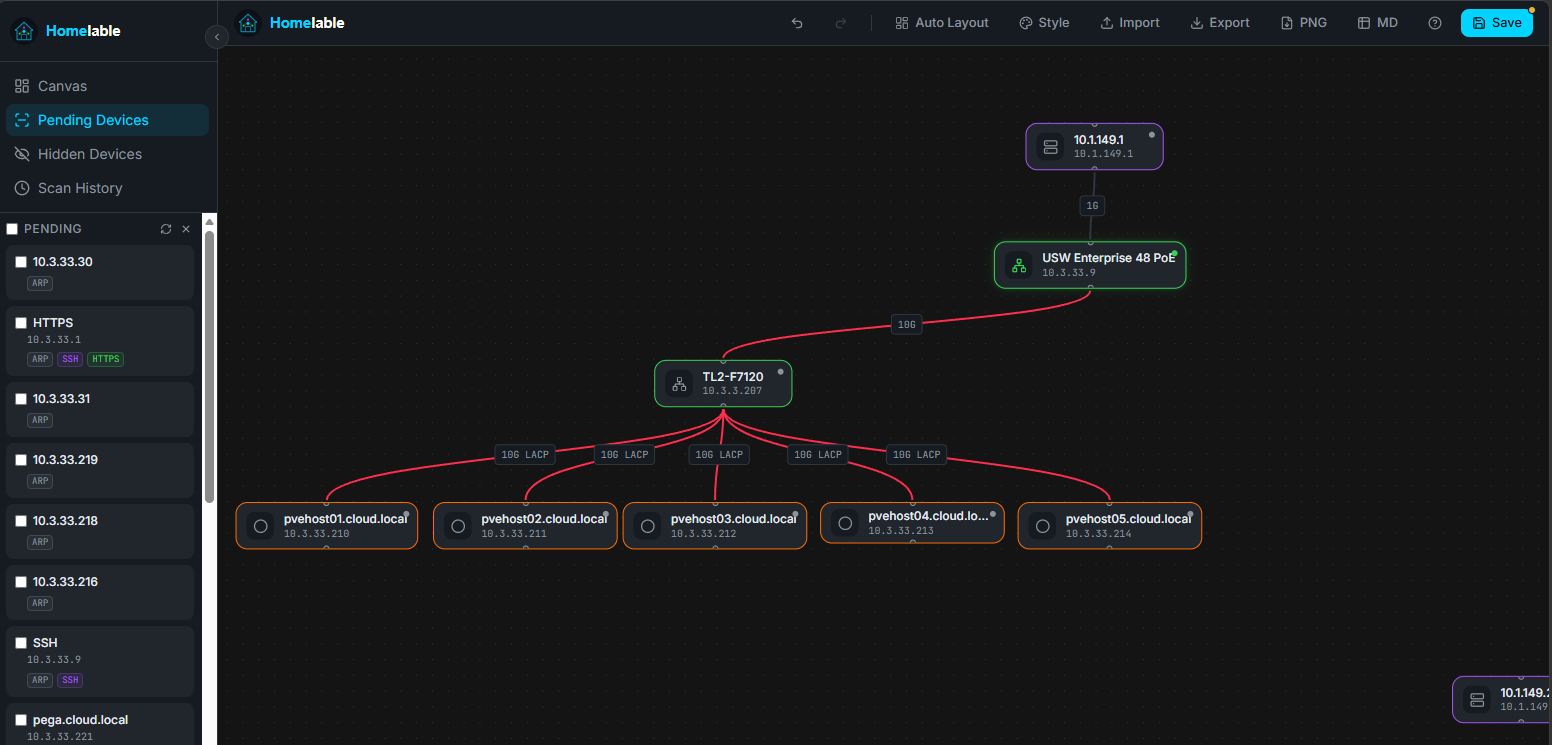
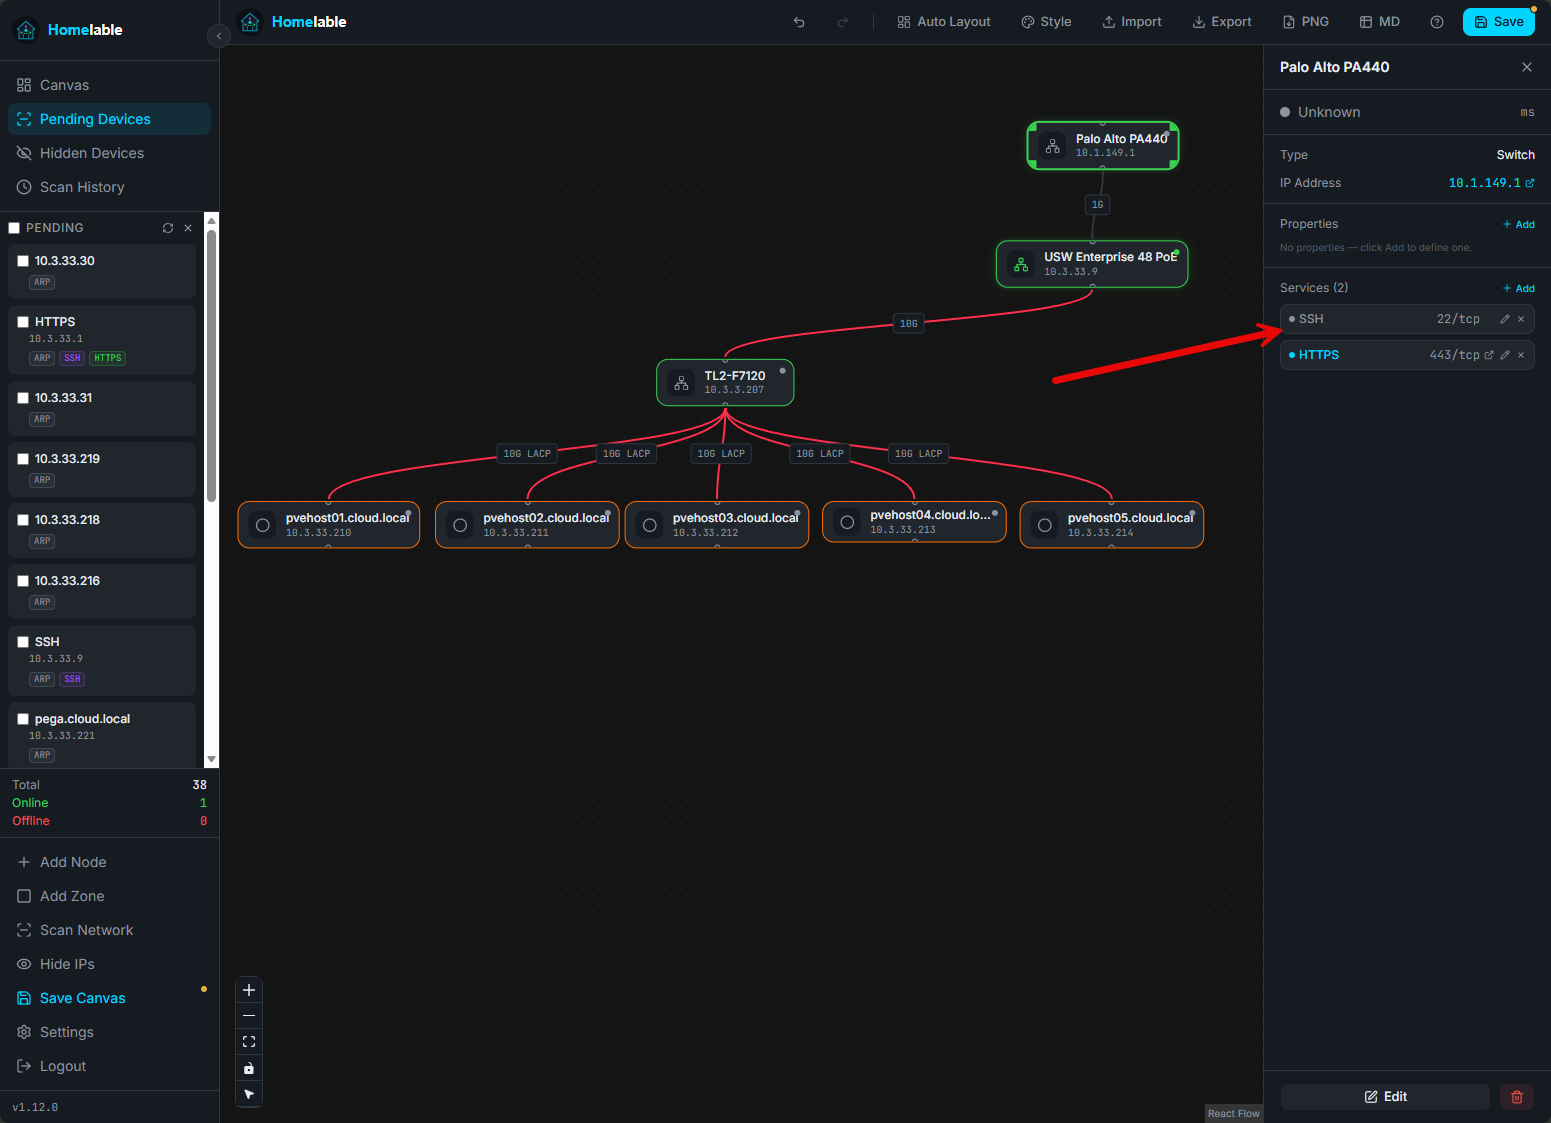
When you click a scan, you will see the checkbox by each node. You can check the box and then add them to the canvas. Below, you can see a few devices that I quickly pulled out of the scan, added, connected them together and I also changed the color of the network connections between them.
The key difference from other tools
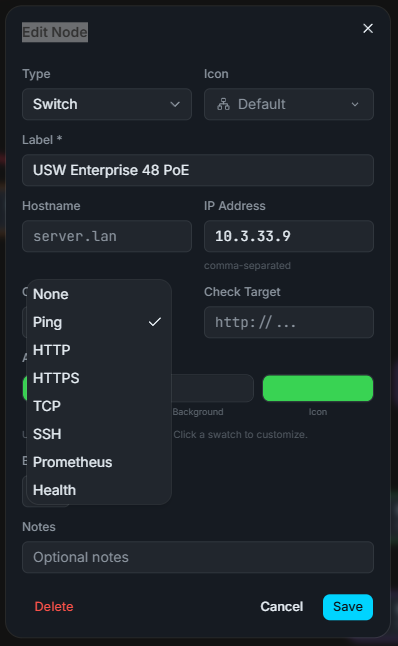
I have reviewed and looked at other tools like Scanopy as mentioned earlier. I think the clear difference between this tool and something like Scanopy is that it is a more up to date copy of your nodes as you can set the pings or other checks to be every few seconds if you want. Below, you can see the multiple check methods you can use from ping, http, https, tcp, ssh, prometheus, etc.
If I could compare them this way:
- Scanopy focuses on discovery and automatic diagram generation. It answers the question, “What does my network look like right now?”
- Homelable answers a different question – “What is my infrastructure doing right now, and how does everything relate?”
So, I think with Homelable you are not just creating a diagram and exporting it. You are maintaining a living map of your infrastructure. And you are not stopping at discovery of nodes. You are attaching health checks and status indicators so the map becomes useful in real-time.
That is why the two tools can actually complement each other instead of competing I think if you want to run both. Below, you can see when you click on a node, you can edit the services you are discovering and update other checks and information.
The MCP integration and why it matters
One of the more interesting aspects of Homelable is its MCP server support. As we all know, AI is the rage these days. This integration allows AI tools to interact with your infrastructure map in a structured way. They can query nodes, understand states, and potentially help with automation or analysis.
You can use prompts like this given from the Github repo:
- What nodes are currently offline?”
- “Add a new LXC container named
piholeat 192.168.1.5, connected to my switch.” - “Trigger a network scan on 192.168.1.0/24 and show me the pending devices.”
- “Show me the full canvas topology.”
Here is an example of the MCP configuration adding Homelable to Claude Desktop:
{
  "mcpServers": {
    "homelable": {
      "type": "sse",
      "url": "http://<your-homelab-ip>:8001/mcp",
      "headers": {
        "X-API-Key": "mcp_sk_yourkey"
      }
    }
  }
}
Wrapping up
I really like Homelable. It stands out as where we are headed with these kinds of status and documentation tools. I like to think of it as a mix of Uptime Kuma and Scanopy with diagramming tools built-in. It is really easy to get up and running in just a couple of minutes and you can start scanning your networks in no time. What about you? Have you tried out Homelable as of yet? Let me know in the comments your thoughts on this tool.
More in this topic


Discuss this in the Community
Google is updating how articles are shown. Don’t miss our leading home lab and tech content, written by humans, by setting Virtualization Howto as a preferred source.
About The Author

Seems to be a nice tool, sadly it doesn’t find anything in my network – even pure nmap from my pve as example.. i guess i miss something xD
Daniel,
Interesting. Make sure you are configuring the subnets correctly either in the app or using the config file subnet configuration when standing up the compose stack.
Brandon
Hey Brandon,
it works now. It wasn’t a bug. I was just used to a different speed from local scan tools, or rather, it seems that Nmap uses different scanning methods one after another here, which may or may not return results depending on the network configuration 😀
I look forward to adding this service to my HomeLab.
Your article reminded me of ‘HP Openview’ that I deployed, too many years ago to recall, on a hospital campus.
I used Synoptics hubs with fibre links that folded back in case of a break, thus keeping the network functioning.
While I was demonstrating all the ‘green nodes’ on the monitor to the Client in the computer room (with a VAX humming behind us), there was a ‘whoosh’ sound and several nodes turned from green to yellow.
Turned out that the roadway next to the computer room building was being excavated, and the underground fibre had been ripped up and pulled out of the termination box inside the computer room.
So I was able to ‘demonstrate’ to the Client, that my resilient design had worked perfectly LOL.
Peter,
Wow that is a story. I would definitely like to hear more details on that one. Sounds like a memorable event. I can’t say I have ever had the fiber pulled out of the termination box but definitely have seen my fair share of cuts over the years.
Brandon
The MCP integration, if as you indicate, is hugely important and far more so than its basic capabilities.
I think that merits a far more in-depth article.
I wonder if it’ll work with my home Ollama container?
Tie that into Home Assistant and/or Google Home (I run both), and I could ask out loud things like “did my doorbell camera just show a UPS truck”.
Bruce,
I definitely think the MCP integration is one of the most interesting features as well. I look forward to playing around with this more in my home lab as well.
Brandon
> Tried Homelable on a busy homelab (~30 active services across Proxmox + Docker) for an hour after reading this. Wanted to like it — the canvas idea is the right idea — but a few rough edges meant it didn’t earn its keep:
>
> **The approve flow throws away most of what the scanner found.** Pending devices come in with an IP, a hostname (where rDNS resolves), a list of detected services with port + icon + category, and a suggested type. After approve:
>
> – **UI approve** keeps the services list and the IP, but blanks the hostname and label (you re-type both per device).
> – **MCP approve_device** keeps the type, drops *everything else* — services list goes empty, IP becomes null, hostname becomes null. Then update_node lets you set hostname/ip/label/parent_id back, but there’s no API path to restore the services list, so you lose the service icons that make the canvas useful.
>
> So either way you’re hand-curating per device, and the MCP path is strictly worse than the UI for this. With ~80 pending devices on a /24 scan, that’s a lot of typing for a canvas that mostly duplicates what Homepage and Pulse already give me.
>
> **The MCP write surface is materially incomplete.** Beyond losing services on approve, update_node exposes only hostname, ip, label, parent_id, status. It can’t set the two fields that actually drive the live status check — check_method and check_target. So nodes set up via MCP stay stuck at status: unknown until you click into each one in the UI. Same story for position, custom icon, hardware fields, notes. The MCP server feels like a thin read API plus a subset of the simplest writes, rather than something an agent can actually use to drive the canvas.
>
> **rDNS hits without service detail mislead the type guess.** Some devices show up with a hostname (great) but no detected services, so they default to generic. Others hit one Synology DSM port (5001) and get tagged nas even when they’re a Traefik LXC that just happens to have something on 5001. A second pass that reconciles hostname patterns against service signatures would help a lot.
>
> **What I’d want before trying again:**
> – Approve preserves discovered services and IP/hostname; the dialog only asks for what’s actually missing.
> – MCP exposes the full create/update field set including check_method/check_target.
> – Bulk import from CSV/YAML — most homelabbers already have this list somewhere (Excel, Notion, an inventory note) and would much rather paste it than click through 80 modals.
> – Optional rDNS auto-label on approve (with a one-click override).
>
> Cool concept, just not ready for the scale of an established lab yet. Watching the repo.
James,
That is great feedback and honestly great for the developer to see candid bumps and challenges ones have along the way. I appreciate you noting these things out there for the community. I think as it matures we will see it get better hopefully. Keeping an eye on it as well.
Brandon