


I am all about monitoring things in my home lab and with DNS being so important, if there is one service to monitor, this is it. DNS is at the core of many of my home lab services. So, if it isn’t working correctly, then there will quickly be problems. I have been over on Technitium DNS servers for quite a while now. They quietly do their job in the background. However, thankfully, due to monitoring I had in place, I started seeing intermittent failures that i never would have noticed otherwise. This turned into an interesting troubleshooting session that uncovered some issues in my environment. Let me go through how I monitor DNS and what I uncovered in the home lab.
What do I use to monitor DNS in the home lab
I use a few tools, but primarily, the one monitoring solution that I use for DNS monitoring is Uptime Kuma. With Uptime Kuma, I can check several aspects of the health of my DNS infrastructure. I check at a high level these things:
- Is port 53 reachable on my servers?
- Can I get to the web admin interface of Technitium?
- Can my DNS servers recursively query and resolve a record on the Internet?
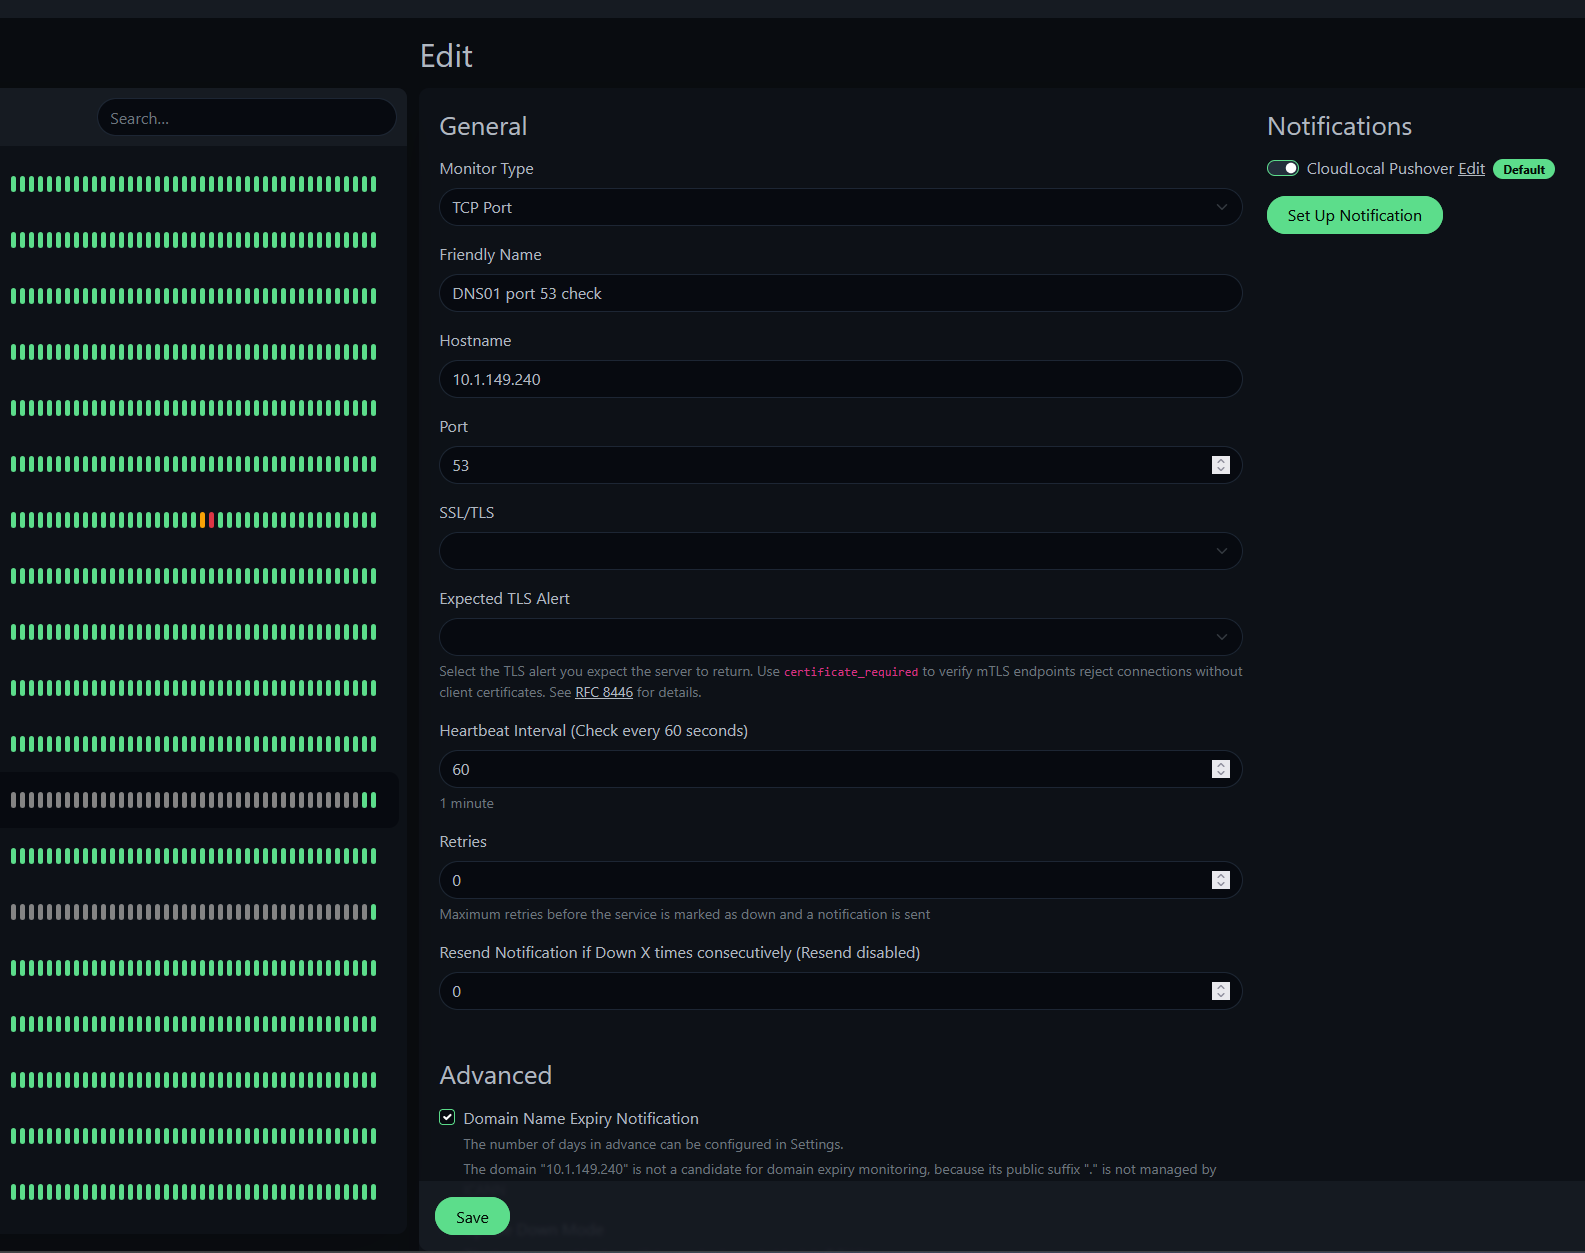
I have specific monitors setup to test each of these things. Below is the very basic check just to make sure that port 53 is up and running in Uptime Kuma. This makes sure there is network connectivity and an open port on port 53 for DNS. This is a good basic check that will rule out things like firewall filtering or something else blocking the port for recursive queries.
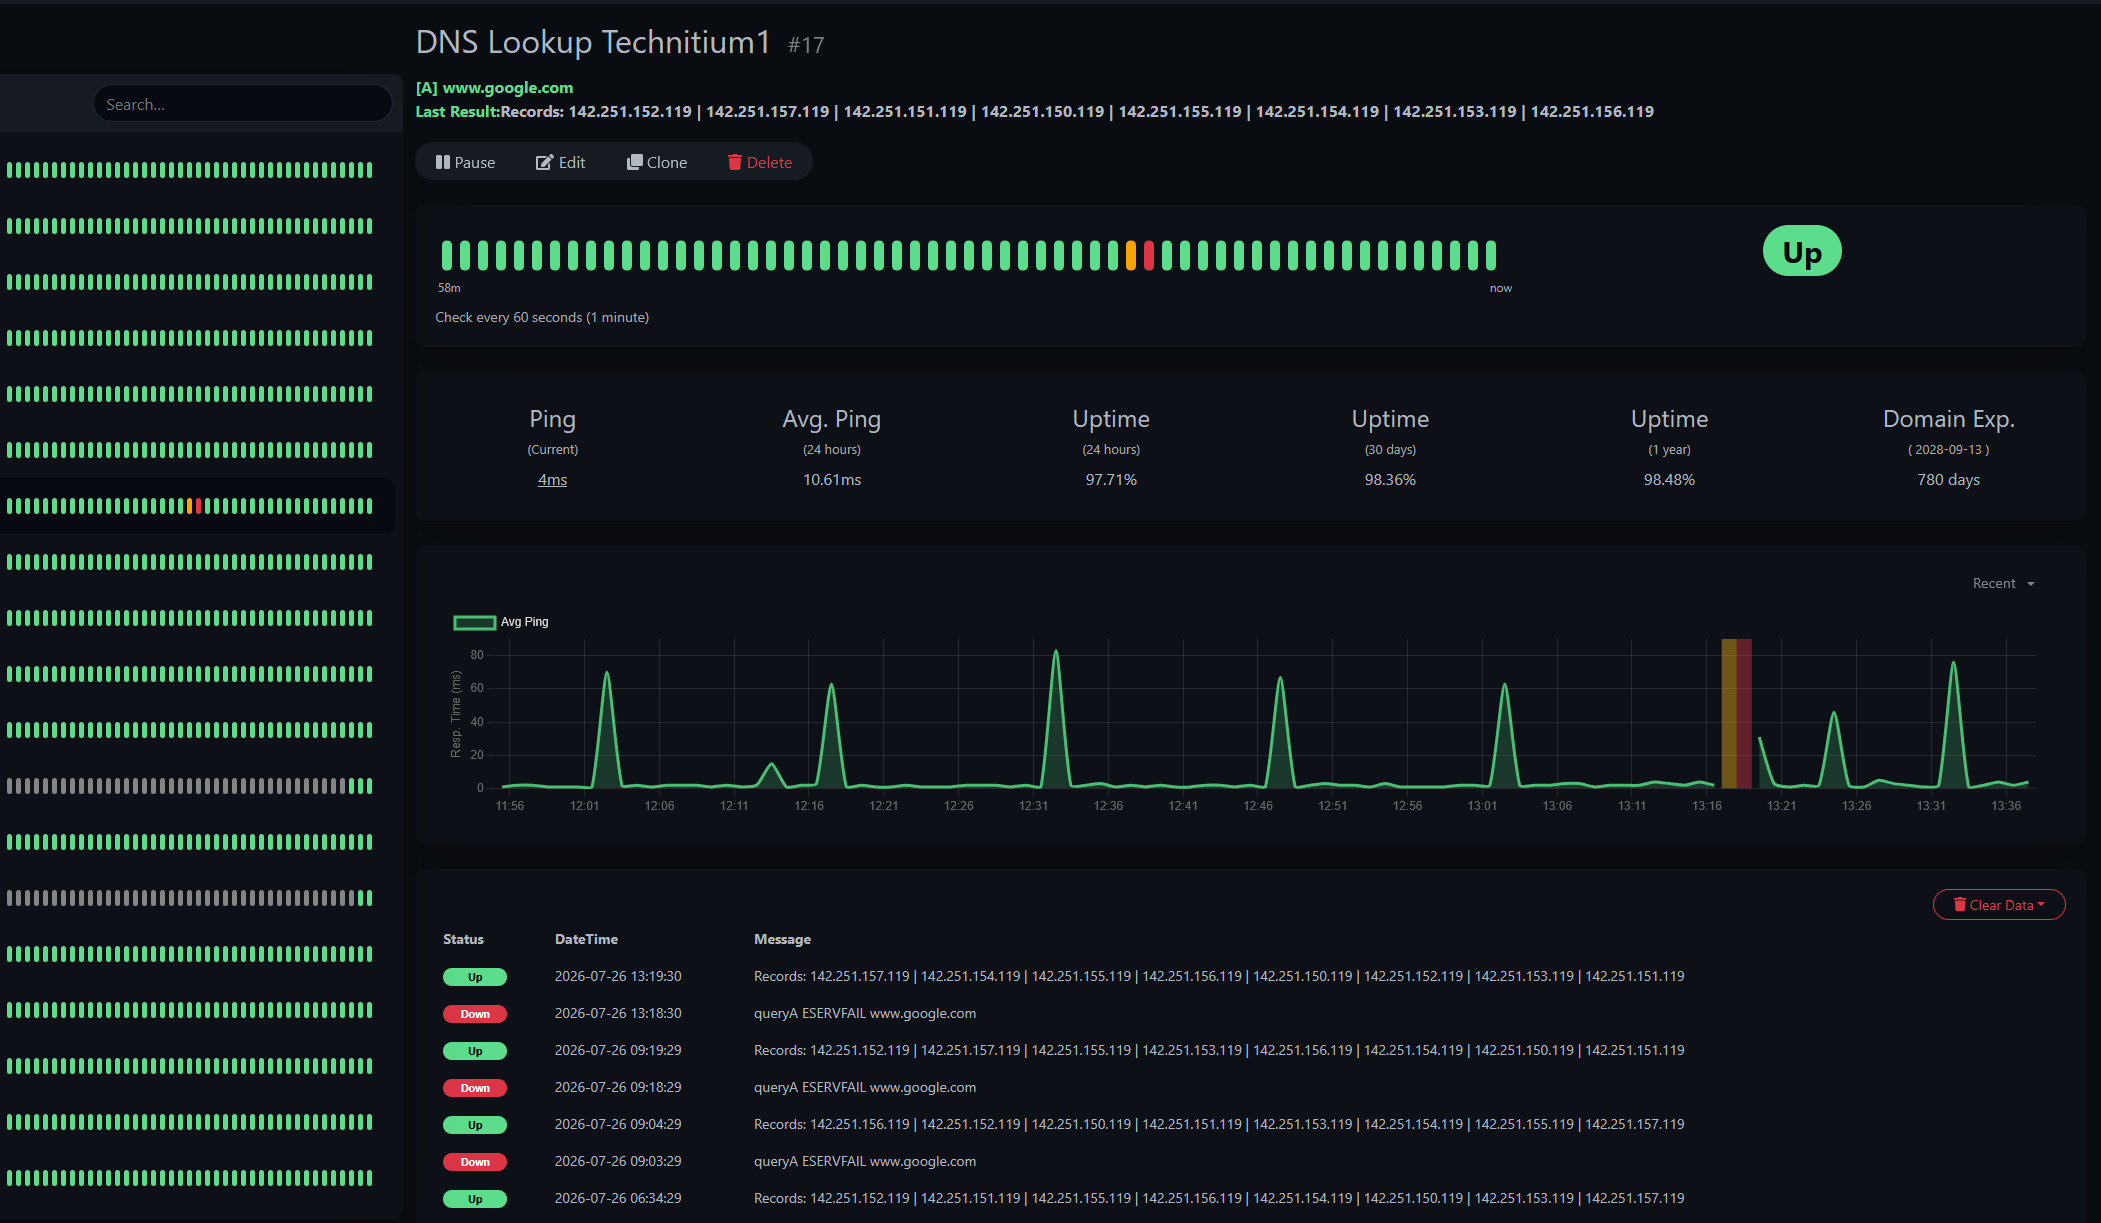
Here is the lookup where I am querying DNS record for a recursive lookup. This actually tests Technitium as a DNS solution. It will tell you if Technitium itself can use DNS to recursively query for a record that you specify and return the result of that query. This basically tests the solution at an application level.
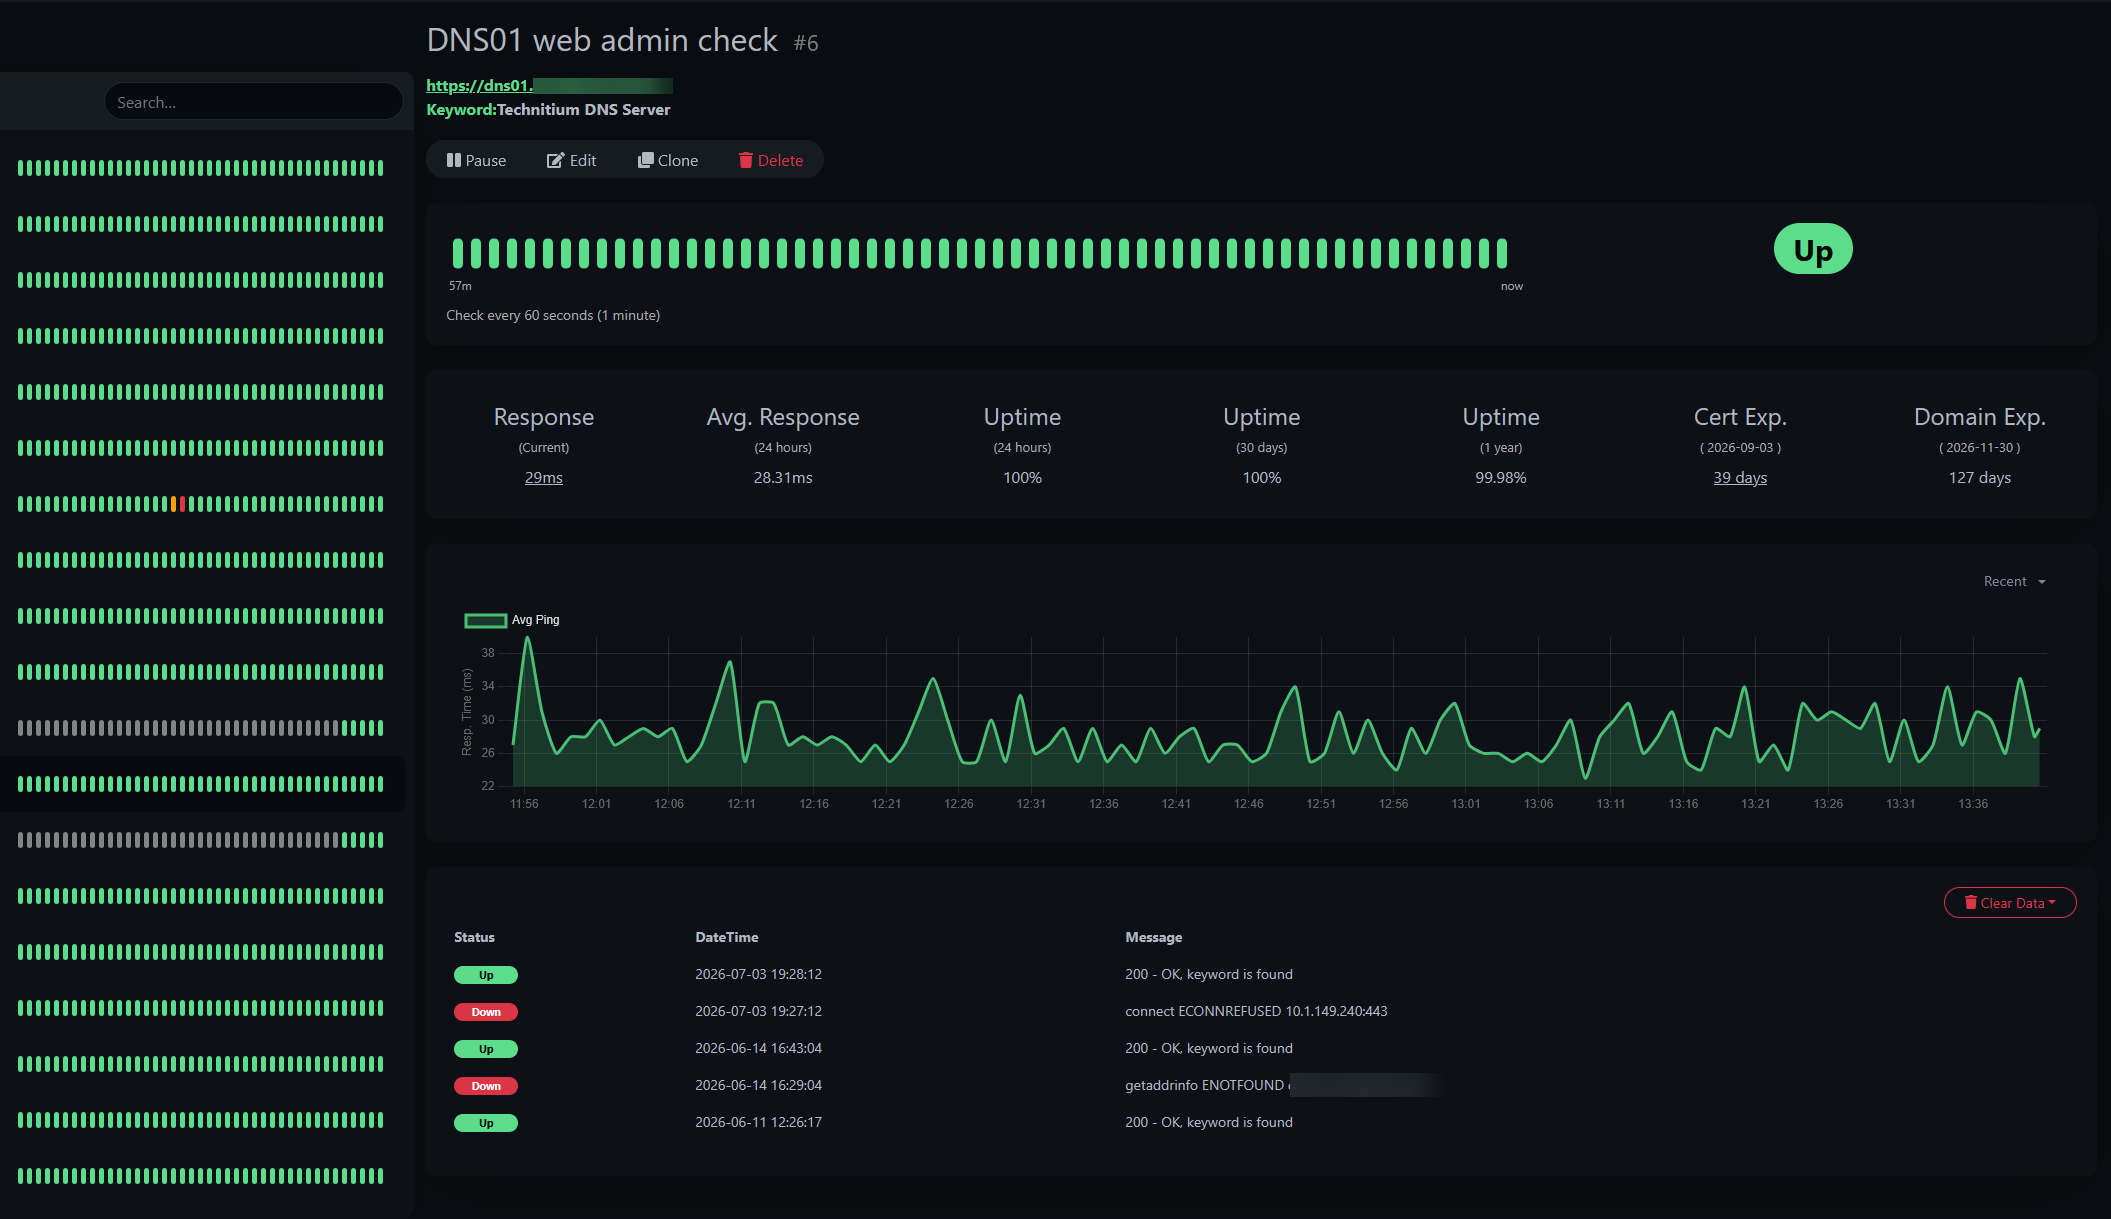
Finally, here is the web admin check that I have setup for checking to see if the Technitium web admin page is available and up and running. This checks to make sure the management frontend for Technitium is up and running.
Monitoring DNS and errors I uncovered
Like many, I have expanded what I monitor in the home lab and have gotten smarter about what to check as well. I monitor things in the lab like reverse proxies, websites I host, Proxmox nodes, containers, Kubernetes, AI infrastructure, etc. But, for a long while, I wasn’t really checking to see whether or not my DNS servers were actually resolving names.
This is a huge blind spot because it leaves you assuming that recursive queries are ok and there isn’t a breakdown there. Like many home labbers, I’ve gradually expanded my monitoring over the years. Also, i have definitely learned in my environment that a DNS server can be online, listening on port 53, and still fail recursive lookups or you might catch intermittent issues. If you’re only monitoring whether the service is running, you’ll never know.
That’s where setting up the Uptime Kuma’s DNS monitor comes in as I have shown above with the DNS query monitor setup that I run. Instead of only checking whether a port is open for DNS, port 53, it performs an actual DNS lookup against the server you specify.
I configured two monitors that tested a couple of different external hostnames:
- My primary Technitium DNS server resolving www.google.com
- My secondary Technitium DNS server resolving www.microsoft.com
I expected them to stay green forever. However, due to monitoring, I uncovered a transient issue in my home lab DNS infrastructure where I was seeing this:
queryA ESERVFAIL www.google.comThe interesting part was that it would usually recover on the very next check. Nothing appeared to be broken. Applications continued working. Containers stayed healthy. I never really noticed anything in the home lab or home network in general. Without this monitor, I would have assumed DNS was operating perfectly without any failures.
Troubleshooting
My first thought was that perhaps Uptime Kuma was generating false positives. That theory didn’t really last when I started looking at the Technitium DNS query logs. I immediately found entries in the logs that lined up with the failures.
One example looked like this one:
[2026-07-26 12:41:18 UTC]

DNS Server failed to resolve request using forwarder:

1.1.1.1

DnsClientNoResponseException
I found several similar entries throughout the logs involving different public domains.
For example:
Failed to resolve:

gspe19-2-ssl.ls.apple.com
libbyapp.com
dgw.c10r.facebook.com
The important thing wasn’t the domains that were failing themselves. It was that Technitium was occasionally reporting that upstream recursive lookups weren’t completing before the timeout expired. At that point I knew Uptime Kuma wasn’t making the errors up in the home lab. The DNS server itself was reporting intermittent upstream communication failures.
Chasing the wrong problem
Like a lot of troubleshooting sessions, you have to chase a few dead ends before you uncover the real culprit. The first thing I looked at was DNSSEC. Nothing there stood out. Next I started looking at Kubernetes networking because my primary Technitium server runs inside my Talos Kubernetes cluster and then I have my secondary instance running on a standalone Docker container host.
Maybe there was something happening with CNI networking I thought. Then I noticed something interesting. My secondary Technitium server runs on an entirely separate Docker host. It was showing the same intermittent errors in the logs. That immediately told me that Kubernetes was probably off the list of suspects.
When two completely different platforms exhibit the same symptom, I start looking for what they have in common rather than what makes them different.
Digging into the firewall
My next stop was my Palo Alto firewall. I exported traffic logs for DNS traffic heading toward my upstream resolvers. At first glance everything looked completely normal. Typical recursive lookups looked like this:
| Time | Source | Destination | Application | Action | Session End |
|---|---|---|---|---|---|
| 07:48:01 | DNS Server | 1.1.1.1 | dns-base | allow | tcp-fin |
| 07:48:51 | DNS Server | 1.0.0.1 | dns-base | allow | tcp-fin |
Then I noticed something different. Some sessions looked like this:
| Time | Source | Destination | Application | Action | Session End |
|---|---|---|---|---|---|
| 07:54:29 | Apple Device | 1.1.1.1 | dns-base | allow | threat |

For about thirty minutes I thought I had found the smoking gun. Why would DNS traffic end with a session reason of threat? The more I investigated, the more obvious it became these weren’t recursive DNS lookups from Technitium at all. They were Apple devices on my network using Apple’s DNS privacy services and Private Relay infrastructure.
Completely unrelated. It turned out to be a dead end. But it also highlighted something interesting. Without starting this DNS investigation, I never would have noticed that behavior on my network. Monitoring often uncovers things you weren’t even looking for.
Eliminating more possibilities
So, while I hadn’t uncovered the real culprit behind it all, I felt like I had ruled out some theories that may have led me off track later. The problem wasn’t with Technitium itself. It wasn’t Uptime Kuma generating false alarms and it wasn’t isolated to my Kubernetes cluster. Also, though, it wasn’t related to Docker either. It wasn’t just a single domain. Both DNS userves used the same upstream recursive forwarders.
Both of these servers used the same networking path as well. So, at least I had ruled out several things in the meantime that I could have wrongly assumed was in play.
Automating the troubleshooting
One thing that I have learned to do over the years, is to automate the ability to catch intermittent issues. It is VERY hard, next to impossible to catch, these intermittent issues otherwise. So, instead of just sitting in front of a terminal waiting for a five second failure that might happen once in 24 hours, you can automate the information gathering.
Inside my Technitium container, I started continuously querying multiple public DNS providers while logging the results.
while true; do
    echo "===== $(date '+%F %T') ====="

    echo "Cloudflare"
    dig +tcp @1.1.1.1 www.google.com +time=3 +tries=1

    echo "Google"
    dig +tcp @8.8.8.8 www.google.com +time=3 +tries=1

    echo "Quad9"
    dig +tcp @9.9.9.9 www.google.com +time=3 +tries=1

    sleep 5
done | tee /tmp/dns-upstream-test.log
The goal is simple in this little piece of automation. If only Cloudflare fails, I can narrow my investigation down to those upstream servers. If every upstream provider experiences failures at the same time, that points toward something in my network path instead of just a single DNS provider.
By writing everything to a log, I can also compare timestamps against Technitium logs and Uptime Kuma alerts. That is a much more useful information gathering session than trying to remember what happened hours earlier.
Why this changed how I think about DNS monitoring
Before this experience, I thought of DNS as either working or not working. But, after seeing these brief and transient issues, that thought is too simplistic as there can definitely be failures that happen and then self-correct. If you are like me, you like to get to the bottom of these types of things.
If you don’t, you may be plagued with intermittent failures and issues across your home lab or production environments. This can lead to “rabbit hole” troubleshooting sessions where you are chasing problems that actually are caused by intermittent DNS failures.
I think home labs these days are more sophisticated than ever before. Most are running things like Docker, Kubernetes, reverse proxies, and automation pipelines. DNS is one of the most important services that we run as everything else relies on it.
Wrapping up
As I’m writing this, the investigation is still ongoing on the transient issues. These haven’t caused a major issue as of yet. However, I am currently testing having changed my Techitium servers over to DNS over UDP instead of TCP to see if this might have a positive effect out across the Internet querying upstream DNS servers. Having these types of multi-layer tests on your DNS infrastructure can uncover a lot. Be sure to monitor things that are basic like port connectivity, web admin connectivity, etc. But, also be sure to test at an application level like I am doing here with Uptime Kuma as you may uncover things that you didn’t know were happening in your environment.
More in this topic

Google is updating how articles are shown. Don’t miss our leading home lab and tech content, written by humans, by setting Virtualization Howto as a preferred source.
About The Author

My first guess would have been that the upstream server was having issues. In theory, the query shouldn’t have failed, as it should have been handled by a different upstream. That’s why every system and every domain has multiple DNS servers configured.
I use AdGuard Home and have it configured to query multiple upstreams concurrently (Quad9, Cloudflare, and Google, all via DNS-over-HTTPS, and use the first one that replies. Technitium should have a setting for that too.
Daniel,
Nice insights here. I did switch my upstream servers over to UDP and the errors went away, but UDP is probably masking any issues along the way compared to TCP.
Brandon
Welcome to DNS! This service often works despite the way an administrator configures it, not because of it. It’s usually resilient to a fault which hides a plethora of sins. Going with UDP is a great move and honestly is the default configuration for DNS. TCP is generally a tailback mechanism for most things, especially where you aren’t doing DoH/DoT. Wireshark is also very effective in troubleshooting DNS where the issues aren’t as obvious because you get to see into the protocol in a way logs don’t always show. The hard part of course is catching something intermittent as always. Good luck.
Chris,
Nice that you can confirm this as well. I have found that all the issues have been solved since moving to UDP, as it would definitely be a more resilient and better protocol even when the path to upstream gets dirty. If I see issues again, definitely going to run some captures to see what is happening there.
Thanks Chris,
Brandon