Grafana Loki Configuration Syslog Server for Home Labs
If you are looking for a free and open-source Syslog server for your home lab or production environment, there is a great solution that you may not have heard about yet. It is Grafana Loki. It is a module that allows processing syslog data from various sources and feeding these into Grafana so that you can easily view log information and create dashboards from your log messages. Let’s look at Grafana Loki configuration as a syslog server for home labs.
What is Grafana Loki syslog?
Grafana Loki is a solution allowing you to send logs in any format from any source, providing an easy way have effective logging in your environment. The Grafana Loki solution breaks down as the following:
Grafana – dashboards and awesome visualizations to connect open-source solutions
Promtail – pulls logs from many sources, including local log files from the same host, server IPMI stats, systemd journal, GCP, AWS Cloudwatch, AWS EC2 and EKS, Windows event logs, application logs, Docker containers logging driver, wireless devices, Kubernetes, and Kafka
Loki – processes the logs and feeds these into Grafana for visualization using the Loki API v1 push
The Grafana Loki solution allows capturing syslog messages from your environment and serving as a remote syslog server, dedicated syslog forwarder, and syslog listener allowing users to point servers and other devices to Grafana Loki for log aggregation. Once Grafana Loki is configured correctly, Syslog devices immediately can send messages and hosts streaming syslog over the network can target the device logs of the Grafana Loki configuration.
Uses native syslog functionality in Linux server
In my configuration, I am using Ubuntu Server and using the native Rsyslog as the syslog server for listening as the syslog endpoint. You can also use syslog ng or another ietf syslog configuration so you can push logs from your devices to the Grafana loki syslog aio.
Syslog protocol
The syslog protocol is a standard configuration that most devices understand. We can also format syslog messages as we want so we can view these correctly when we collect data from remote servers. Grafana Loki can also serve as a syslog forwarded syslog ng logs to another syslog server.
Dashboards
Using the functionality of Grafana, we can also create loki dashboard displays and an overview dashboard to display information from the syslog collector. You can create a starting dashboard that is displayed when you visualize logs from the solution.
Home lab dashboards
If you have home lab servers you want to monitor and aggregate logs from, this is a great solution for a metrics person and those who want to have more detailed configuration, troubleshooting, and KPIs from their environment.
If you are troubleshooting difficult issues in the environment, like dropped connections, high dhcp retries, host metrics, performance issues, or others, having Syslog information is vital. You can use this solution to create prebuilt performance overview dashboards.
Installing Grafana Loki
There are several steps to installing Grafana Loki. These include the following setup details:
Installing Loki
Installing Promtail configuration
Configuring your syslog server configuration
Adding the Loki data source in Grafana
Let’s look at more setup details.
Install Grafana and enabling Grafana Server
First, let’s install some prerequisites to install:
sudo apt install -y gnupg2 curl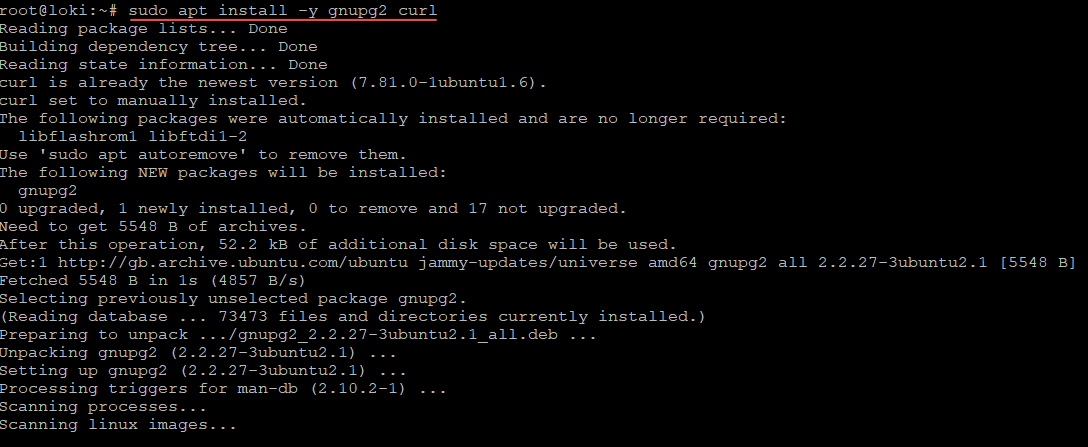
Install the Grafana GPG key
Install the Grafana Server gpg key and run an update:
curl https://packages.grafana.com/gpg.key | sudo apt-key add -
sudo add-apt-repository "deb https://grafana.com/docs/grafana/latest/setup-grafana/installation/debian/ stable main"
sudo apt-get update -y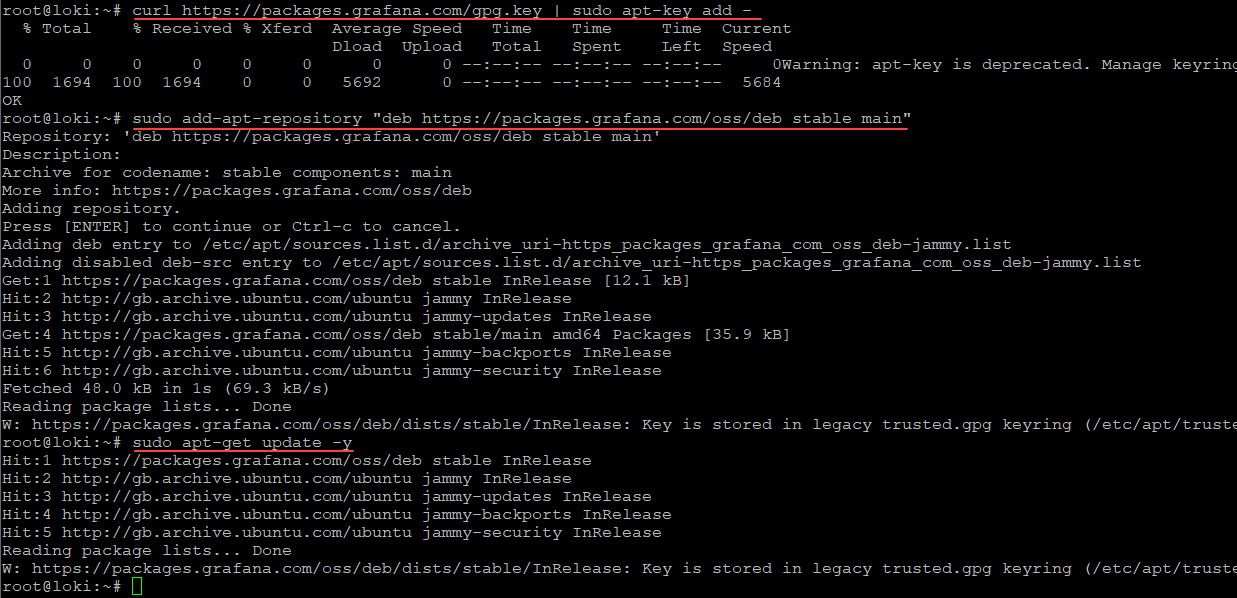
Install Grafana Server
Install Grafana and enable Grafana server:
sudo apt -y install grafana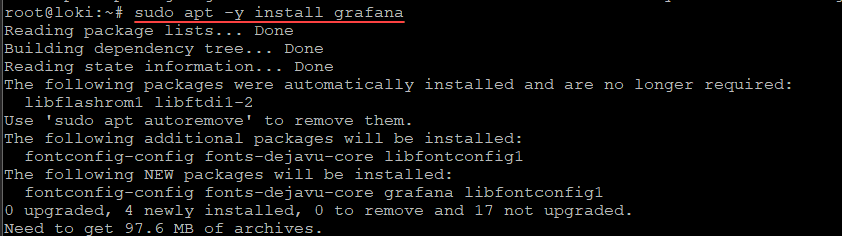
sudo systemctl start grafana-server
sudo systemctl enable grafana-server
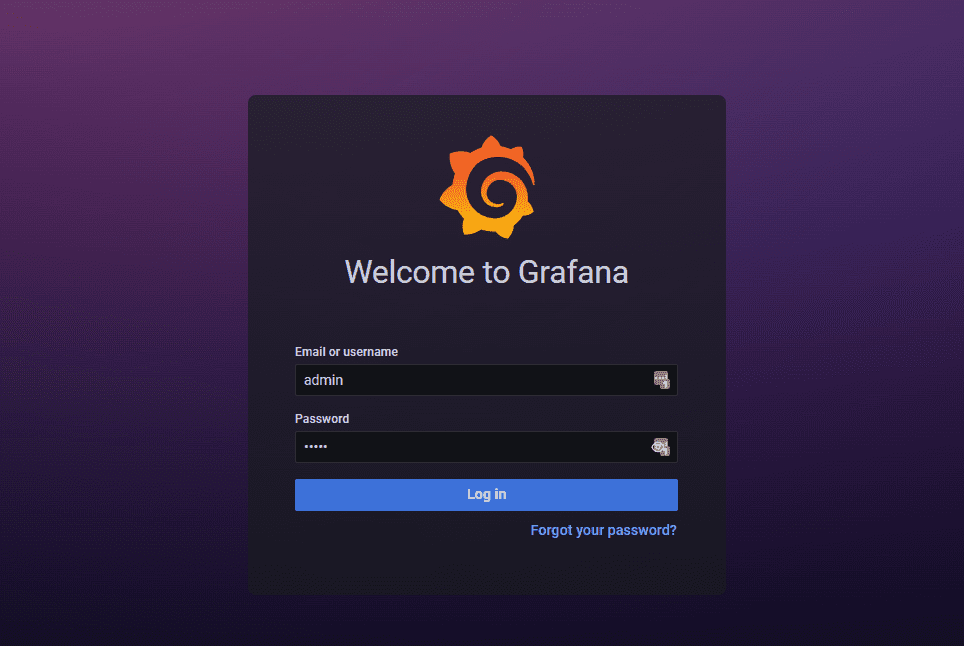
At this point you should be able to log into
Install Loki
Next, let’s install Loki. To do that, we simply curl the zip file that we need. Then unzip the file and change the mode of execution.
Download and unzip Loki
curl -O -L "https://github.com/grafana/loki/releases/download/v2.6.1/loki-linux-amd64.zip"
unzip "loki-linux-amd64.zip"
chmod a+x loki-linux-amd64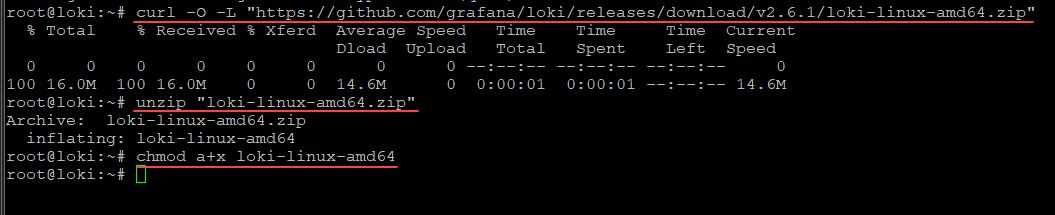
Install Promtail
Promtail is the syslog ingestor. Its installation is just as easy as the Loki installation. It involves downloading the .ZIP file, extracting, and adding execution perms.
Download and unzip Promtail
curl -O -L "https://github.com/grafana/loki/releases/download/v2.6.1/promtail-linux-amd64.zip"
unzip promtail-linux-amd64.zip
chmod a+x promtail-linux-amd64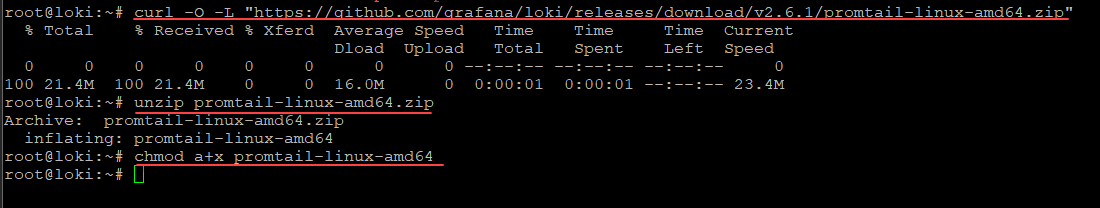
Moving the executables and creating configuration files
Next, we will move the executables that we have extracted and setup execute permissions on to the appropriate folders. Then we will create configuration files for both Loki and Promtail.
mkdir /etc/loki

mkdir /etc/promtail

mv loki-linux-amd64 /usr/local/bin/loki

mv promtail-linux-amd64 /usr/local/bin/promtail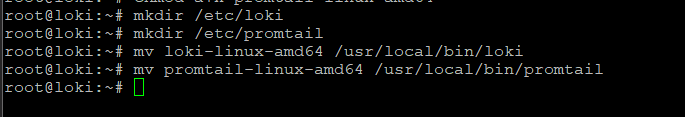
Now, let’s create the configuration files we need for both Loki and Promtail configurations to be valid
The config file for each will be created in /etc/loki and etc/promtail respectively:
Lok configuration (loki-local-config.yaml)
auth_enabled: false
server:
  http_listen_port: 3100
ingester:
  lifecycler:
    address: 127.0.0.1
    ring:
      kvstore:
        store: inmemory
      replication_factor: 1
    final_sleep: 0s
  chunk_idle_period: 5m
  chunk_retain_period: 30s
schema_config:
  configs:
  - from: 2020-05-15
    store: boltdb
    object_store: filesystem
    schema: v11
    index:
      prefix: index_
      period: 168h
storage_config:
  boltdb:
    directory: /tmp/loki/index
  filesystem:
    directory: /tmp/loki/chunks
limits_config:
  enforce_metric_name: false
  reject_old_samples: true
  reject_old_samples_max_age: 168h
  max_entries_limit_per_query: 500000
# By default, Loki will send anonymous, but uniquely-identifiable usage and configuration
# analytics to Grafana Labs. These statistics are sent to https://stats.grafana.org/
#
# Statistics help us better understand how Loki is used, and they show us performance
# levels for most users. This helps us prioritize features and documentation.
# For more information on what's sent, look at
# https://github.com/grafana/loki/blob/main/pkg/usagestats/stats.go
# Refer to the buildReport method to see what goes into a report.
#
# If you would like to disable reporting, uncomment the following lines:
#analytics:
#  reporting_enabled: false
Promtail configuration (promtail-local-config.yaml)
server:
  http_listen_port: 9080
  grpc_listen_port: 0
positions:
  filename: /tmp/positions.yaml
clients:
  - url: http://localhost:3100/loki/api/v1/push
scrape_configs:
  - job_name: syslog
    syslog:
      listen_address: 0.0.0.0:1514
      labels:
        job: syslog
    relabel_configs:
      - source_labels: [__syslog_message_hostname]
        target_label: host
      - source_labels: [__syslog_message_hostname]
        target_label: hostname
      - source_labels: [__syslog_message_severity]
        target_label: level
      - source_labels: [__syslog_message_app_name]
        target_label: application
      - source_labels: [__syslog_message_facility]
        target_label: facility
      - source_labels: [__syslog_connection_hostname]
        target_label: connection_hostname
Create services for both Loki and Promtail for Syslog messages
Now, let’s create services for both Loki and Promtail. Create the following in /etc/systemd/system
Create the file loki.service containing:
[Unit]
Description=Loki service
After=network.target

[Service]
Type=simple
User=root
ExecStart=/usr/local/bin/loki -config.file /etc/loki/loki-local-config.yaml

[Install]
WantedBy=multi-user.target
Create the file promtail.service containing:
[Unit]
Description=Promtail service
After=network.target
[Service]
Type=simple
User=root
ExecStart=/usr/local/bin/promtail -config.file /etc/promtail/promtail-local-config.yaml
[Install]
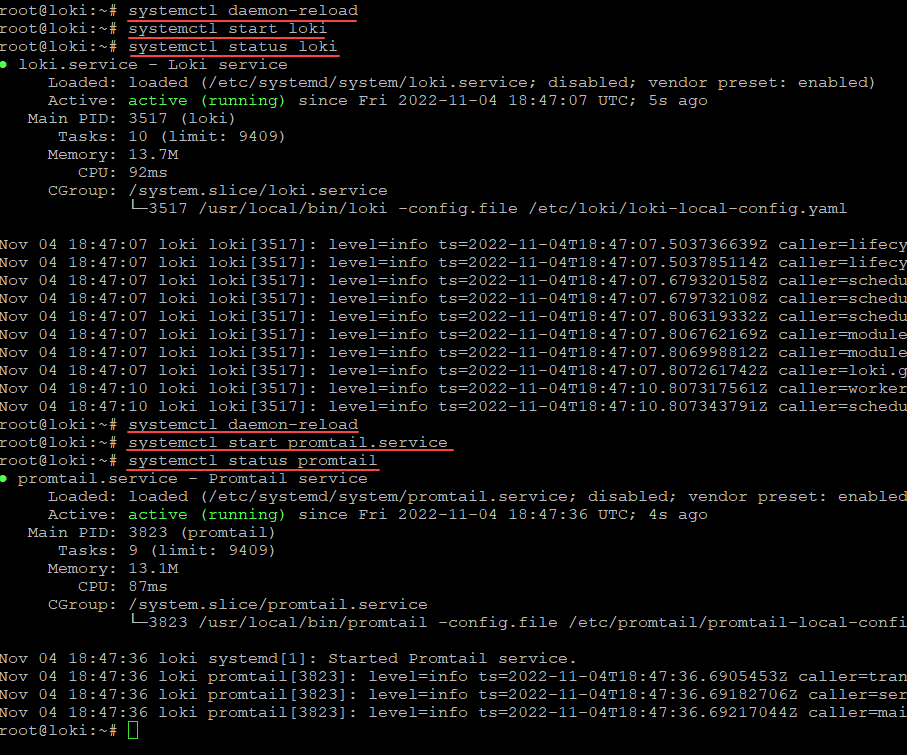
WantedBy=multi-user.targetNow reload daemon and start the services which starts Loki and the promtail process. This will run promtail.
Configuring Rsyslog for forwarding to Promtail Remote Syslog Server:
Now, we need to configure the Rsyslog service to forward our messages into Promtail. this creates the transport TCP port 1514 for capturing logs and feed into the syslog promtail job.
Add the following to the top of your /etc/rsyslog.config file:
#################
#### MODULES ####
#################

module(load="imuxsock") # provides support for local system logging
#module(load="immark")  # provides --MARK-- message capability

# provides UDP syslog reception
module(load="imudp")
input(type="imudp" port="514")

# provides TCP syslog reception
module(load="imtcp")
input(type="imtcp" port="514")

# provides kernel logging support and enable non-kernel klog messages
module(load="imklog" permitnonkernelfacility="on")

# Forward everything
*.*  action(type="omfwd"
       protocol="tcp" target="127.0.0.1" port="1514"
       Template="RSYSLOG_SyslogProtocol23Format"
       TCP_Framing="octet-counted" KeepAlive="on"
       action.resumeRetryCount="-1"
       queue.type="linkedlist" queue.size="50000")
When you are finished with this step, restart your Rsyslog service.
sudo service rsyslog restartAdd the datasource in Grafana
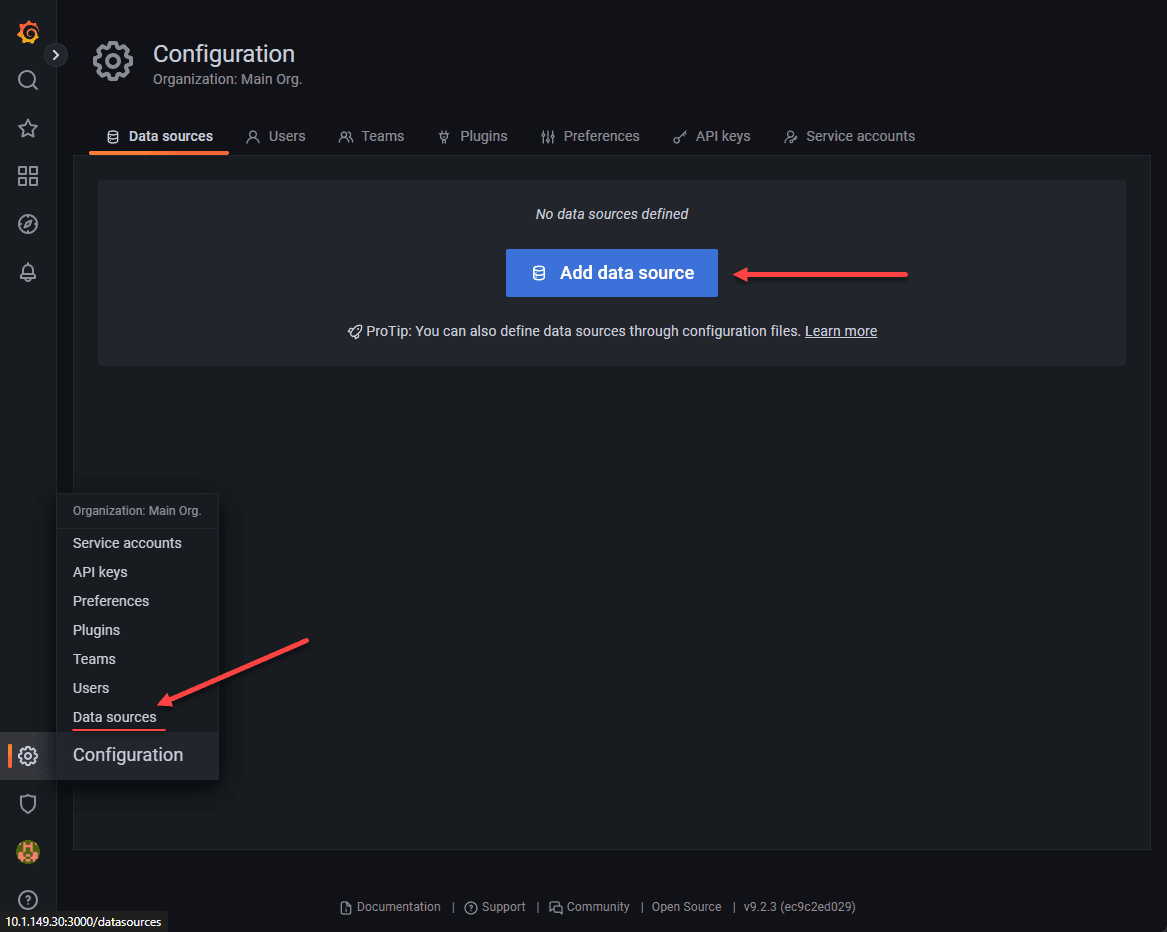
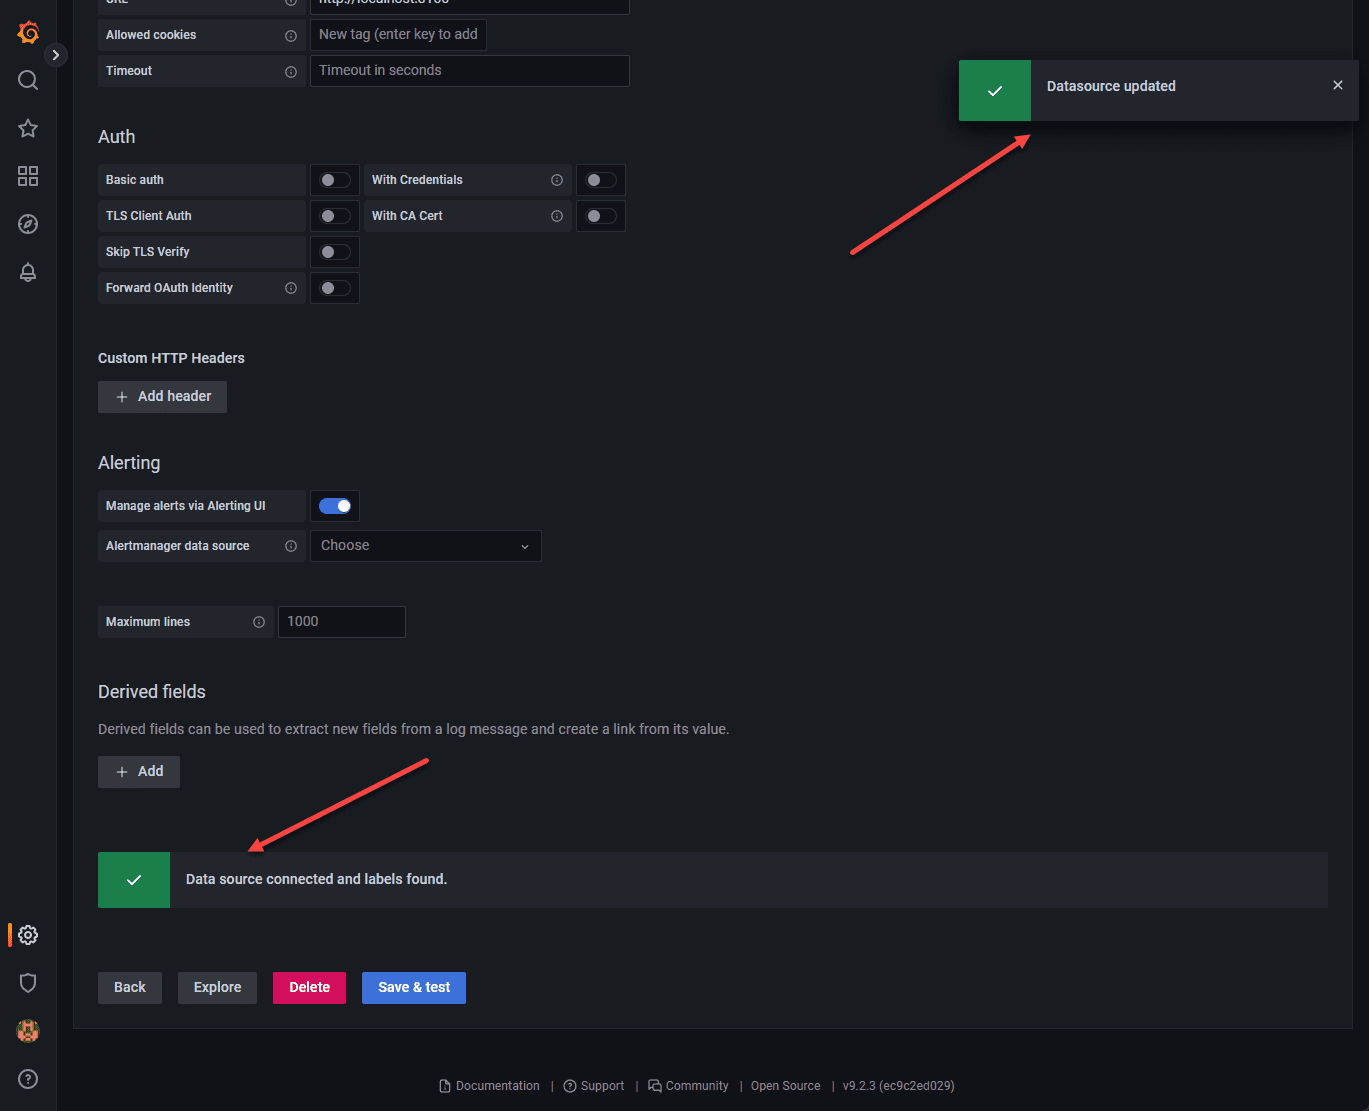
Now, the final step is just adding our datasource in Grafana. Navigate to the settings cog in the bottom left-hand corner. Choose Data sources > Add data source.
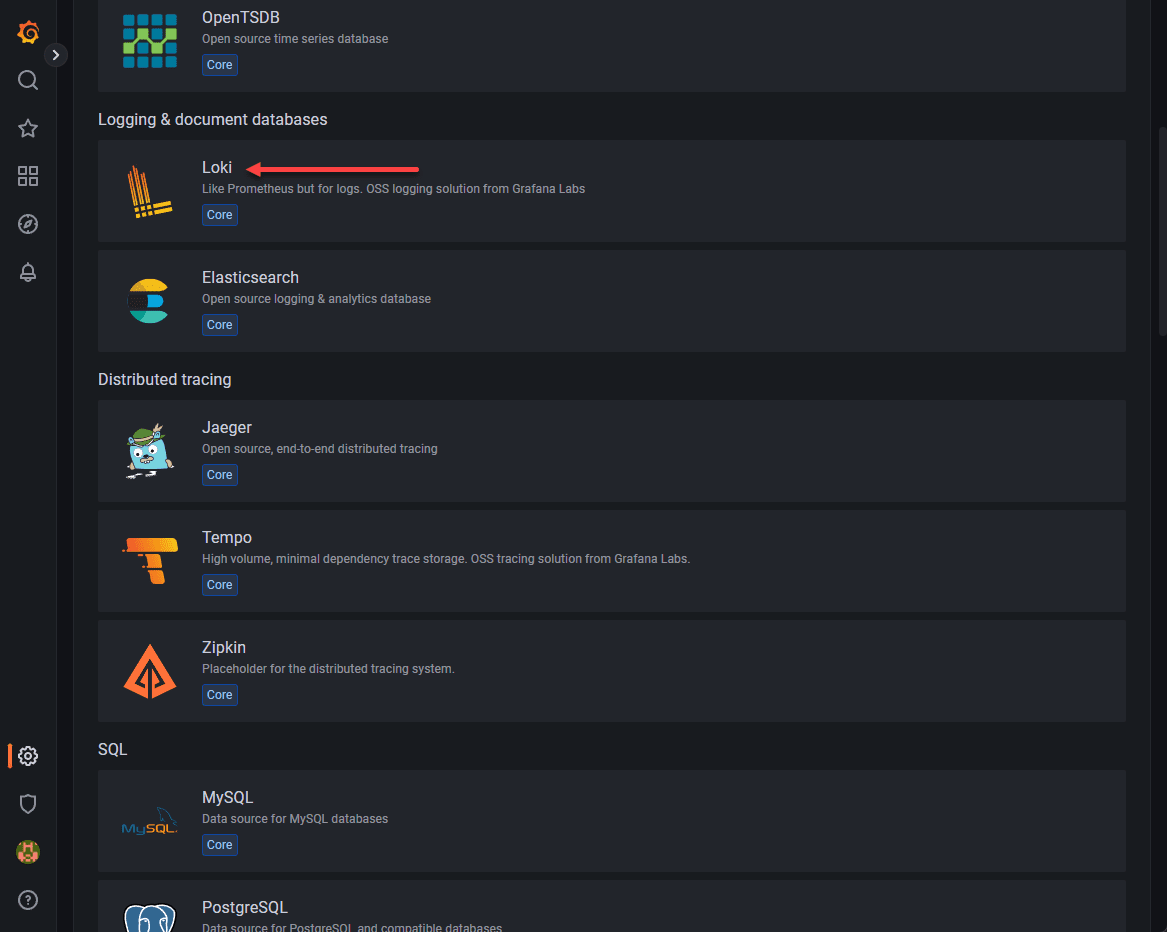
Select Loki for the datasource.
We point this to the 3100 loki API v1 of the localhost as shown.
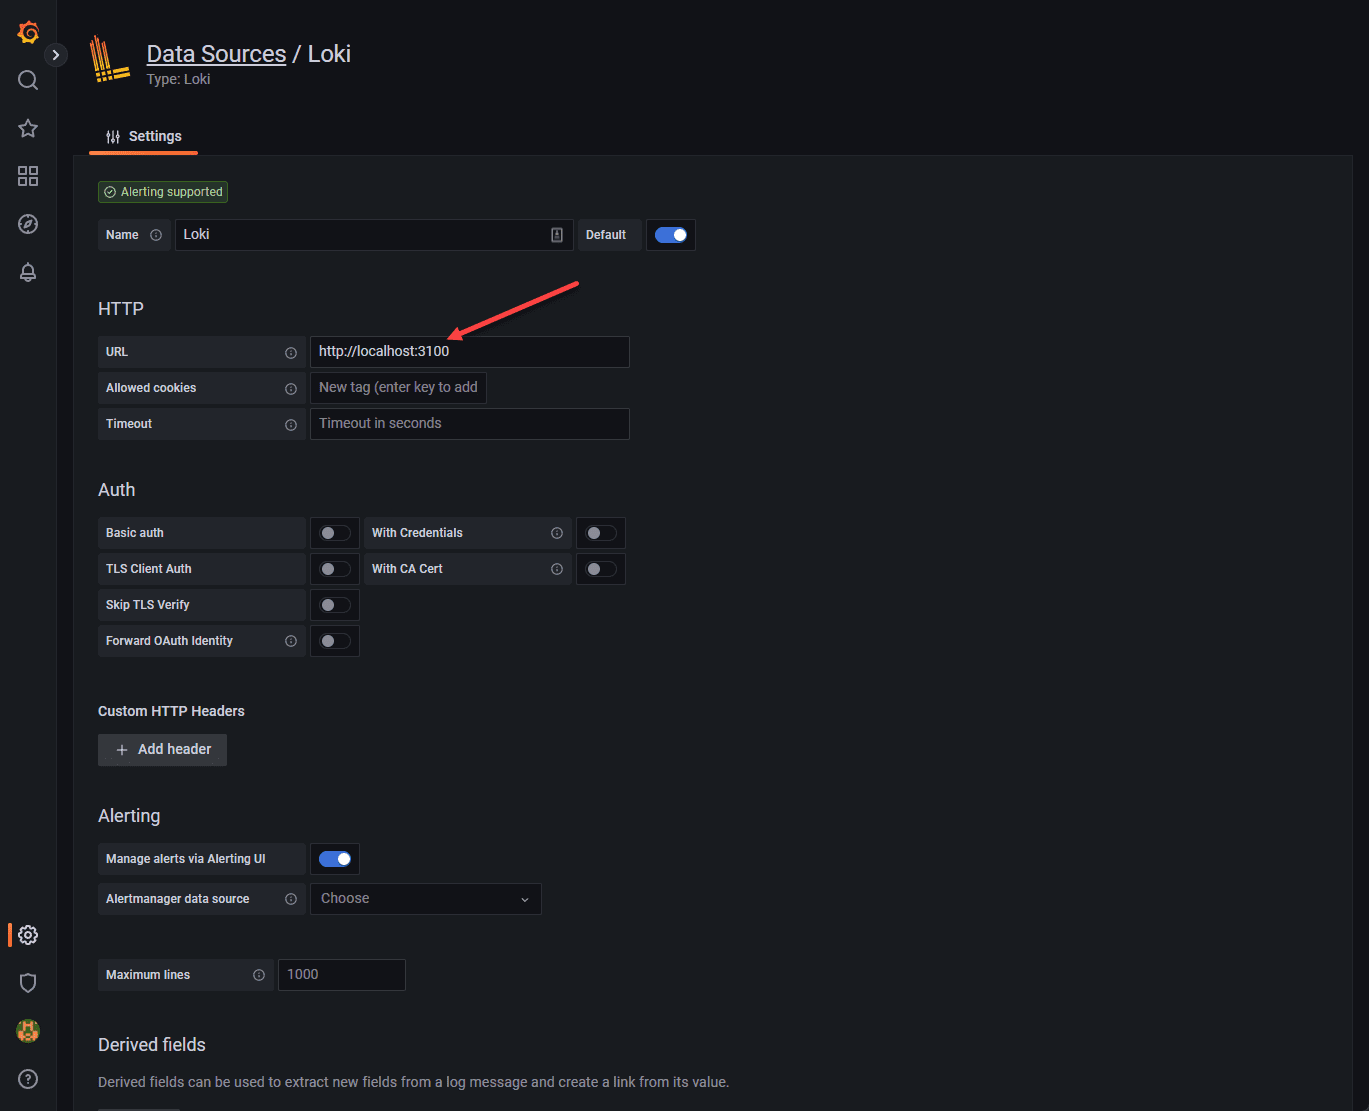
Here we save and test the connection.

You should see the green status meaning it is connected and working properly.
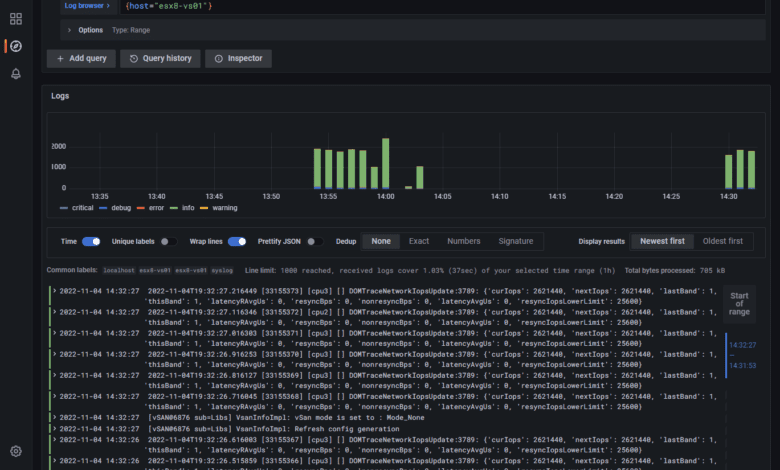
If we now navigate to the Explore section, we should start to see the labels coming in if we have pointed devices to the Grafana Loki syslog. Here I have pointed just a few hosts, ESXi hosts, to the server.
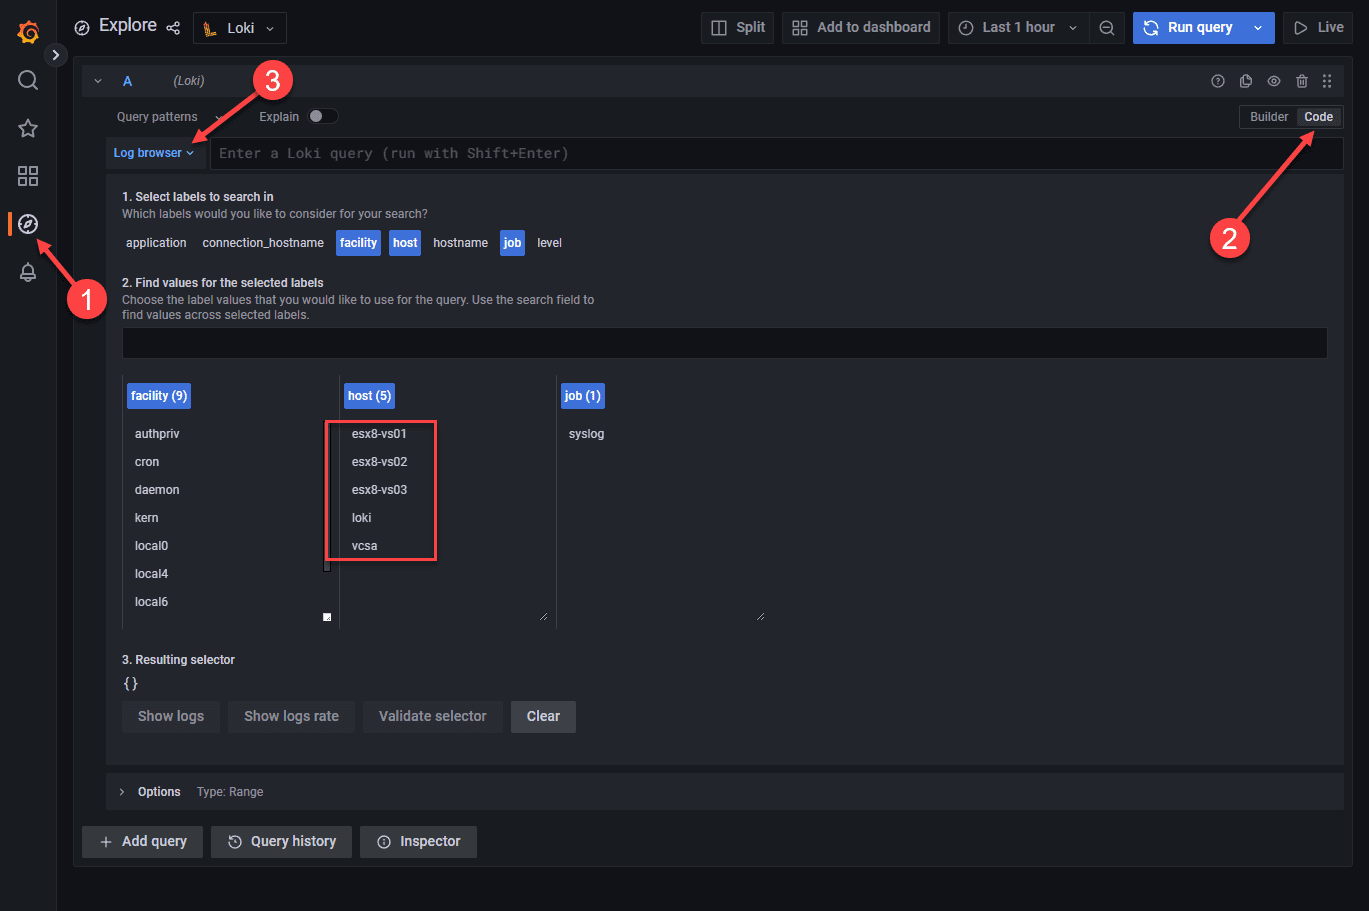
Here I am choosing the ESXi host that I have configured pointing to the Grafana Loki solution.

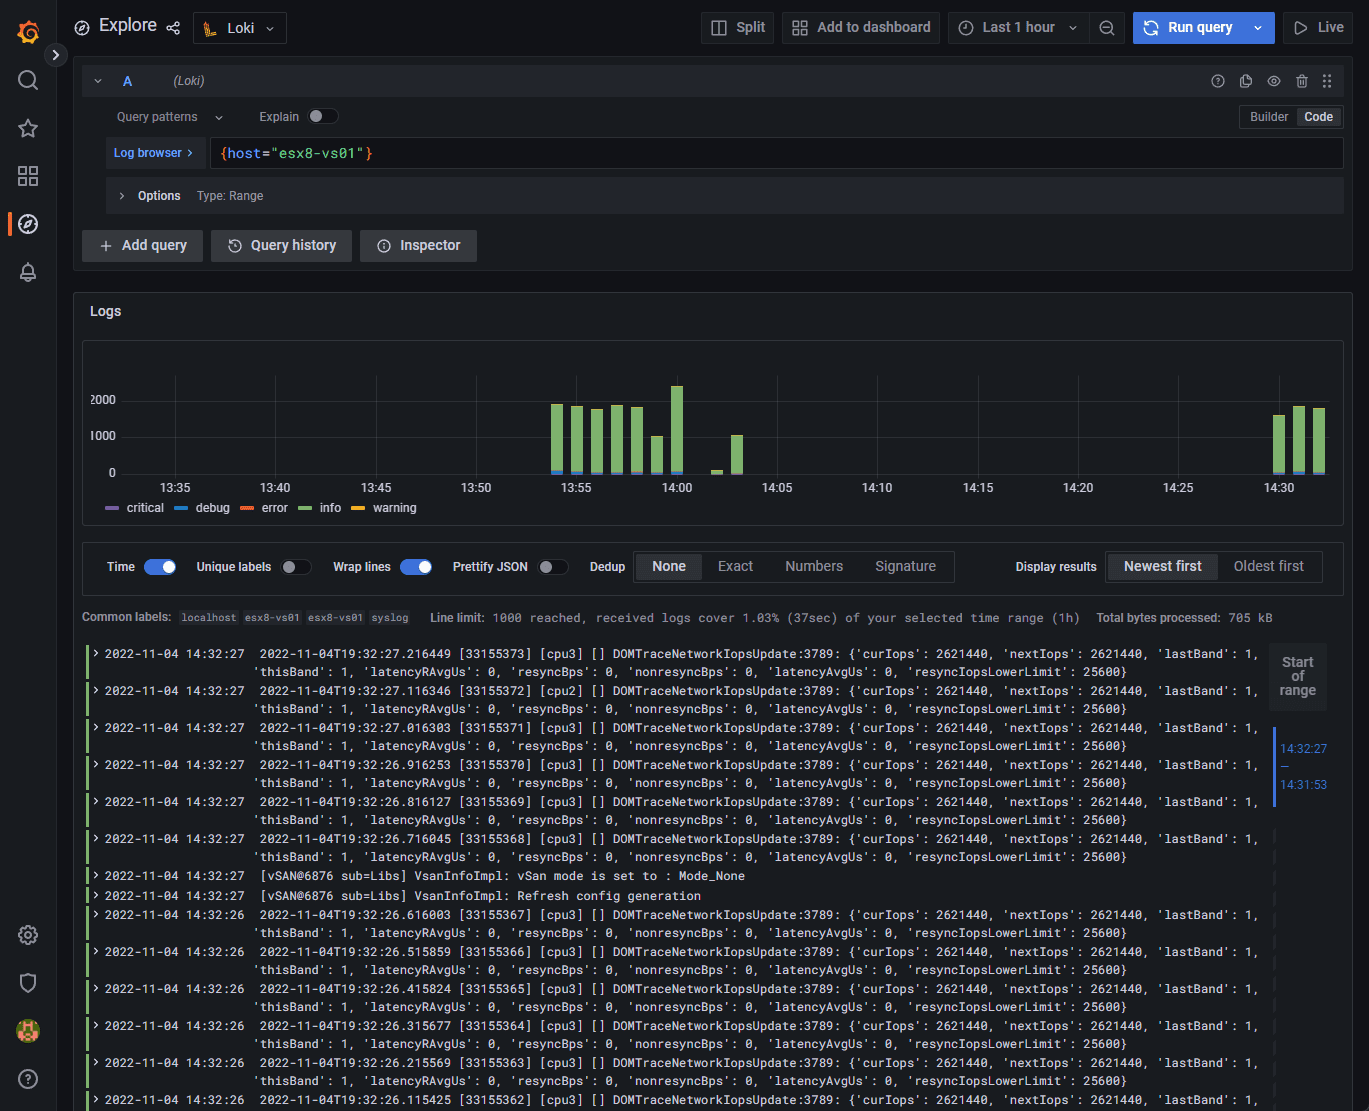
Now, we get super cool logs displayed in the normal beautiful format of Graphana.
Wrapping Up
If you are looking for a super cool, free and open-source solution for logging, Grafana Loki is an awesome solution that can effectively capture and display syslogs using Grafana Loki configuration, provide searching, and the ability to create dashboards easily. I have to say I found gaps in the information provided and had to piece together everything you see in the blog post to get things working correctly. Hopefully, my efforts will help anyone else get up to speed quickly. Check it out on the official documentation here:
Grafana Loki OSS | Log aggregation system
If you want to take a look at more specific vSphere logging solutions, check out my post recently covering vSphere Log Insight: vRealize Log Insight Syslog Configuration – Virtualization Howto


Thank you, really concise and to point!
It got me going with my first rsyslog dashboard.
My grafana and influxdb were not installed on the monitored server (proxmox) but in a lxc container.
From what I understand, Loki is supposed to be installed locally on the monitored server ? What about promtail ?
Anyway, thank you for this how-to !