When it comes to open-source monitoring, two tools come up quite often for building out monitoring stacks for things like Kubernetes monitoring (storage, scaling, performance, etc), cloud monitoring, application metrics, and many others in your environment – InfluxDB and Grafana. There are others like telegraf, chronograf, and others that you will see referenced as well, but we will stick to InfluxDB Grafana docker-compose configuration in this article.
Table of contents
What is InfluxDB?
InfluxDB is one of the best-known open-source solutions for efficiently handling time series data. It is an open-source database optimized for high-speed reading and writing of time series data. These capabilities make it an ideal choice for applications in real-time analytics and IoT sensor data management, network telemetry data and information, alerting, etc.
It is also used in incident response management solutions, DevOps configurations, etc. Overall, it is great for monitoring.
Why Choose InfluxDB for Data Storage?
InfluxDB’s time series database is designed with a unique query language called Flux. This query language allows for the creation of flux queries to view the data as you need. The flux query is very powerful and allows extracting the data granularly. It can handle massive data influxes common in monitoring and IoT real-time analytics.
InfluxDB Cloud
There is also InfluxDB Cloud, the cloud-based version of InfluxDB. InfluxDB cloud use offers scalability and flexibility, ideal for organizations seeking cloud solutions. This allows for managing data across multiple data sources, a boon for complex infrastructures.
What is Grafana?
Grafana is a visualization platform that turns the data stored in InfluxDB into human-readable charts and other visualizations. Grafana enterprise and Grafana cloud versions offer additional features tailored for businesses.
Diverse Plugins for Enhanced Functionality
Grafana is not just about visualization; it’s an entire observability suite. With plugins like Grafana Loki for logging, Grafana Mimir for scalable metrics, Grafana Pyroscope for performance monitoring, and Grafana Tempo for distributed tracing, it covers all aspects of application observability.
There is also Grafana Beyla, which is an eBPF-based application auto-instrumentation tool to easily get started with Application Observability. There is the Grafana Agent as well that provides a vendor-neutral, telemetry collector. Also, Grafana OnCall is an easy-to-use on-call management tool. So there are many plugins and features in addition to the basica grafana functionality.
Grafana Dashboards
There are also many free and open source dashboards you can download for free from the Grafana community content site, including documentation for these. We will take a look at one of these dashboards and details below.
The Docker-Compose Setup
We can easily use docker-compose to configure a working stack for InfluxDB and Grafana. In your docker-compose.yml file, you’ll define services for both InfluxDB and Grafana. The InfluxDB service includes settings for the default bucket and user credentials, while the Grafana service outlines the configuration for accessing the Grafana UI and connecting it with the InfluxDB data source.
Note the following Docker Compose code for standing up both containerized apps in a deployment stack for this tutorial. Below we are creating a new network for the container stack for IP address configuration.
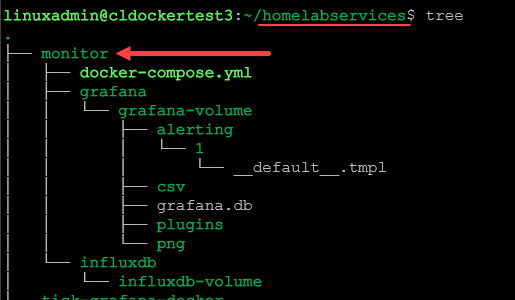
On my Linux Docker host, I created a “homelabservices” folder for provisioning services, cloning Github repository files on the system, and organizing resources on disk, like installation files such as .env files that hold variables. For me this helps to avoid issues and keep everything organized in their own directory if you have a lot of projects.
You will also notice there are no depends_on section configurations since the containers can spin up independently before we create the integration.
For reference, I used this really good post to create my initial configuration and modified it for my lab environment: Monitoring Proxmox with InfluxDB and Grafana (tcude.net).
services:
  grafana:
    image: grafana/grafana
    container_name: grafana
    restart: always
    ports:
      - 3000:3000
    networks:
      - monitor
    volumes:
      - "./grafana/grafana-volume:/var/lib/grafana"
    user: "1001"
  influxdb:
    image: influxdb:latest
    container_name: influxdb
    restart: always
    ports:
      - 8086:8086
      - 8089:8089/udp
    networks:
      - monitor
    volumes:
      - "./influxdb/influxdb-volume:/var/lib/influxdb"
networks:
  monitor:
Save this to a docker-compose.yml configuration file and run the command:
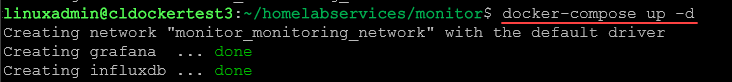
docker-compose up -dThis will pull down the images from the Docker repo and provision the containers for the app.
To check the status of the containers, run the following command:
docker-compose ps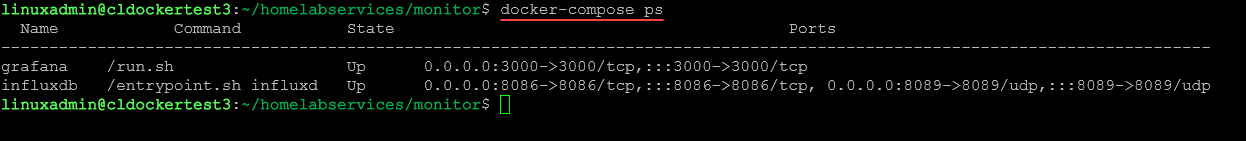
Troubleshooting your Docker Compose containers
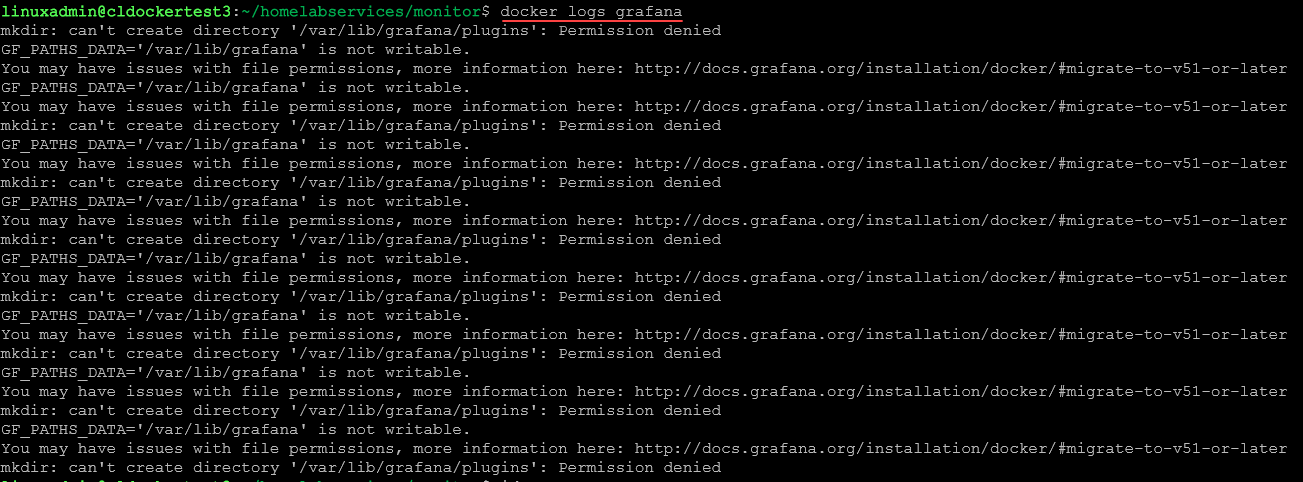
If you run the docker-compose ps command and find you have Docker containers that are not starting, a timeout, or are in the state of restarting, then you need to investigate why. One of the best commands to investigate and troubleshoot is the command:
docker logs <container name>By running the command, I could see that I had a permissions problem with my Grafana container the first go-around as it needs to have access to the directory in order to place plugin files, etc.
I needed to get the ID of the user I was running the Docker-Compose command under. To do that, use the command:
id -uThe container started normally after adding the user ID to the Docker-Compose code.

Configuring InfluxDB
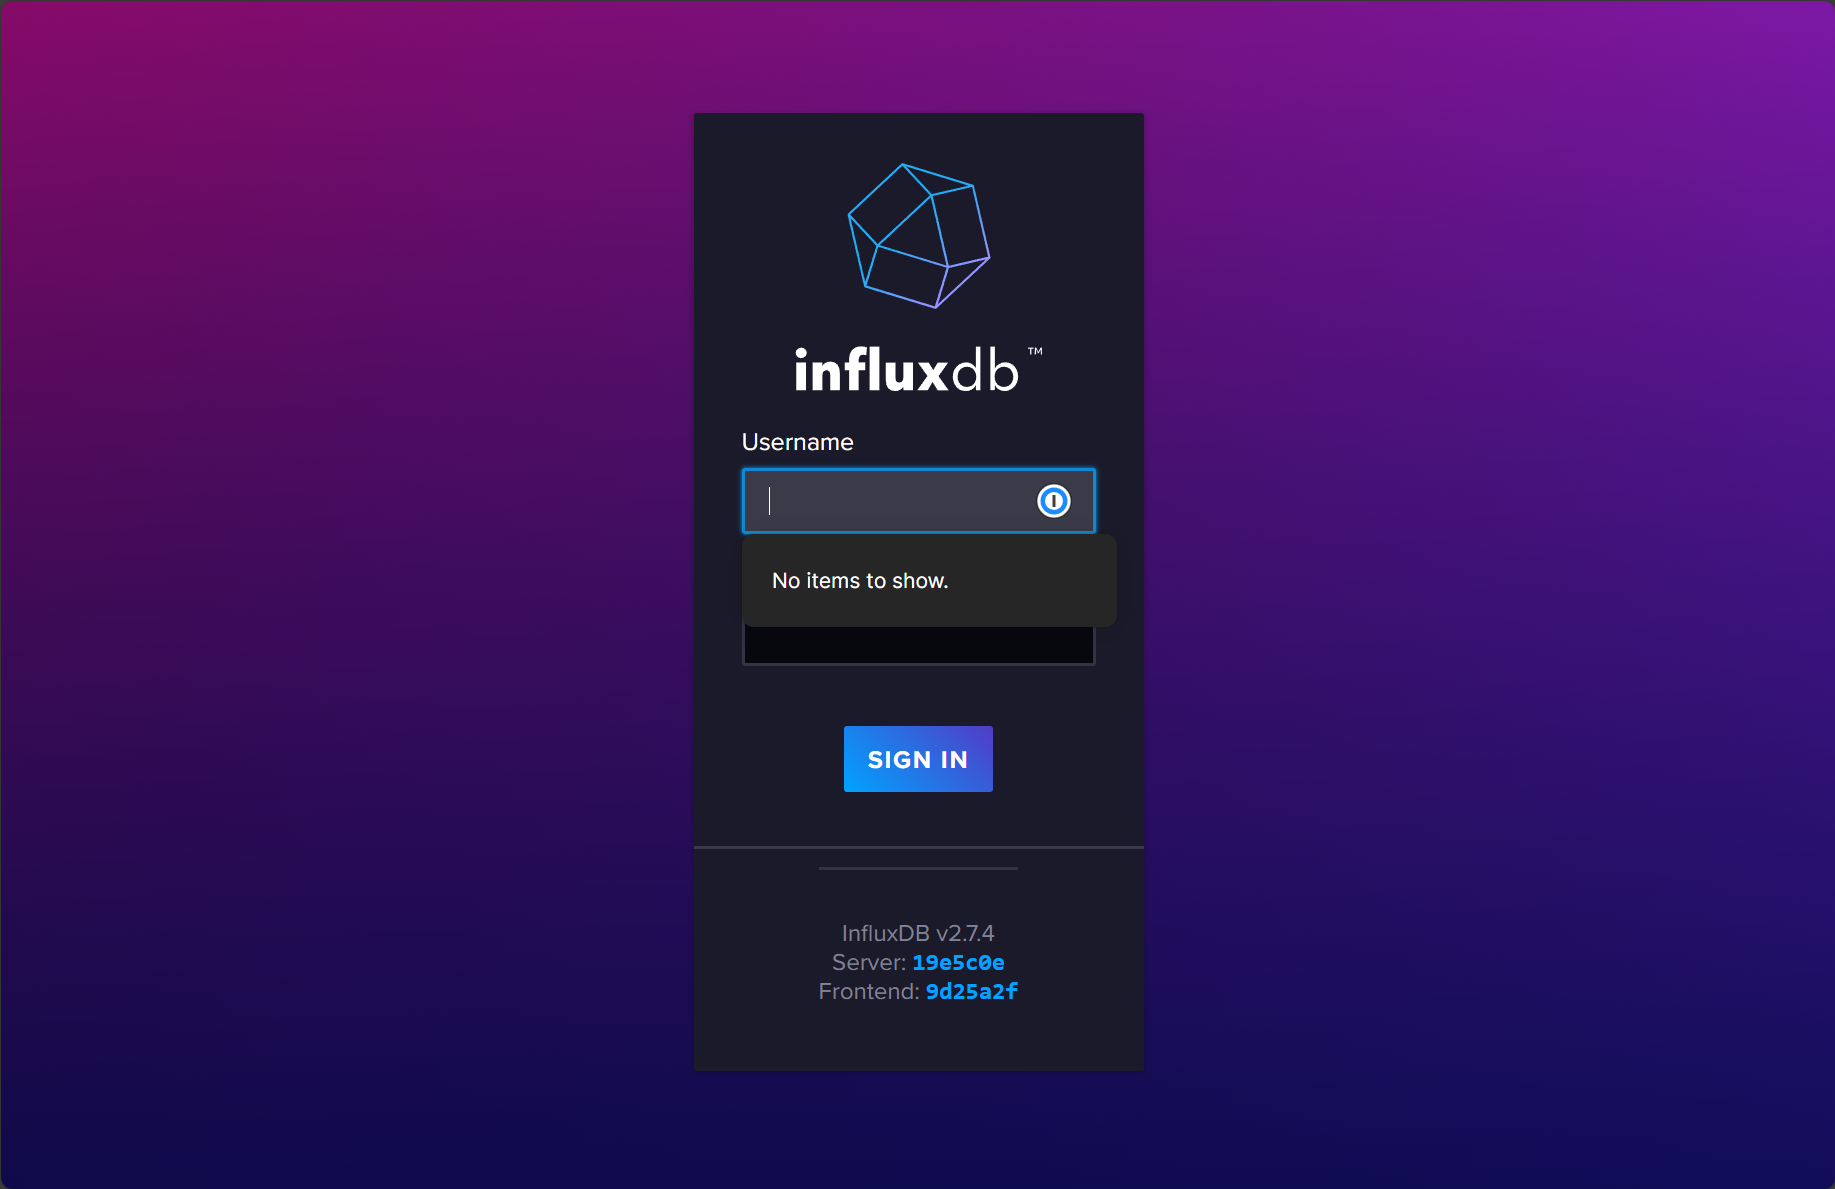
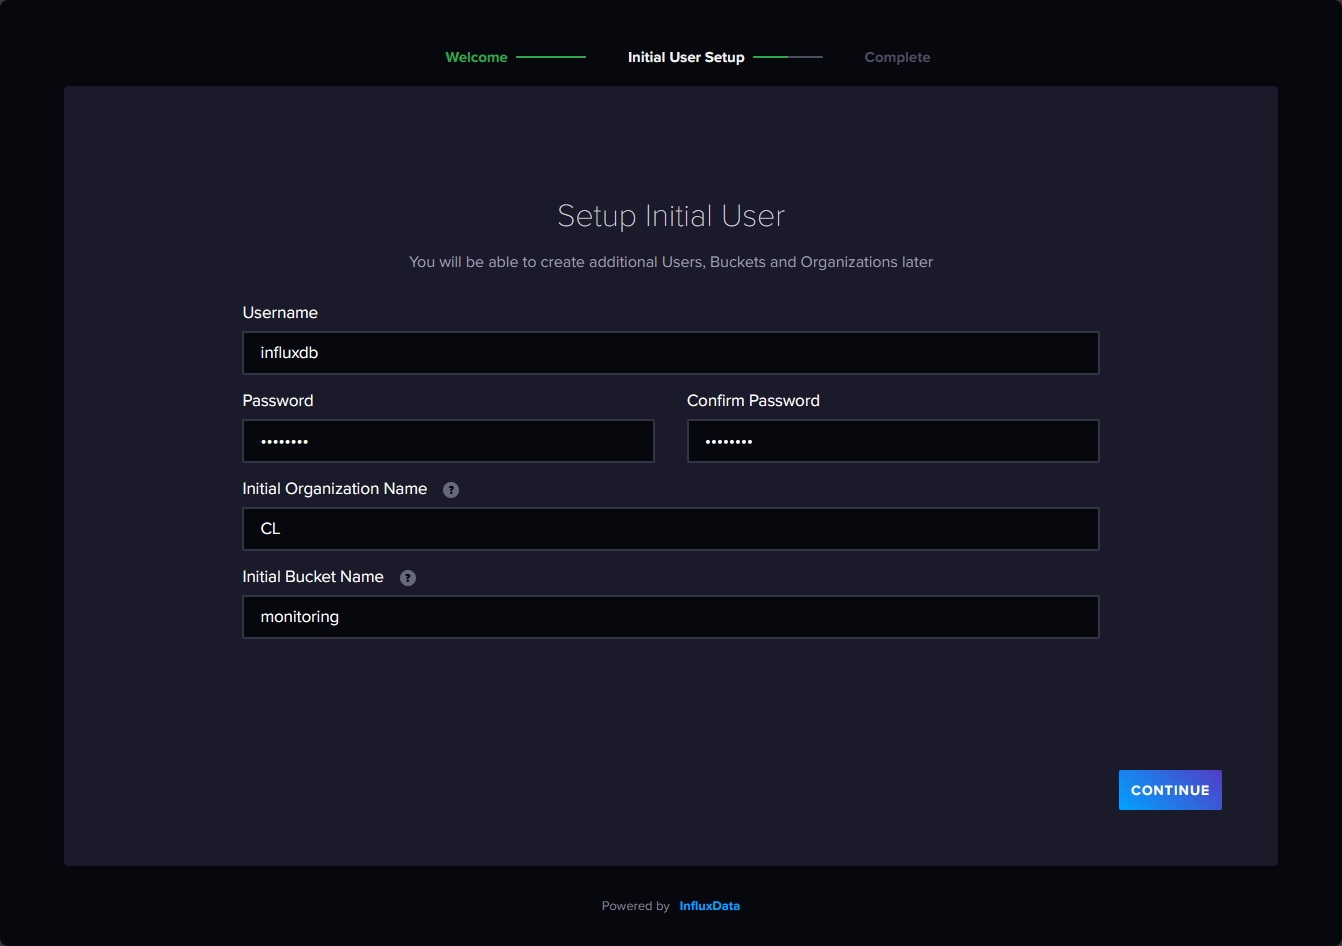
After spinning up the InfluxDB container as part of the Docker-compose code, one of the first steps is running through the initial configuration wizard.
On the initial configuration page, you need to configure a username, a password, confirm the password, initial organization name, and finally an initial bucket name. Click Continue.
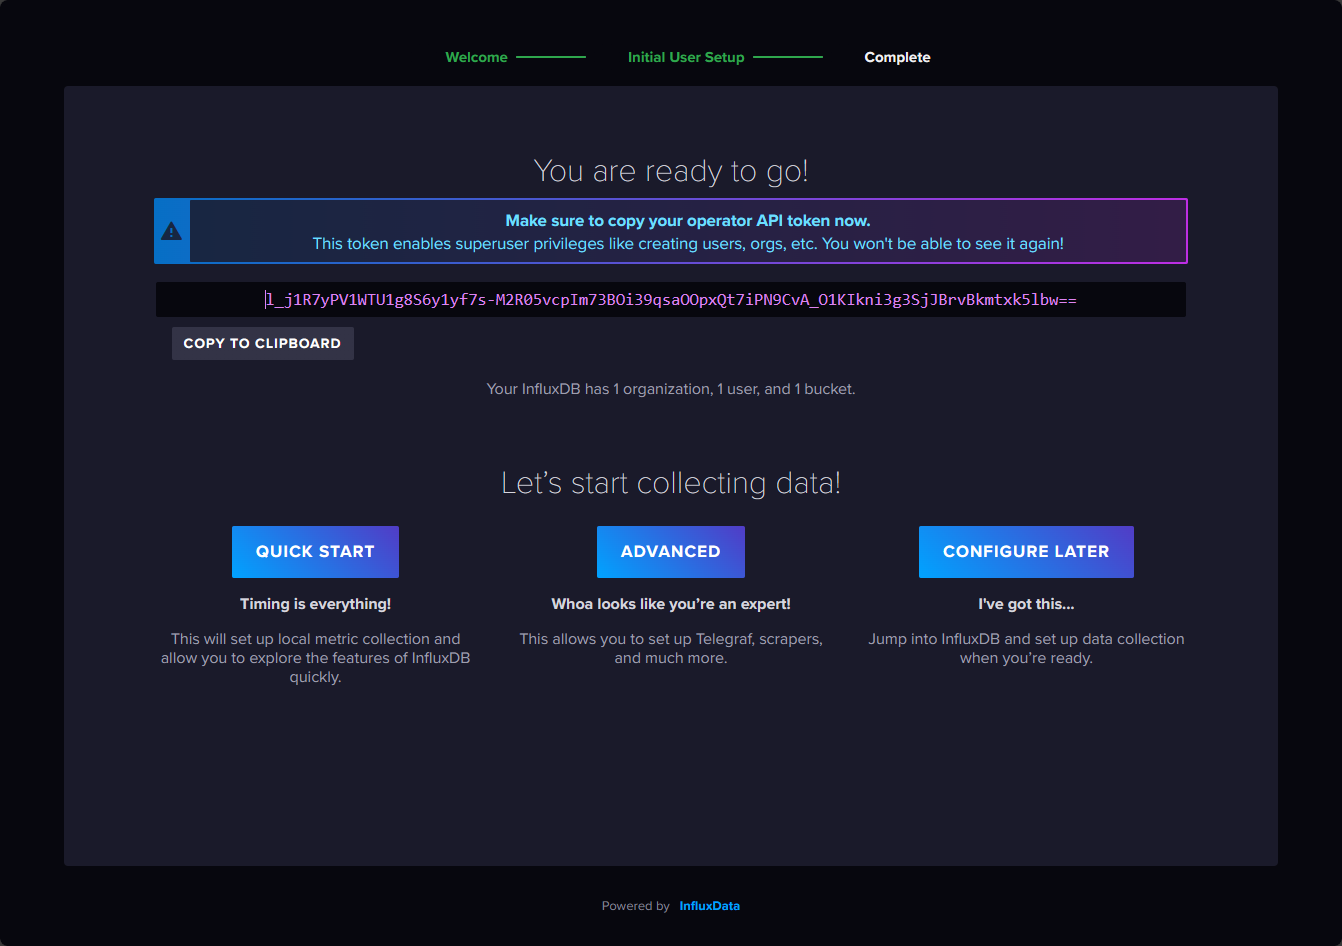
After you click continue, you will see the default API access token created for accessing influxdb data, which is an admin user. Influx v2 defaults to token authentication, so you will need to ensure your integration can pass the API token to InfluxDB. API tokens are a more secure way to connect to your systems.
Below, I selected the Configure Later option as we will manually configure the connection to stream data to Influx a bit later.
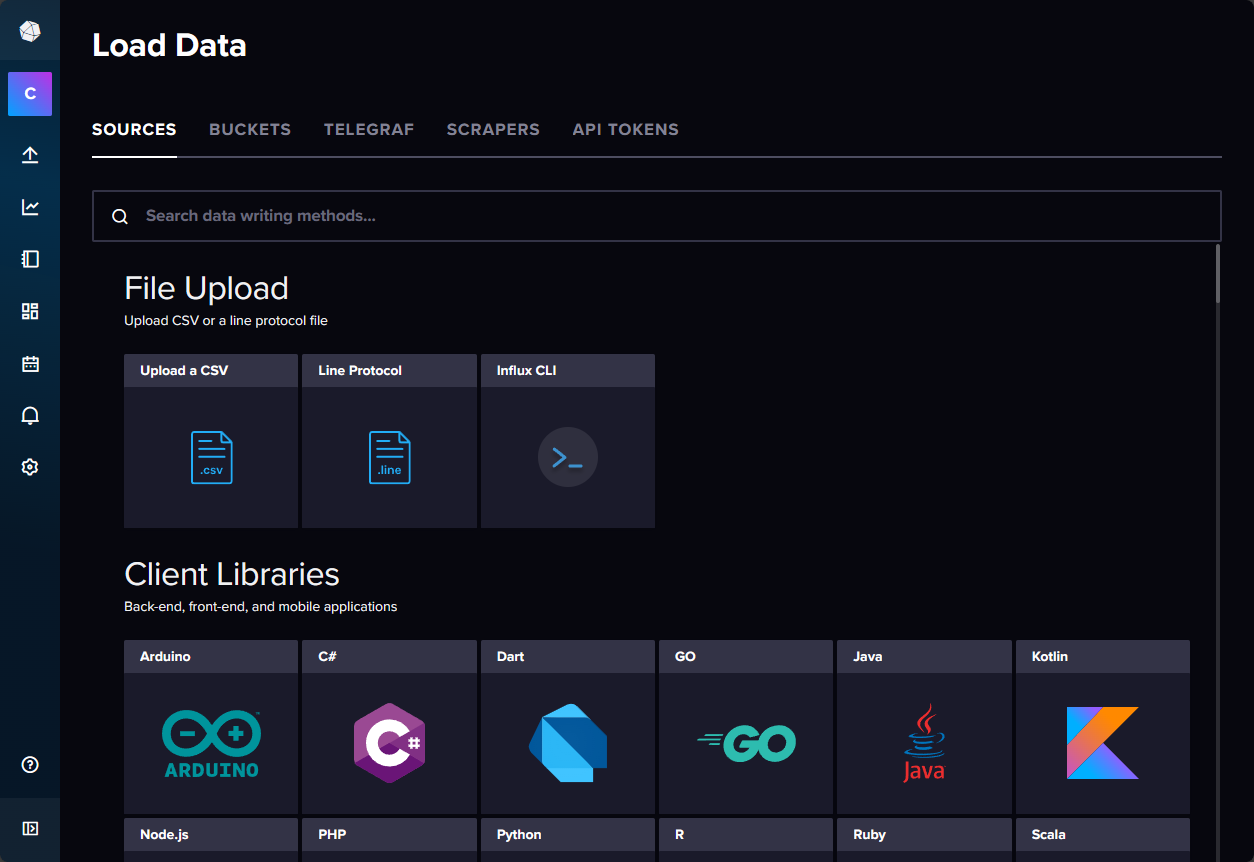
After this, you will log in to the solution. You will see the option to load data from various sources. I will show a simple example of a project you can spin up in the home lab.
Once InfluxDB and Grafana are up and running, the next step is to configure them for optimal performance and connectivity.
Giving InfluxDB some data
After getting InfluxDB setup and initially configured with an API token, bucket, etc, We need to give it some data to work with. One of the simple little projects you can use an InfluxDB and Grafana stack for is monitoring your Proxmox hosts.
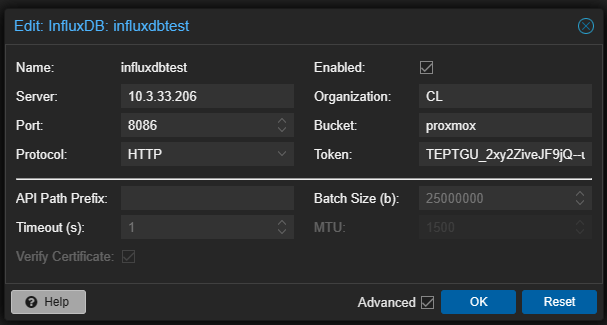
In Proxmox, you navigate to your Datacenter > Metric Server > Add > InfluxDB.
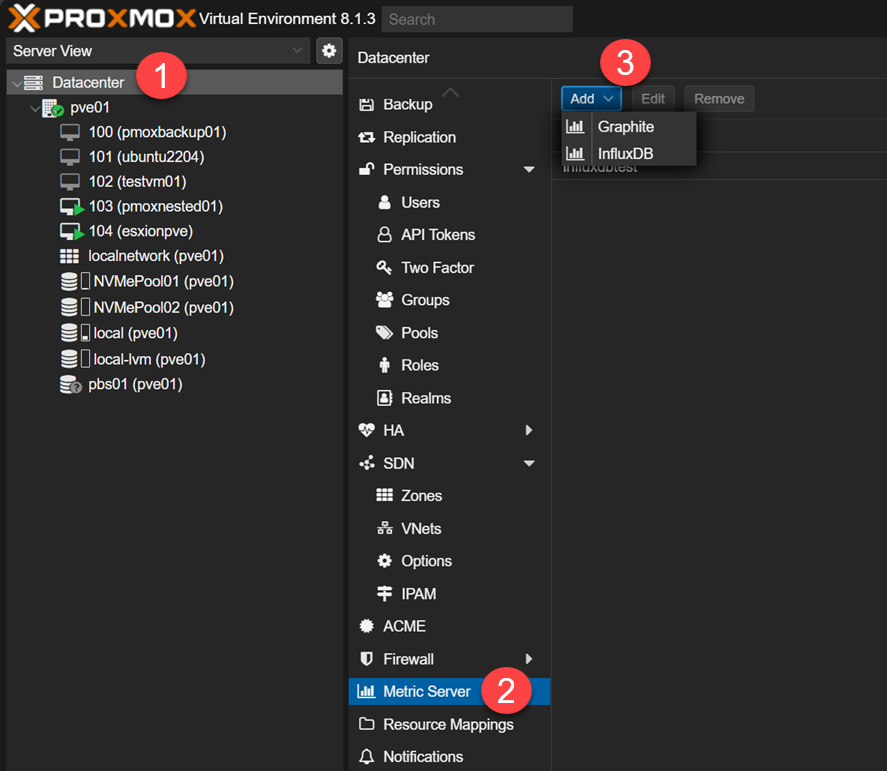
This will launch the Edit InfluxDB dialog box where we can populate the InfluxDB configuration. The fields to note are the following:
- Server – Your InfluxDB host (your Docker host machine address if you are running in Docker as we have shown)
- Port – 8086 for HTTP, 8089 for UDP
- Protocol – Choose your protocol here. If you choose HTTP, you can populate your Organization and Bucket in Proxmox.
- Organization – Your organization configured in InfluxDB
- Bucket – The bucket you want to use to stream to InfluxDB
- Token – Token is the token you initially created or you can also create another token for authentication as well.
Verify data is making it to InfluxDB
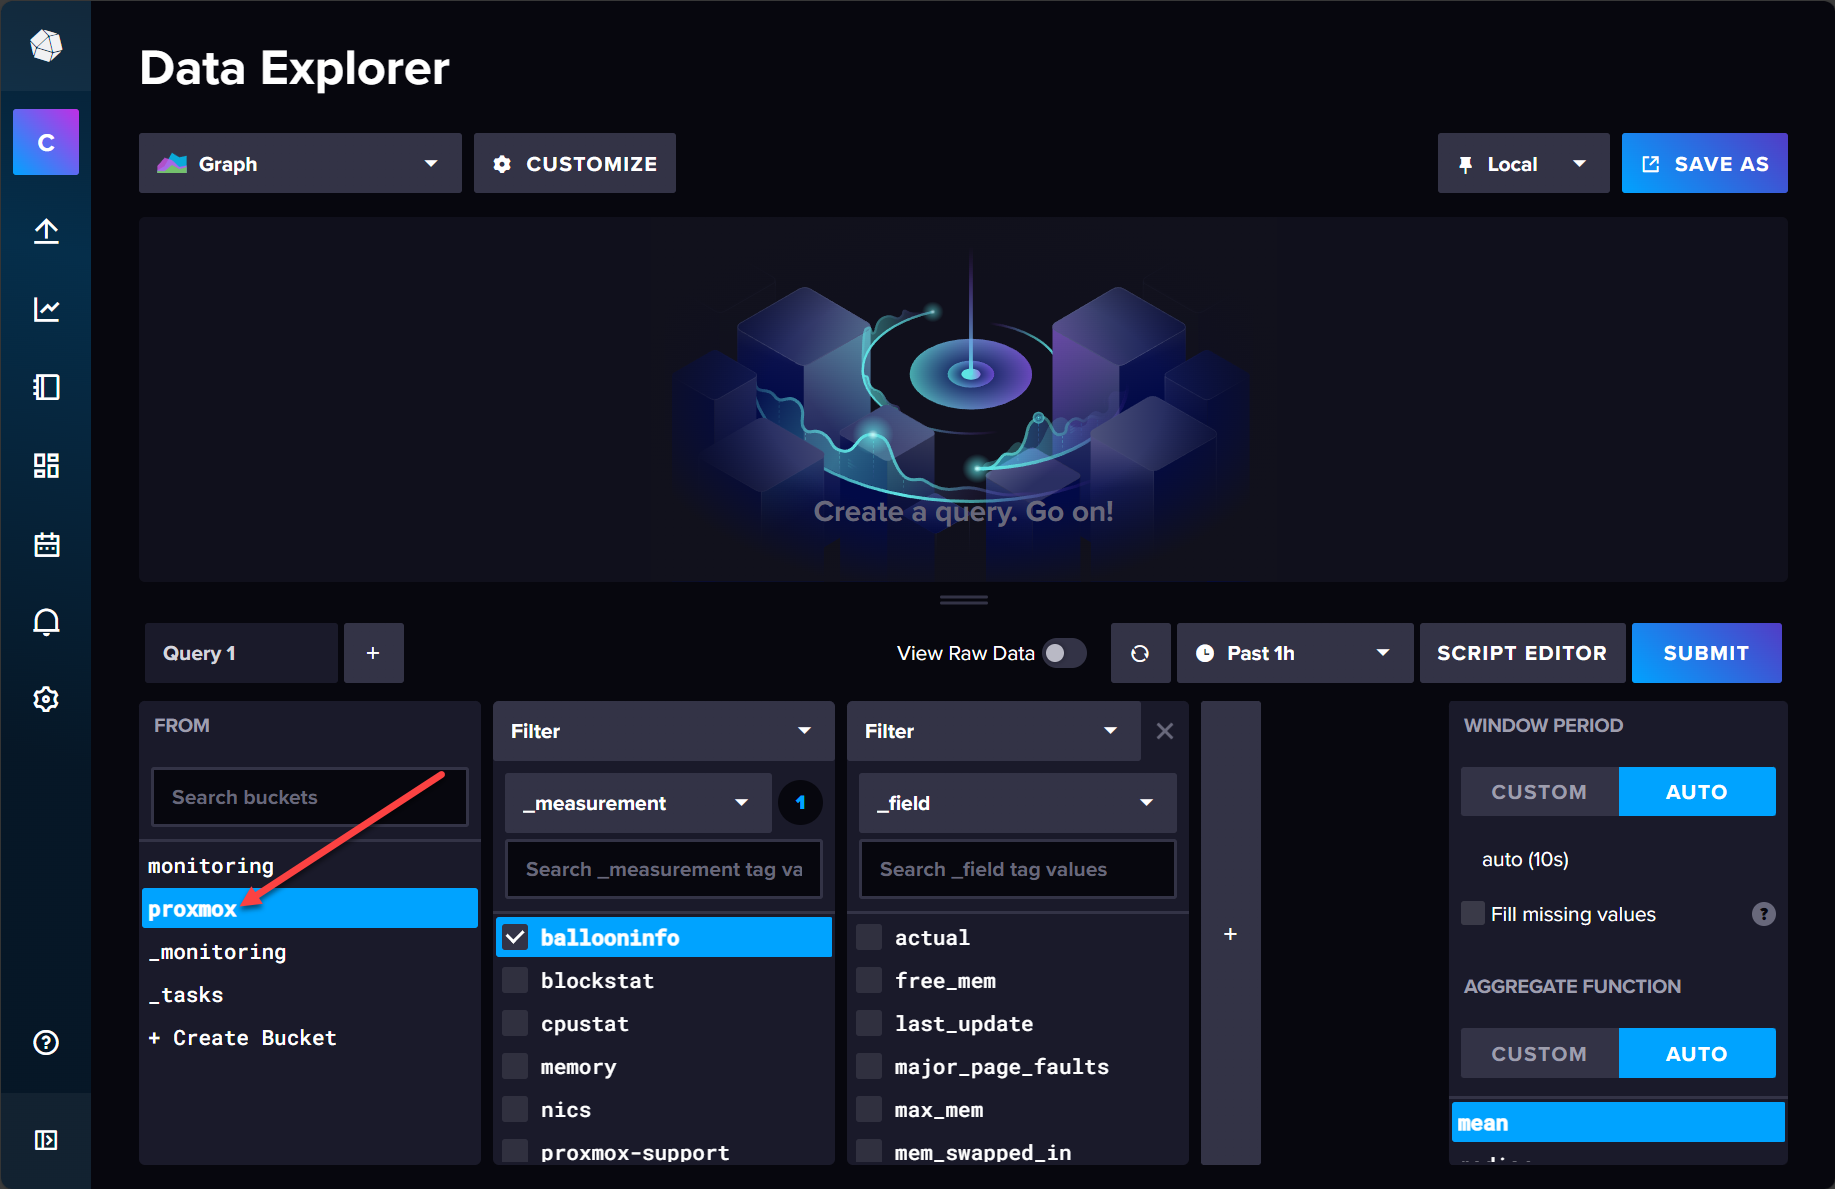
Now that we have Proxmox metrics server configured, we can log into InfluxDB and make sure we are seeing metrics making it into InfluxDB.
As we can see below, when clicking on Proxmox bucket on the Data Explorer dashboard, we see the metrics list populated, like ballooninfo, blockstat, cpuinfo, etc. This tells us the configuration is working thanks to the metrics config.
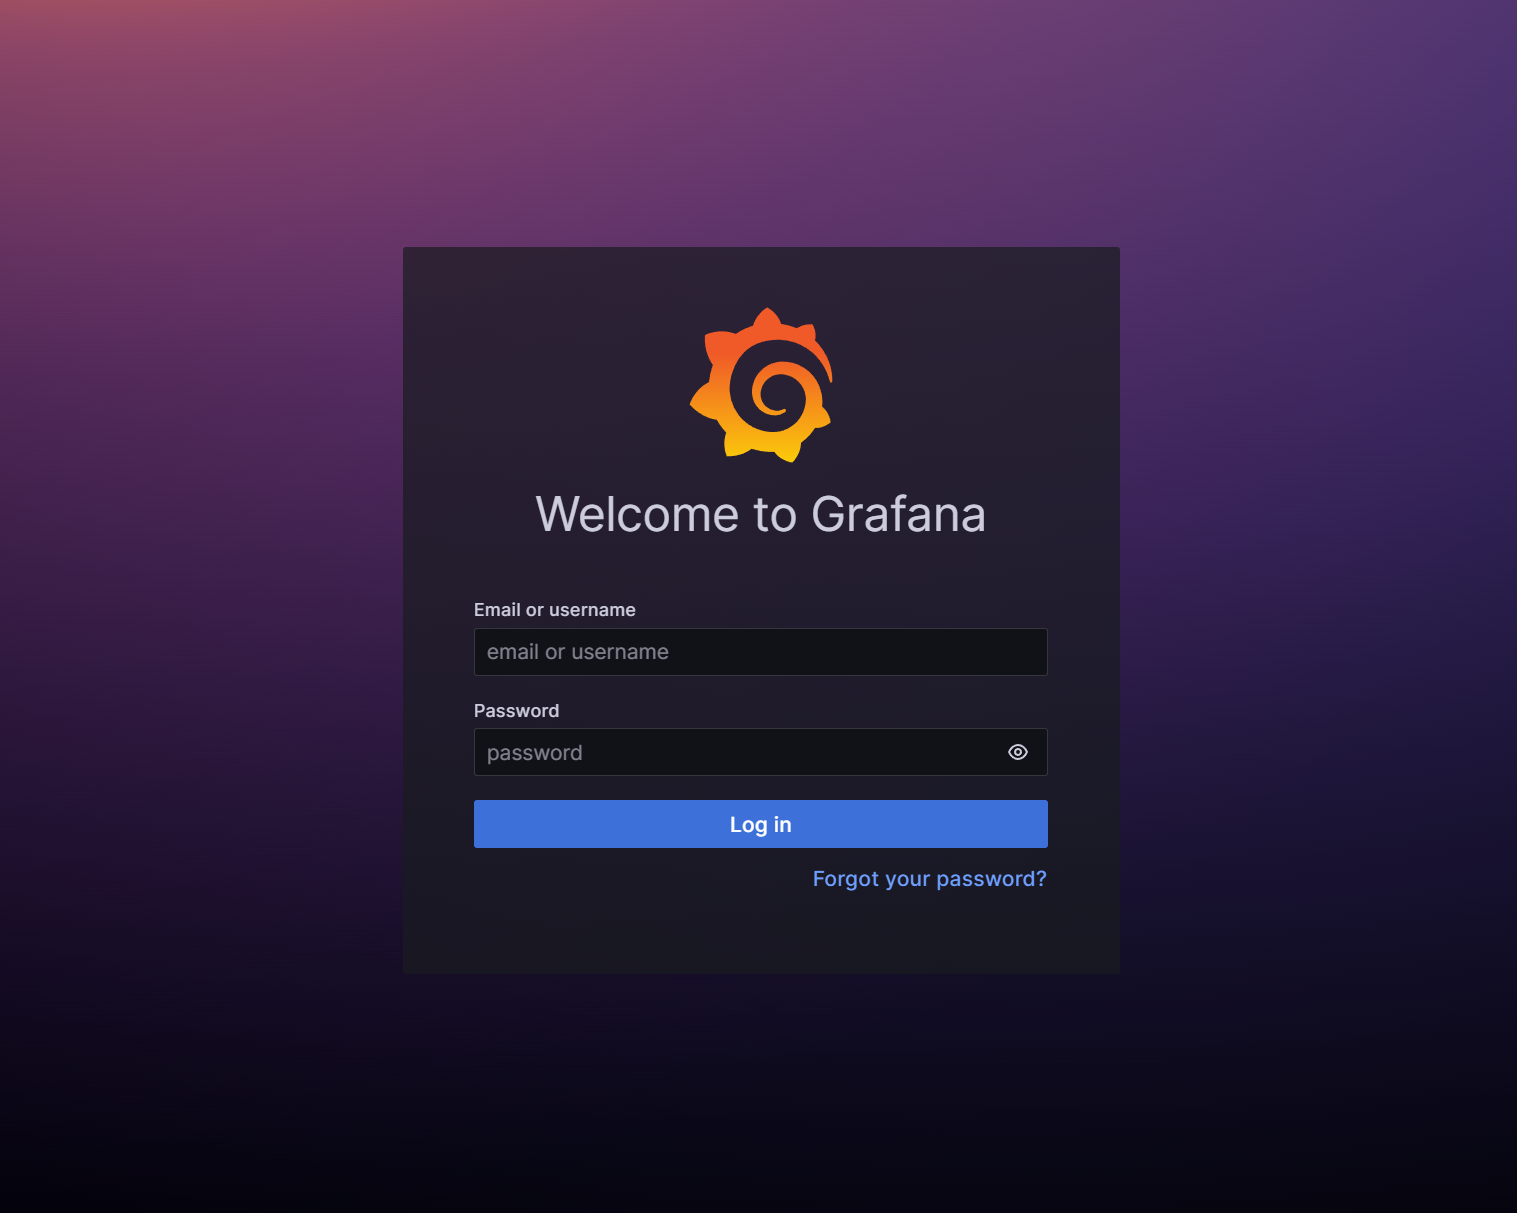
Connecting Grafana to InfluxDB Data Sources
Let’s connect the Grafana UI to the InfluxDB data source. In this example, we will use the HTTP method for connection and authenticate using the generated token.
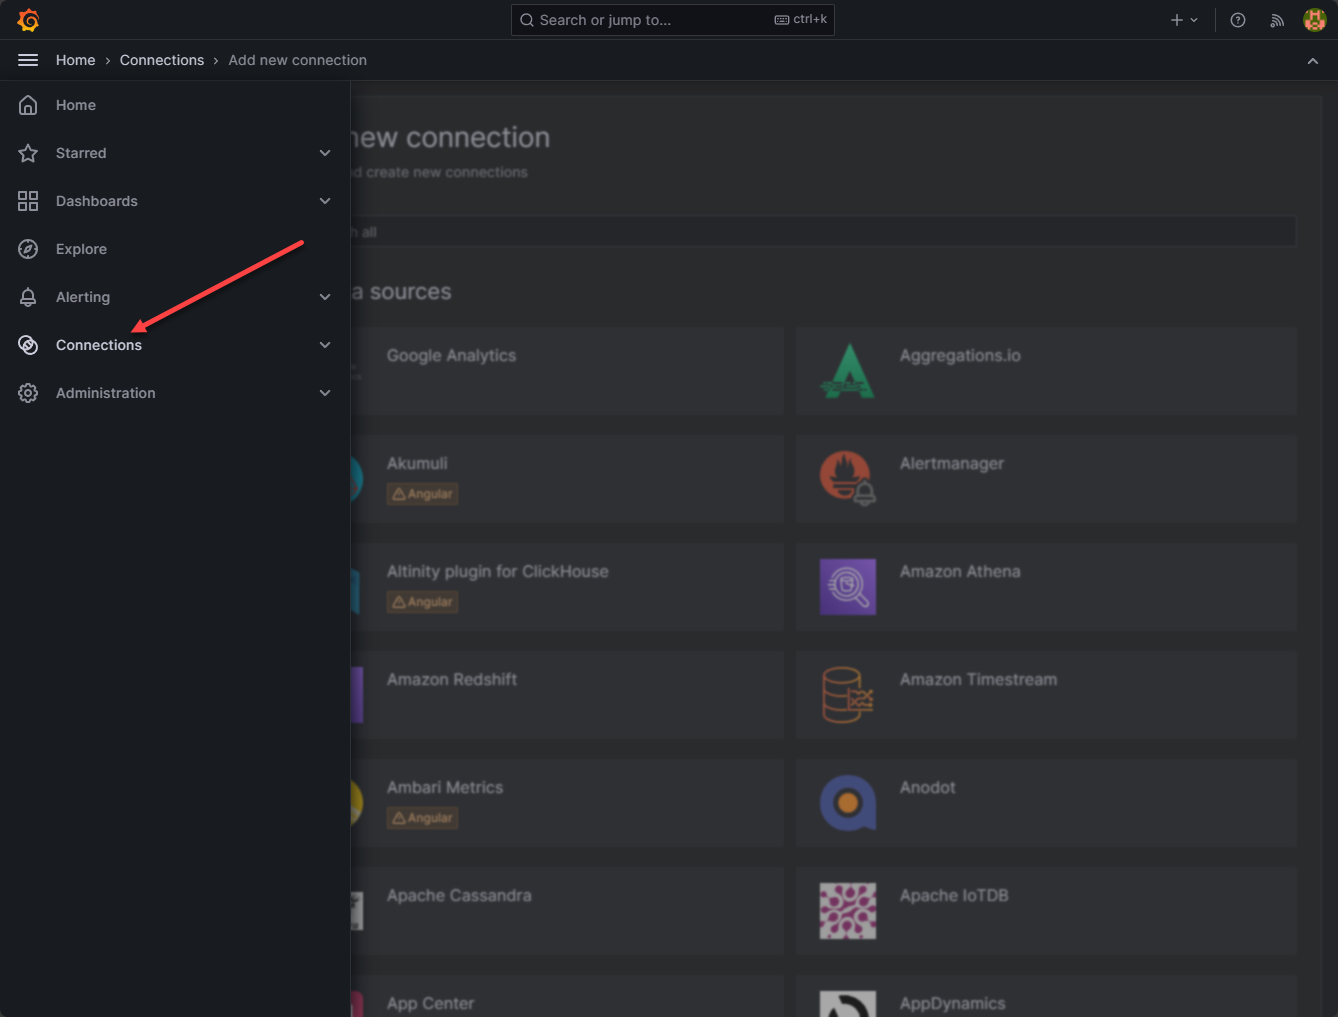
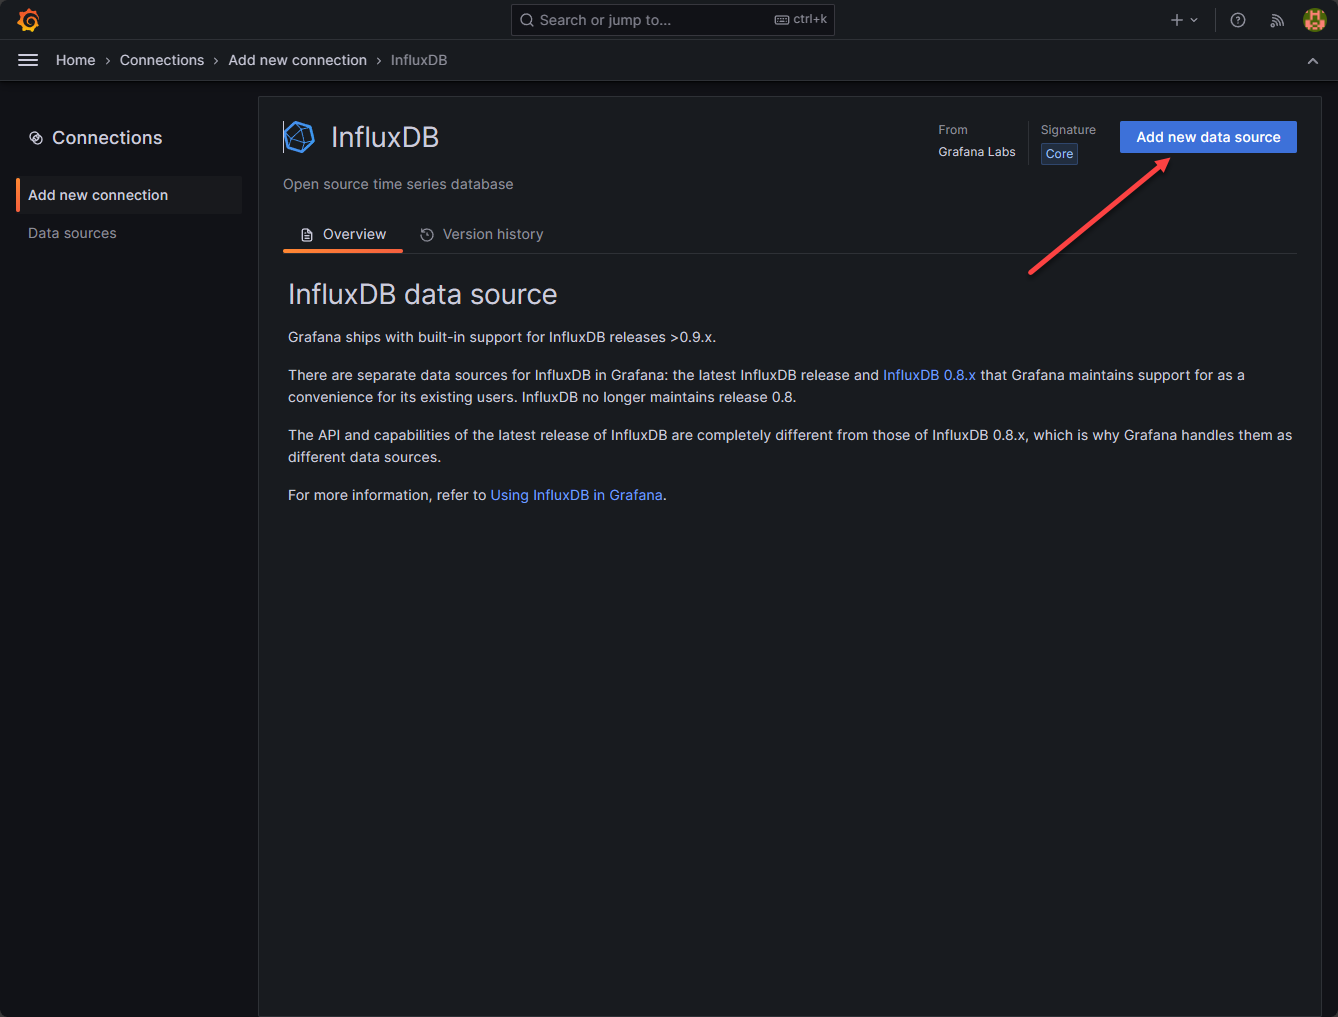
Navigate to Connections.
Search for influxdb.
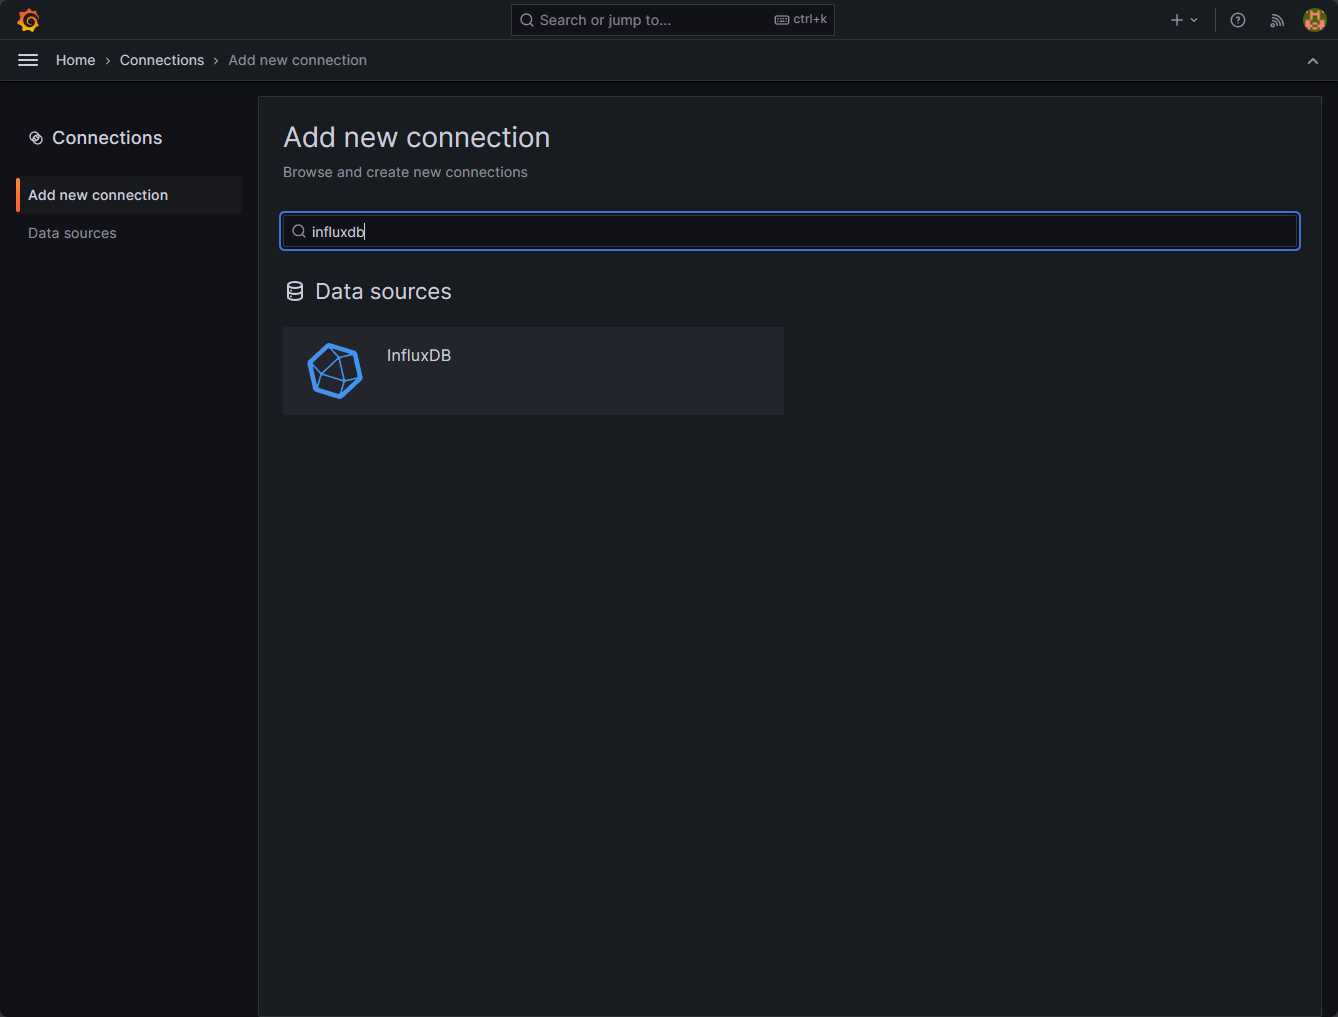
Create a new InfluxDB data source by clicking the button Add new data source.
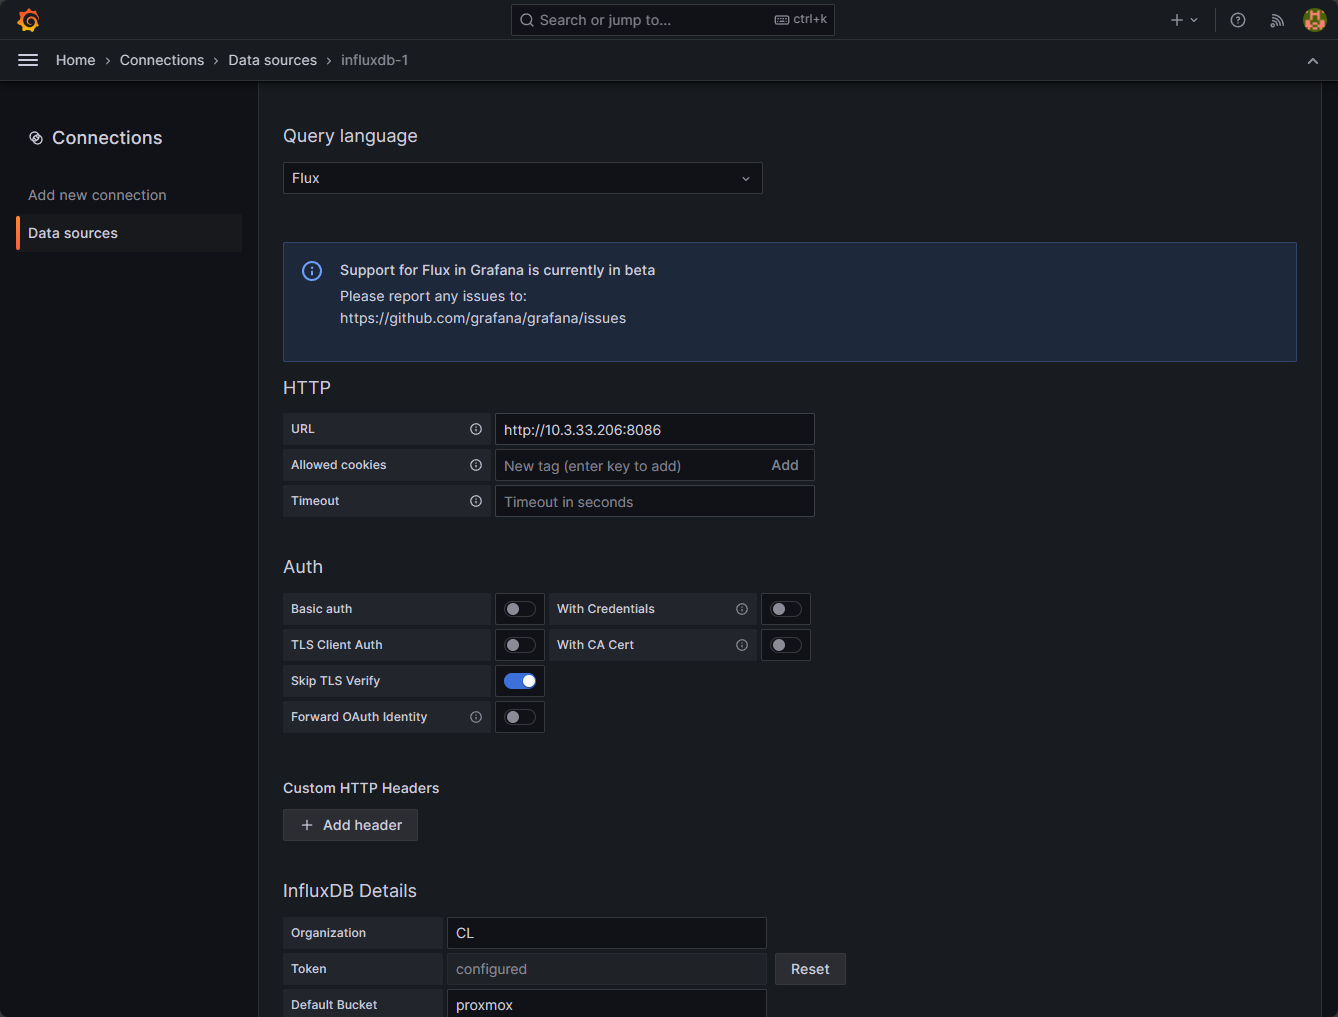
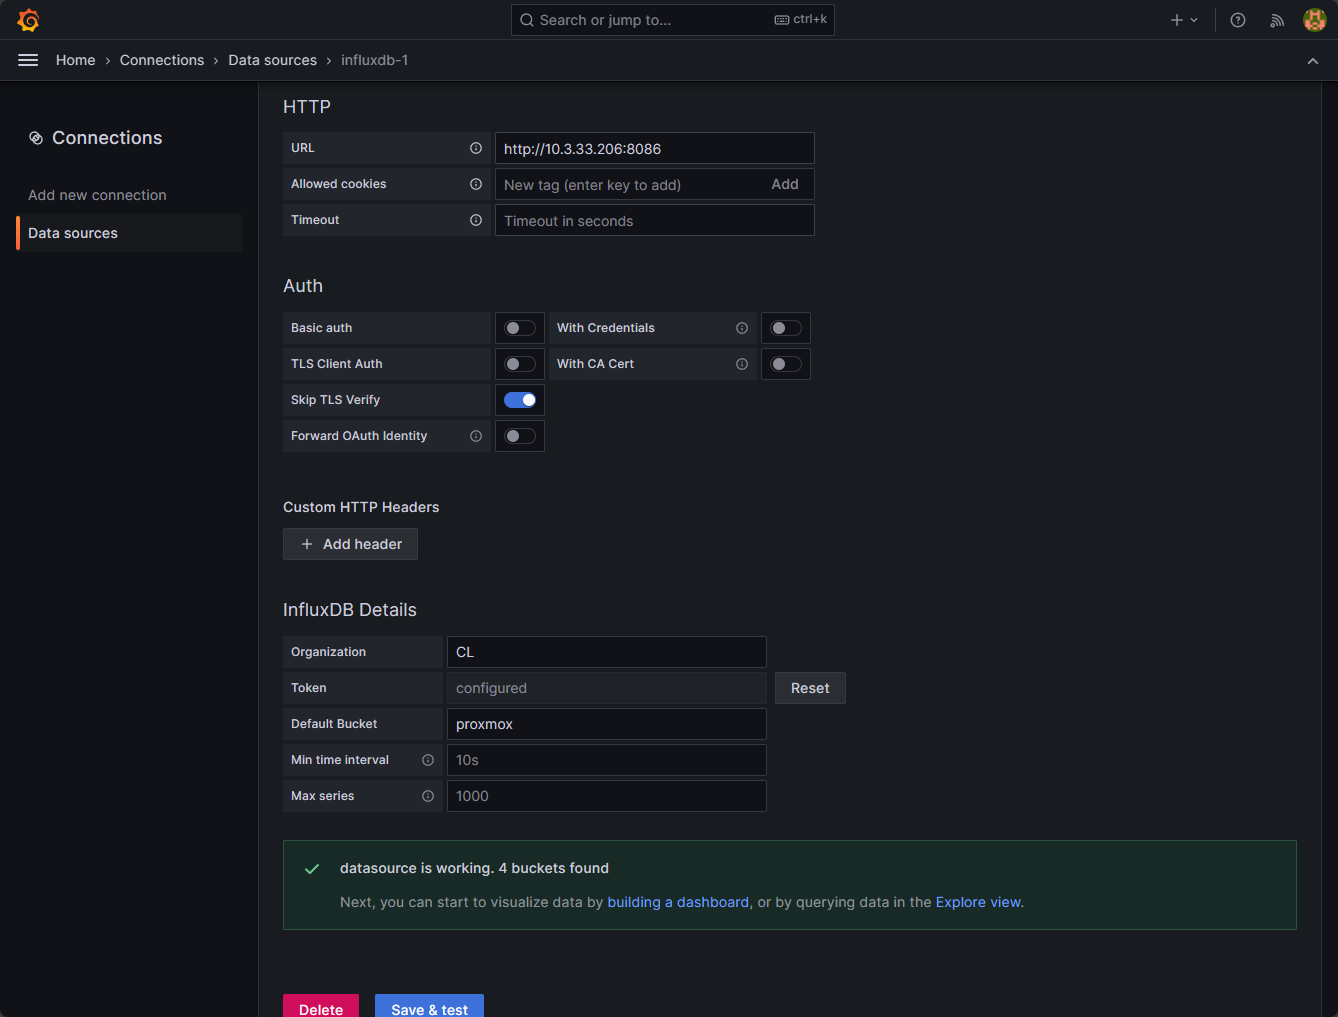
Make sure to select Flux as the query language. In this case, the URL configuration should point to your InfluxDB address. If you are using HTTPS and a self-signed certificate, you can flag on the Skip TLS verify to avoid SSL errors with your URLs.
When you click Save and test it will attempt to connect grafana to InfluxDB.
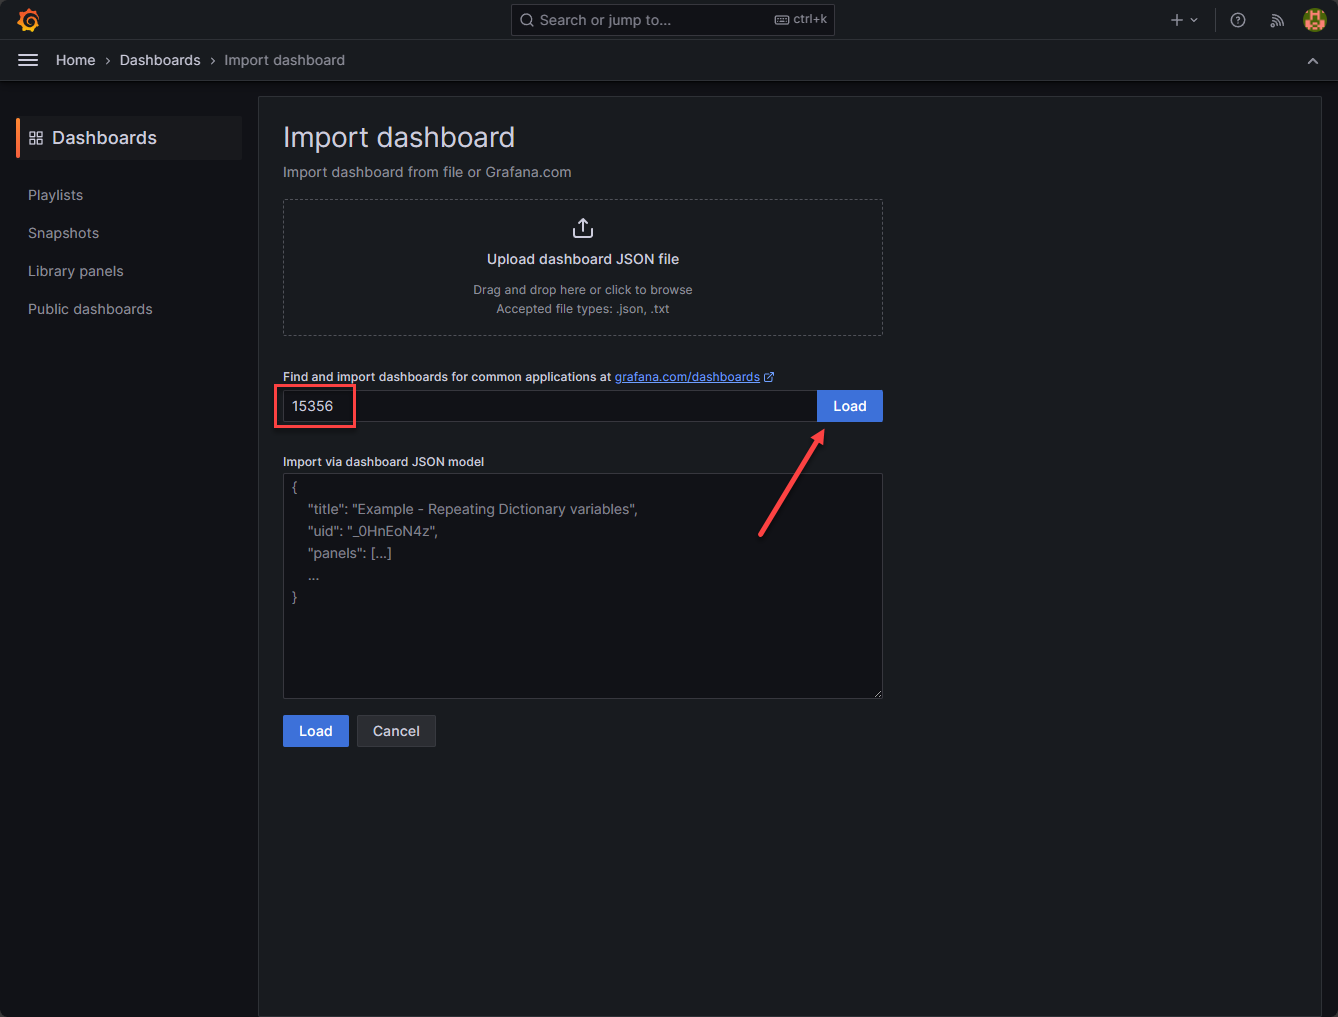
Click the plus sign menu in the upper right hand corner and then choose to Import Dashboard conf.
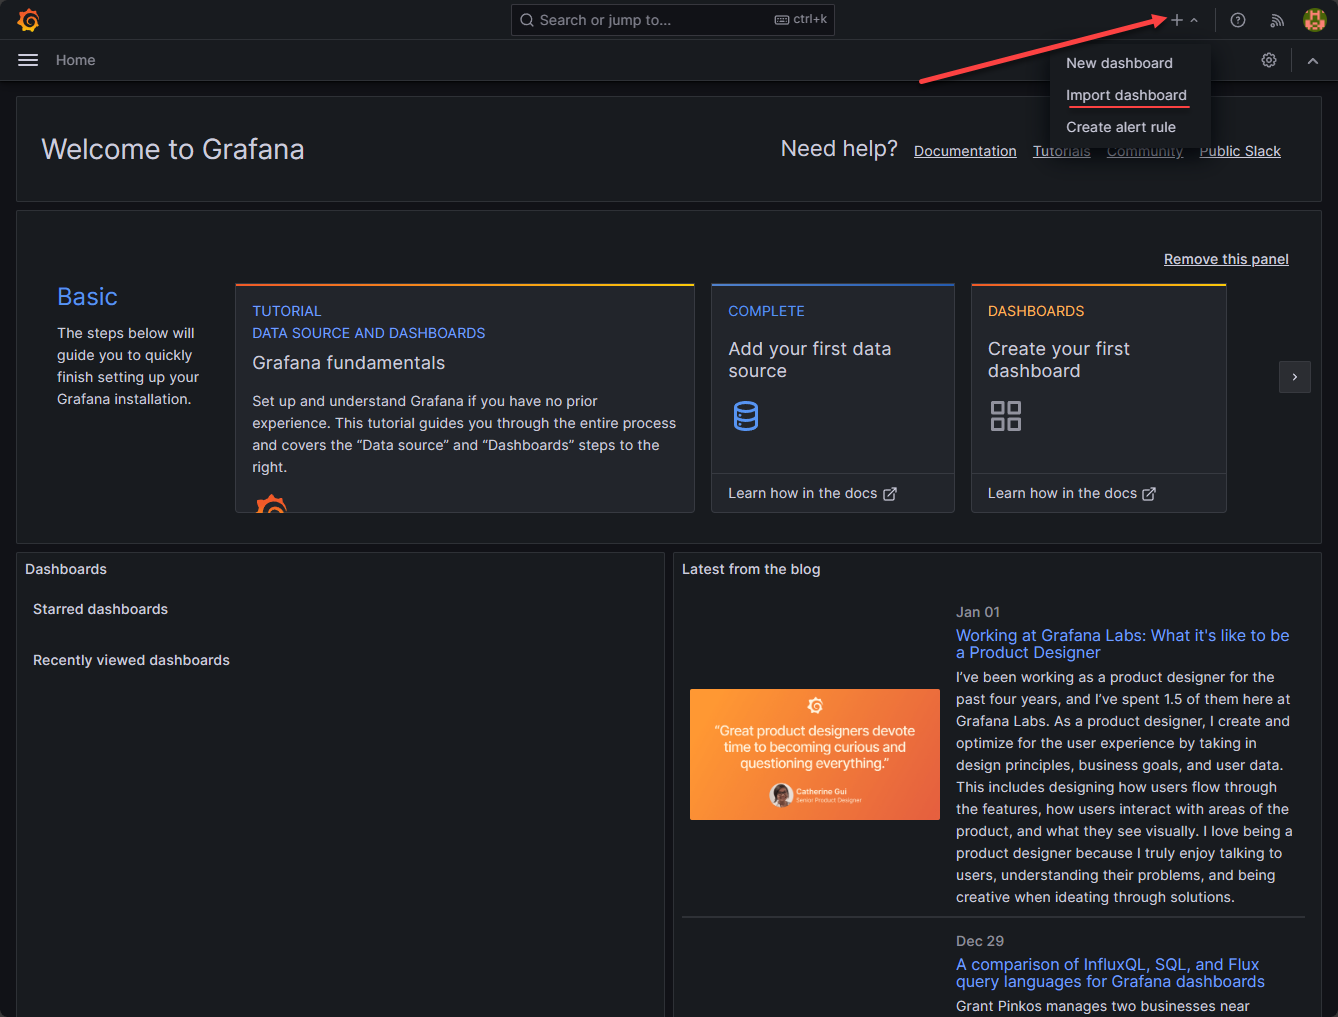
Below we are loading the community dashboard for monitoring Proxmox and clicking the Load button. You can browse all the community dashboards here: Dashboards | Grafana Labs.
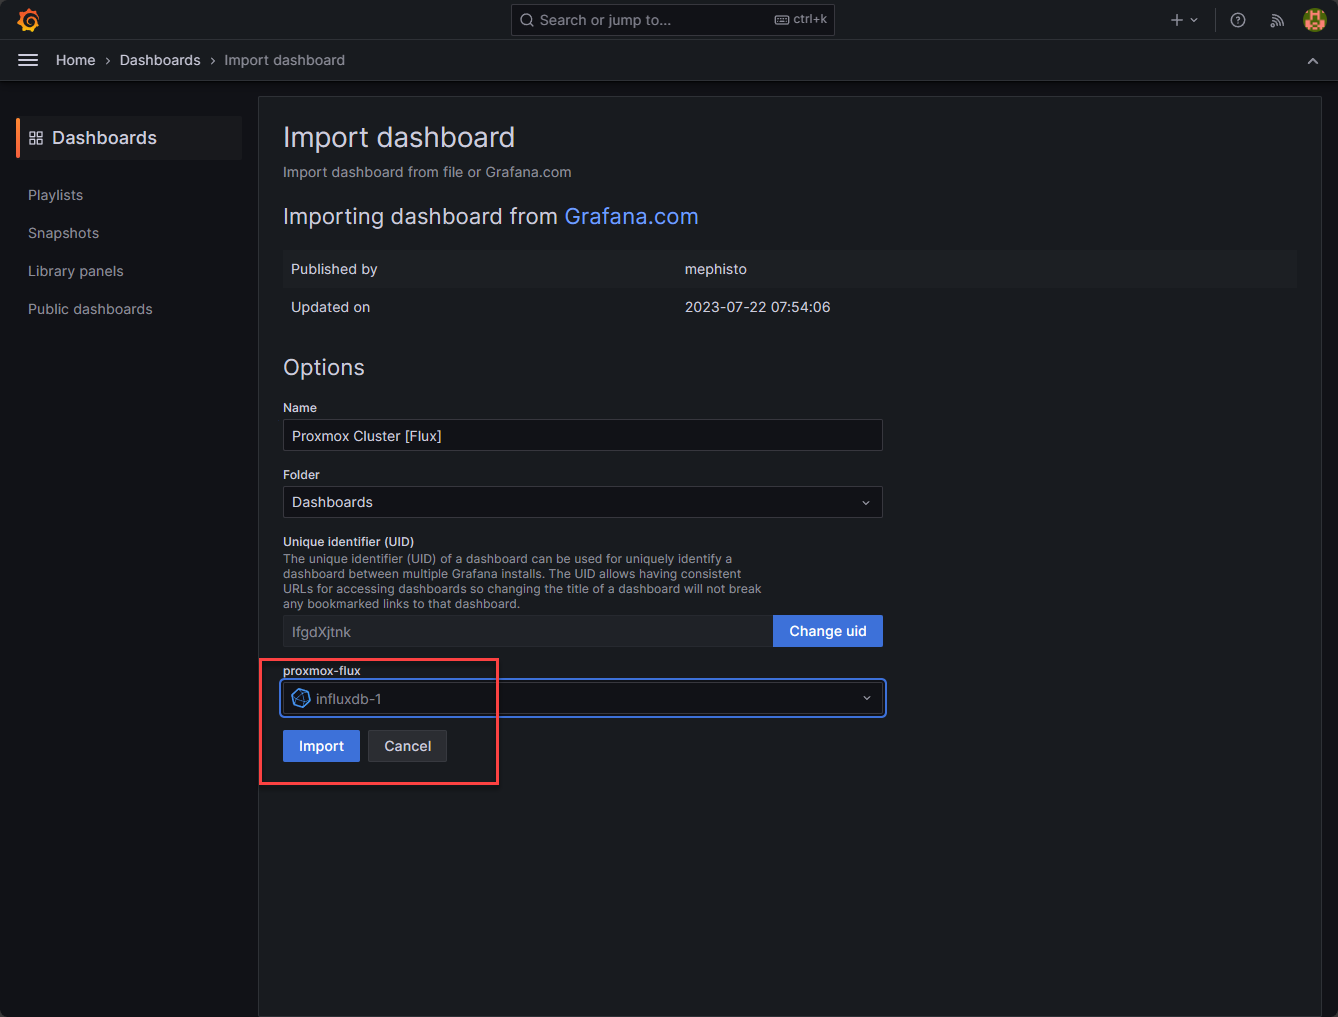
When you import the dashboard, select the data source that you created for your InfluxDB.
After the dashboard loads, choose the correct Bucket for pulling in the information. Below, you can see the data being gathered from one of my Supermicro Proxmox hosts.
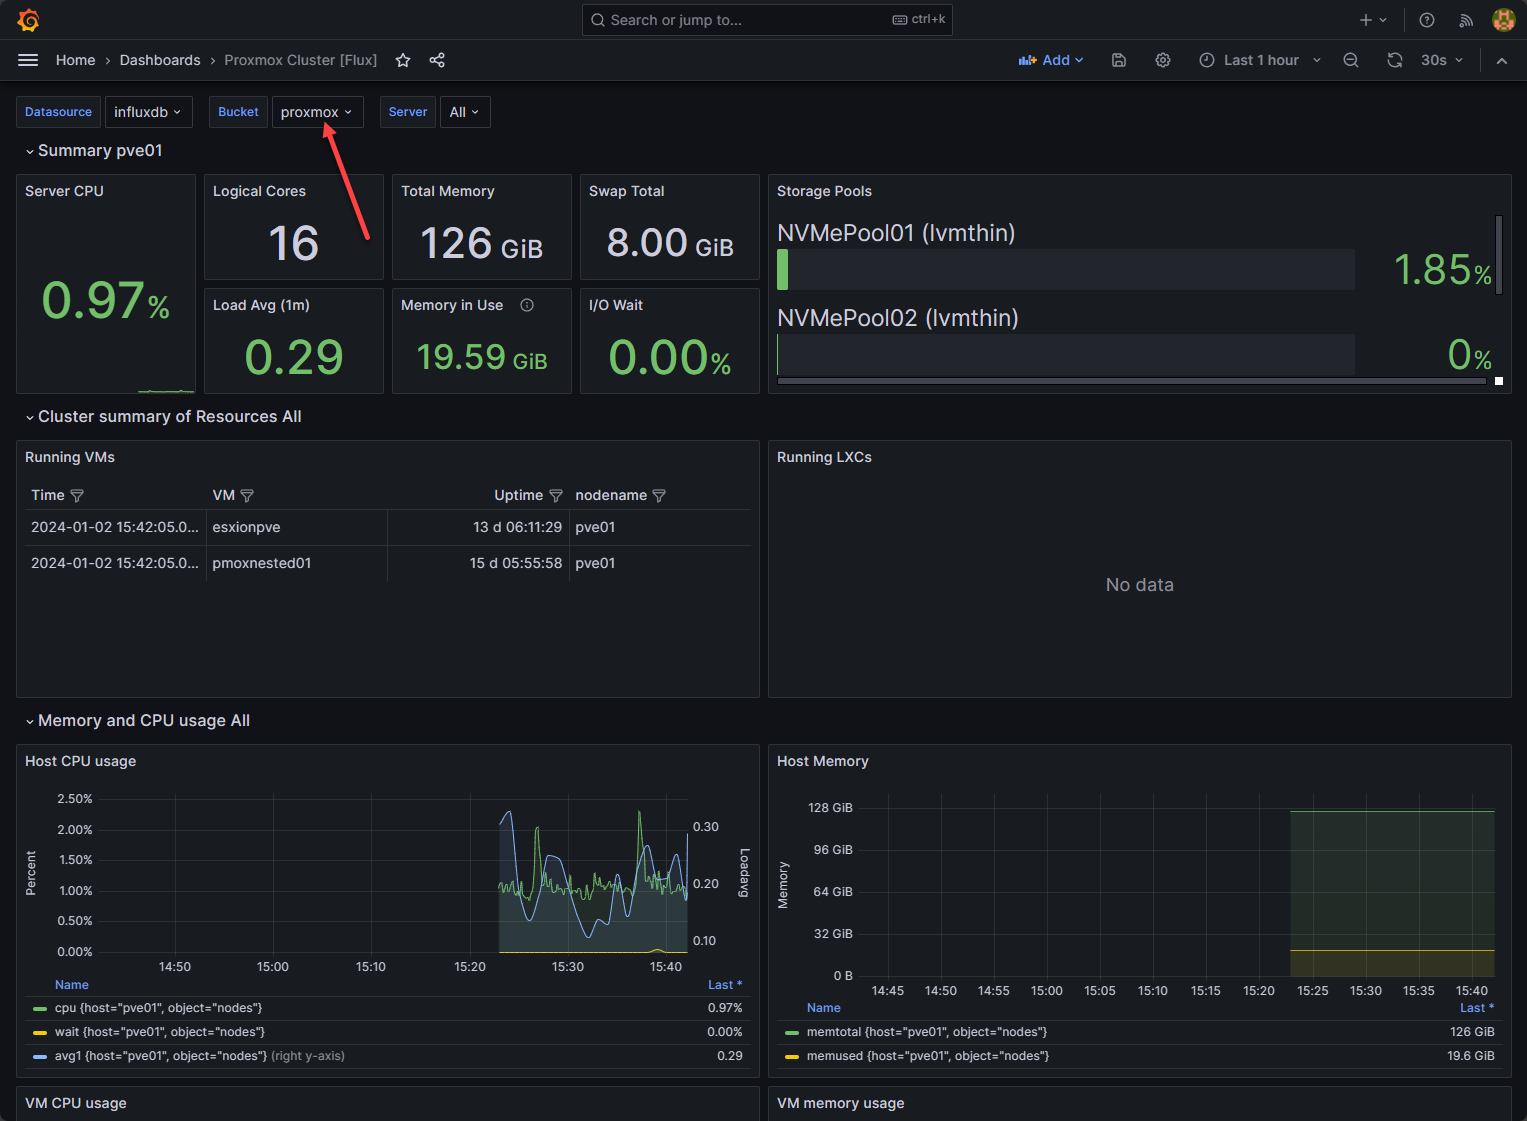
This is just one of many examples of monitoring services, infrastructure, applications, and anything else that you can stream data to InfluxDB.
Wrapping up InfluxDB Grafana Docker-Compose
The combination of InfluxDB and Grafana orchestration via Docker-Compose is a powerful free and open-source solution for data monitoring and visualization that anyone can use to help create a free monitoring solution. It allows you to manage and analyze data from applications and other components. Admins and users alike will find these open-source tools valuable for monitoring critical infrastructure.
Google is updating how articles are shown. Don’t miss our leading home lab and tech content, written by humans, by setting Virtualization Howto as a preferred source.
About The Author