It is the tool that we have all either loved/hated for years working with Microsoft Windows Server systems. It has been the go to tool when troubleshooting Windows Server issues as they come up or in profiling systems to get baselines of performance and other metrics of a server that is in service. As old as it is, Performance Monitor has not changed at all in over two decades. With all the new introductions that Microsoft has been releasing in Windows Admin Center, it stands to reason that a new Performance Monitor was going to be released at some point. With the release of Windows Admin Center 1910, Microsoft has finally introduced the new and improved Performance Monitor for your infrastructure. In this post we will take a look at New Performance Monitor released in Windows Admin Center along with the features of this new tool.
How Do You Get the New Performance Monitor?
First, you may be wondering how you get the new Performance Monitor? Well, the way to get it is download the newly released Windows Admin Center 1910 from Microsoft.
In the previous post, Windows 10 GA download with new features, I covered the release and several of the features that are contained in it as well as the way you can get your download.
In summary though, you can get the new Performance Monitor as part of Windows Admin Center 1910. There is nothing else you need to do besides install this newest release of WAC.
New Performance Monitor released in Windows Admin Center
There are many great new things about the new Performance Monitor redesign as part of Windows Admin Center. We will look at the following:
- Redesigned interface
- Much improved usability
- New graph types
- Workspaces
- Cluster and HCI functionality
Redesigned Interface
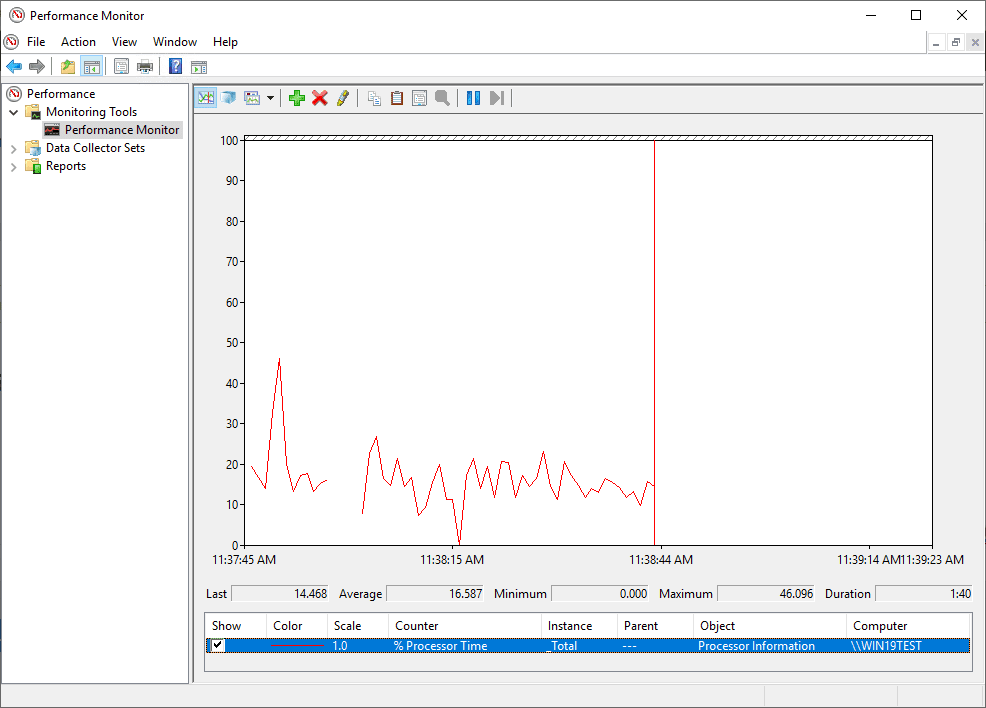
The first major thing you will notice about the new Performance Monitor as found in the latest Windows Admin Center is the new design that is evident. It follows suit with the look and feel of the Windows Admin Center interface which is modern in look and efficient in the feel of the interface.
From this:
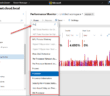
To this:
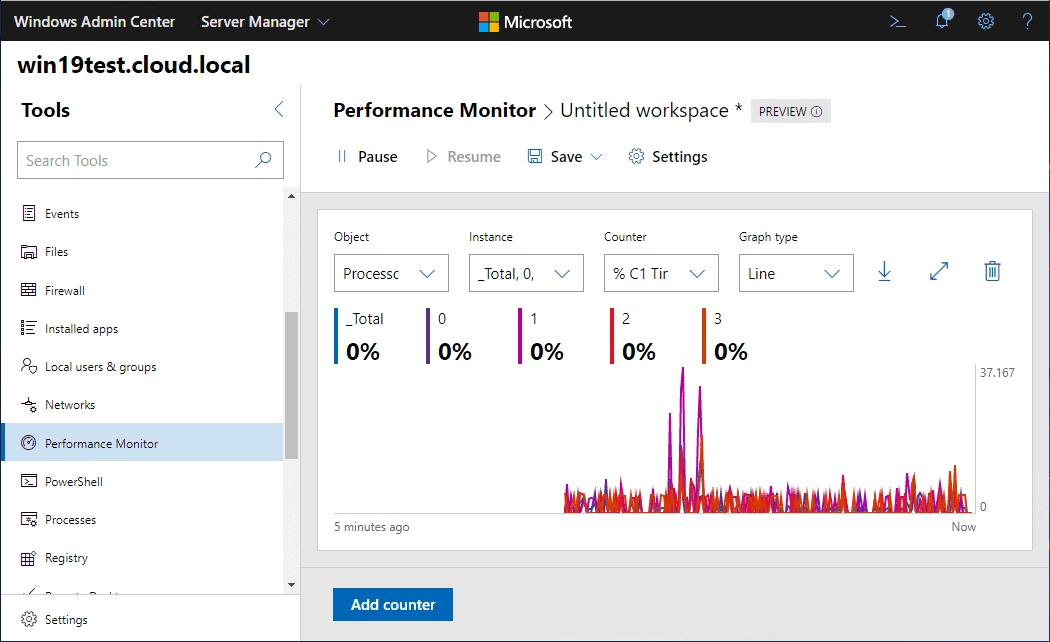
I found the new Performance Monitor to be beautiful compared to the old Performance Monitor legacy interface that is still stuck in the 90’s/2000’s. The advantages of the web interface come to light when we look at the usability of the solution as well.
Much Improved Usability
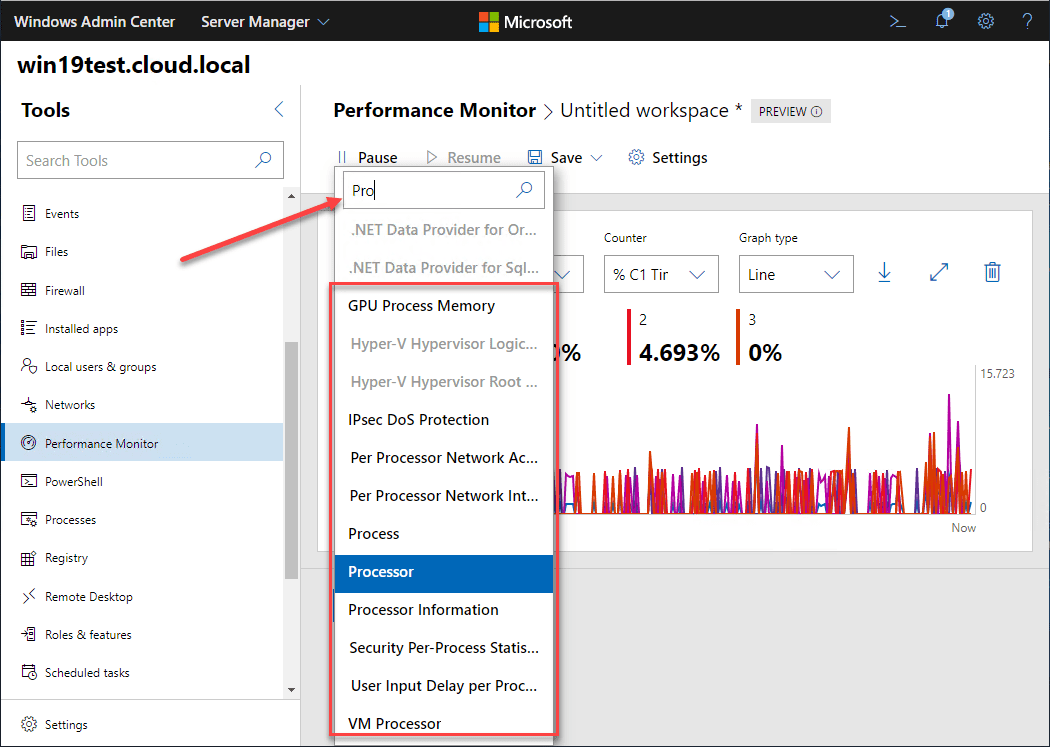
One of the features you will greatly appreciate with the new Performance Monitor in Windows Admin Center is the improved usability. Do to the power of the web-driven interface with the new Performance Monitor, the user experience is greatly improved.
As an example, I always hated having to look for the right counter to add for monitoring. Now, with the new Performance Monitor, you simply start typing in the Working with the new Performance Monitor in Windows Admin Center is much easier in the Search box and it instantly starts filtering your counters by name as you type.
New Graph Types
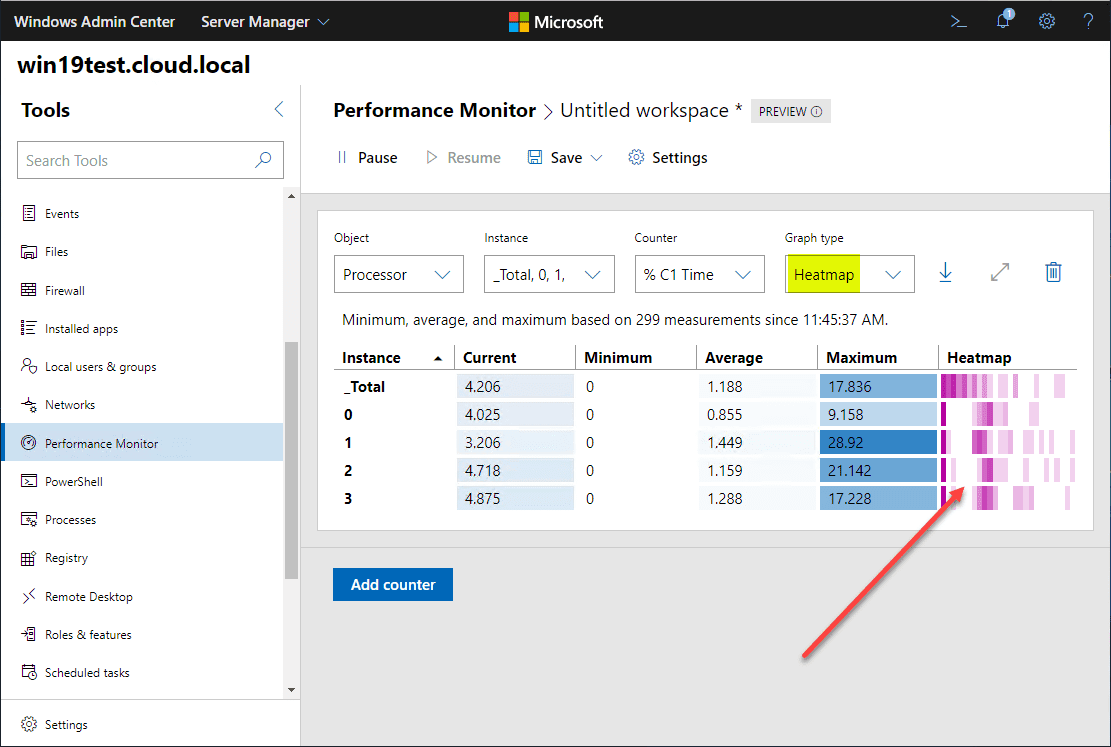
One of the great new features in the new Performance Monitor is the new graph types that are found in the interface. These help with visually seeing what is going on with the counters you have added for monitoring.
- Report
- Min-Max
- Heatmap
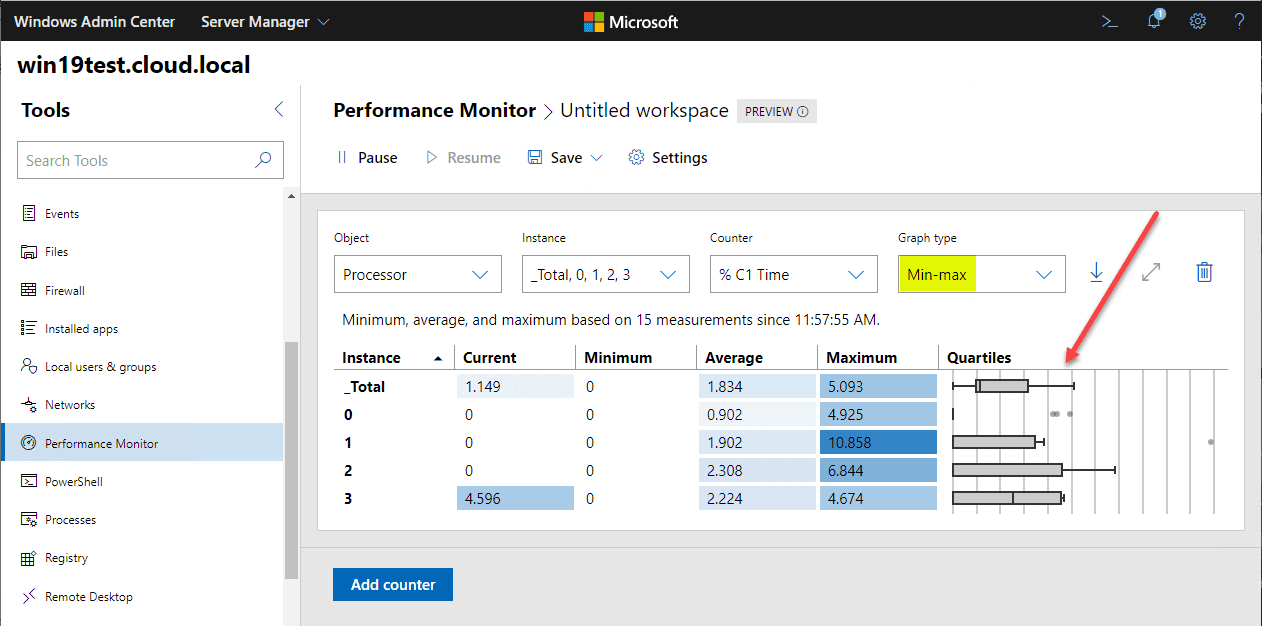
The Report view is similar to what you are used to seeing with the old Performance Monitor results along with the Line graph. I wanted to key in on the two new graph types – Heatmap and Min-max and what these views look like.
These two new graph views are very “visually” oriented. It helps you to see visually where problems or bottlenecks may be forming in your performance metrics being pulled.
I found the Max-min graphs to be interesting as well. You can see visually by the Quartiles how high and low observed metrics are being measured.
Workspaces
The new performance monitor introduces the new concept of workspaces. Workspaces save the layout and monitors that you have configured inside the Performance Monitor dashboard within Windows Admin Center. This allows you to easily return to a specific view you had developed in Performance Monitor. Workspaces can be downloaded and even saved.
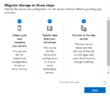
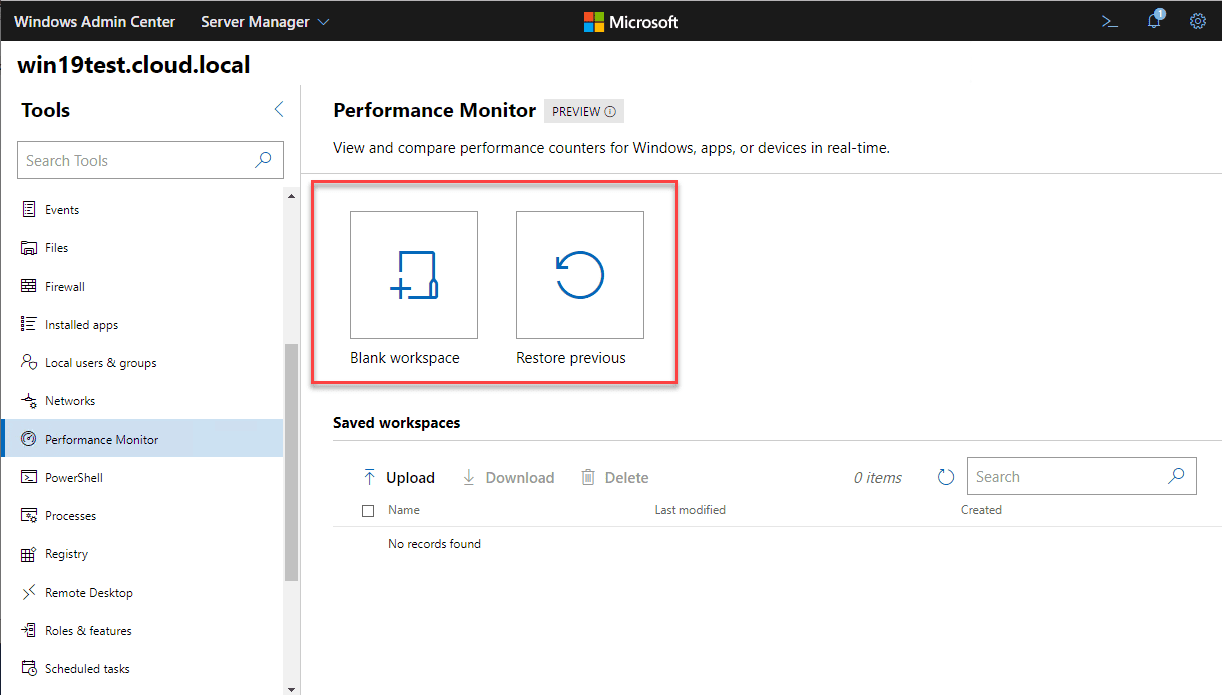
As soon as you open the Performance Monitor dashboard, you can create a new Blank workspace or Restore previous workspace.
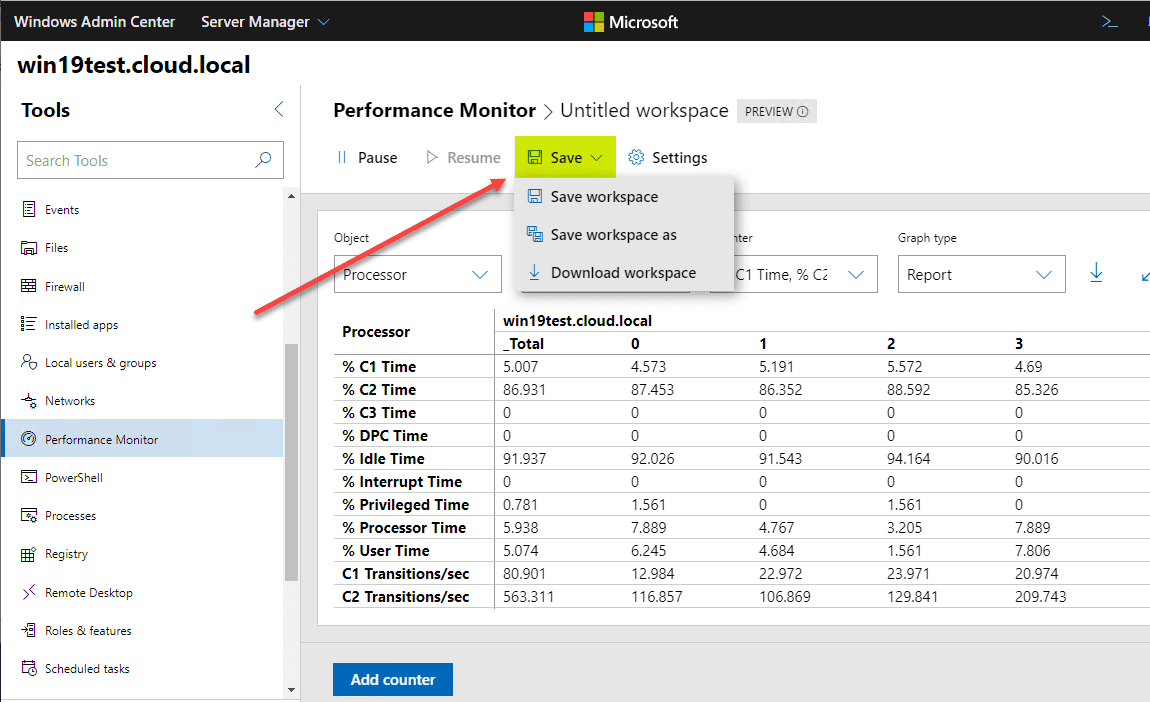
Once you have created a new workspace, you have the option to Save workspace, Save workspace as, or Download workspace.
Cluster and HCI Functionality
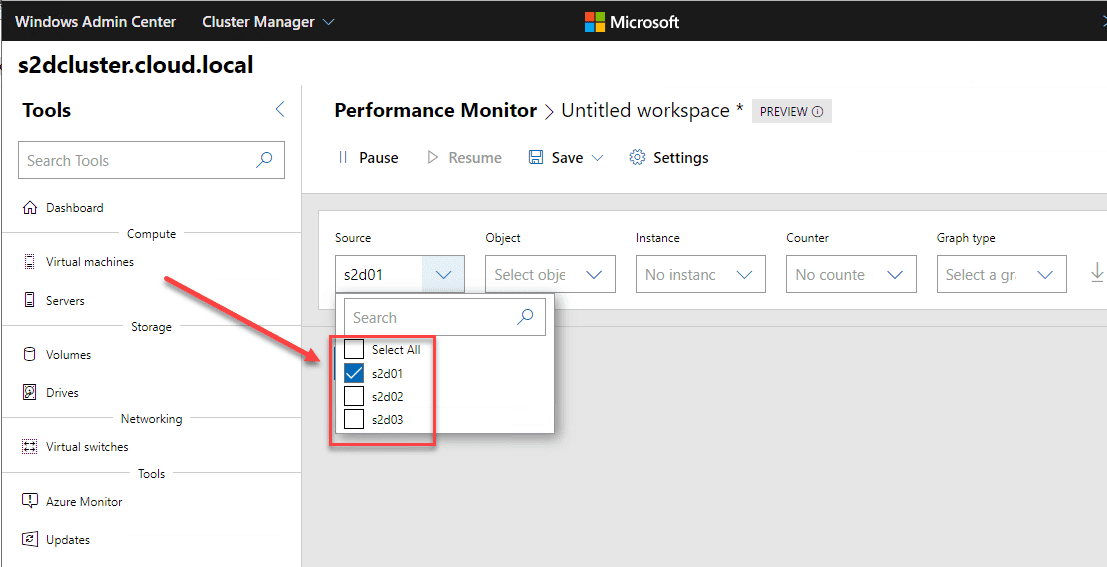
Performance monitor is also very well adept, not only with single servers but also with cluster and hyperconverged infrastructure. This includes solutions like Azure Stack HCI. So, Performance Monitor is very cluster-aware in its implementation and features.
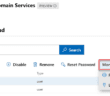
When you have a cluster added to the new Windows Admin Center, Performance Monitor gives you to the option for Sources to select All, or specific cluster hosts.
Wrapping Up
The new Performance Monitor released in Windows Admin Center 1910 looks to be a great revamp of the old legacy tool that we have all used for decades now.
The new design and fresh features with new graphing views makes monitoring performance much easier and less cumbersome than using the legacy Performance Monitor tool.
Be sure to check out the new Performance Monitor released in Windows Admin Center by downloading the latest release of Windows Admin Center.
Google is updating how articles are shown. Don’t miss our leading home lab and tech content, written by humans, by setting Virtualization Howto as a preferred source.
About The Author