Configure VMware vSAN Monitoring with vRealize Operations 7.0

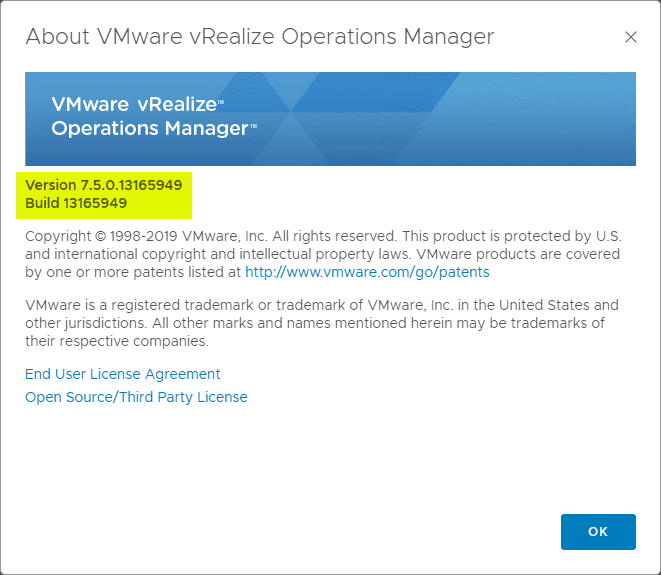
VMware vRealize Operations 7.0 is a great upgrade to the vRealize Operations solution from VMware. VMware has made tremendous improvements across the board to the product and has positioned it as a cloud aware and hybrid environment tool that is now business intent aware. This allows organizations to have much more intelligence about environments and align infrastructure requirements with the actual business requirements. One of the great improvements overall with vROps 7.0 is the new VMware vSAN 6.7 Update 1 integration and overall vSAN visibility, dashboards, and intelligence that are found in the updated solution. In this quick post, we will take a look at Configure VMware vSAN Monitoring with vRealize Operations 7.0 and see how this is easily enabled on inside of vRealize Operations Manager 7.0 as well as the great dashboards that are already included in the solution. Let’s dive in.
Configure VMware vSAN Monitoring with vRealize Operations 7.0
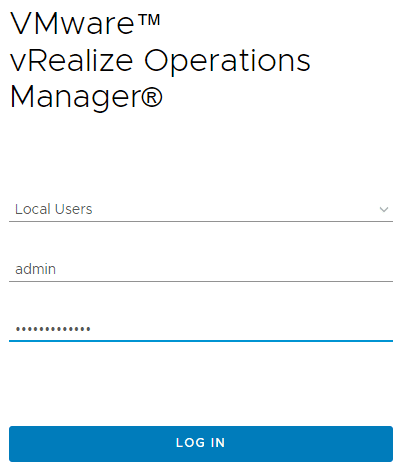
The first thing you need to do is the obvious. Browse out to the vRealize Operations 7.0 web interface and login to the solution.
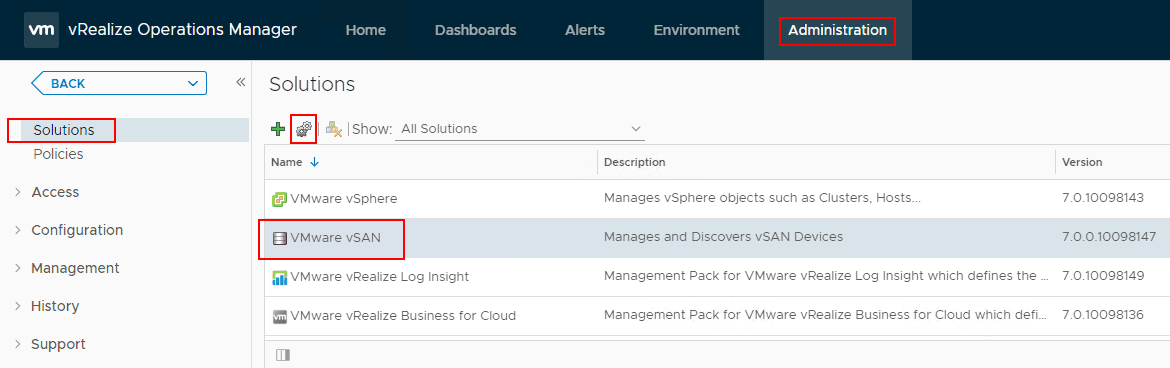
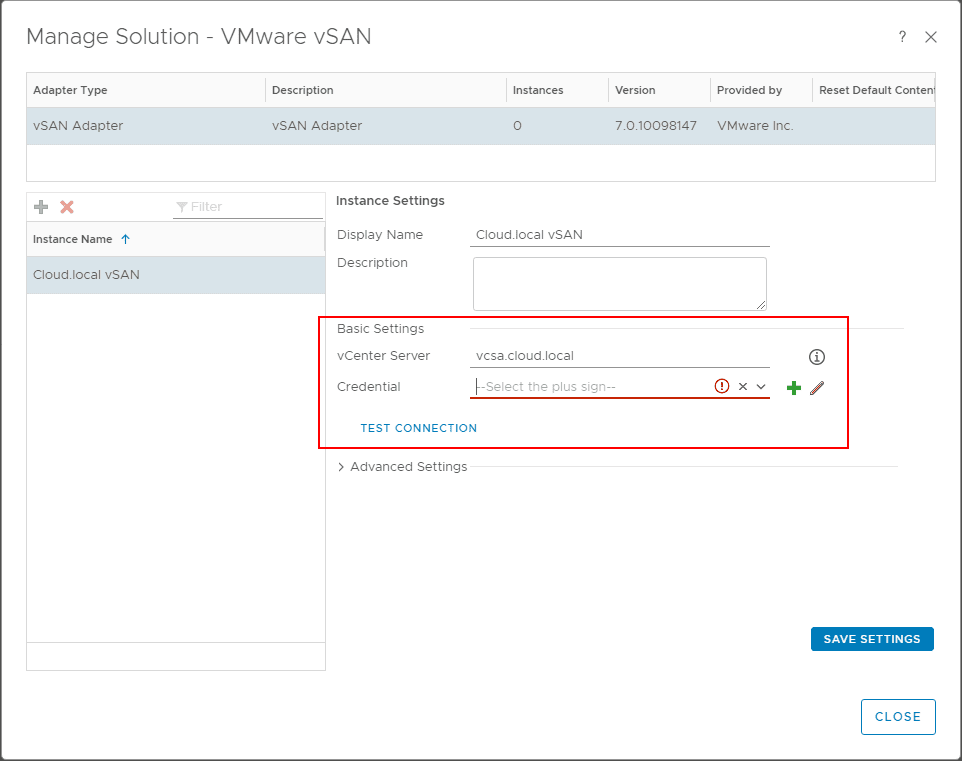
After logging in, you can navigate to Administration > Solutions > VMware vSAN and choose the settings “cog” under the Solutions heading. This launches a configuration window similar to the configuration of the vCenter Server connection in vRealize Operations 7.0.
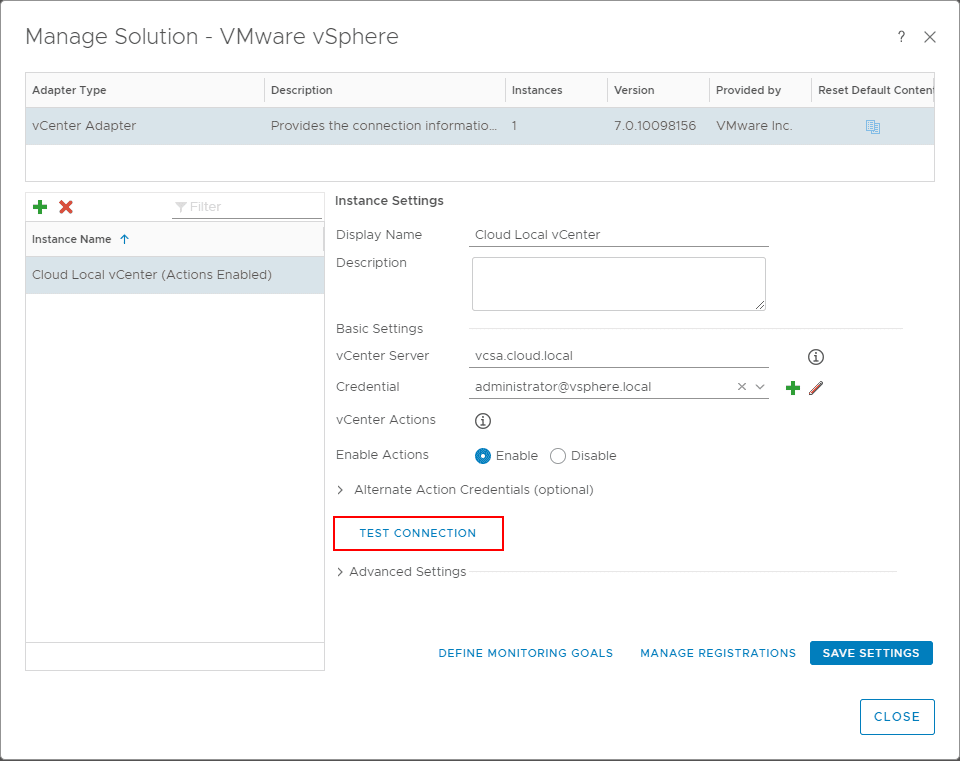
The next order of business is to populate the Basic Settings area of the configuration including vCenter Server and Credential. Simply fill in the IP or FQDN of your vCenter Server and then add your credentials with the green “+” button or choose them from the drop down menu.
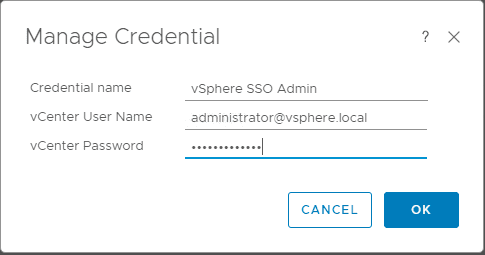
Again, this launches the Manage Credential dialog box that is identical to what you use to configure the vCenter Server adapter instance. Populate your credentials and then click the OK button.
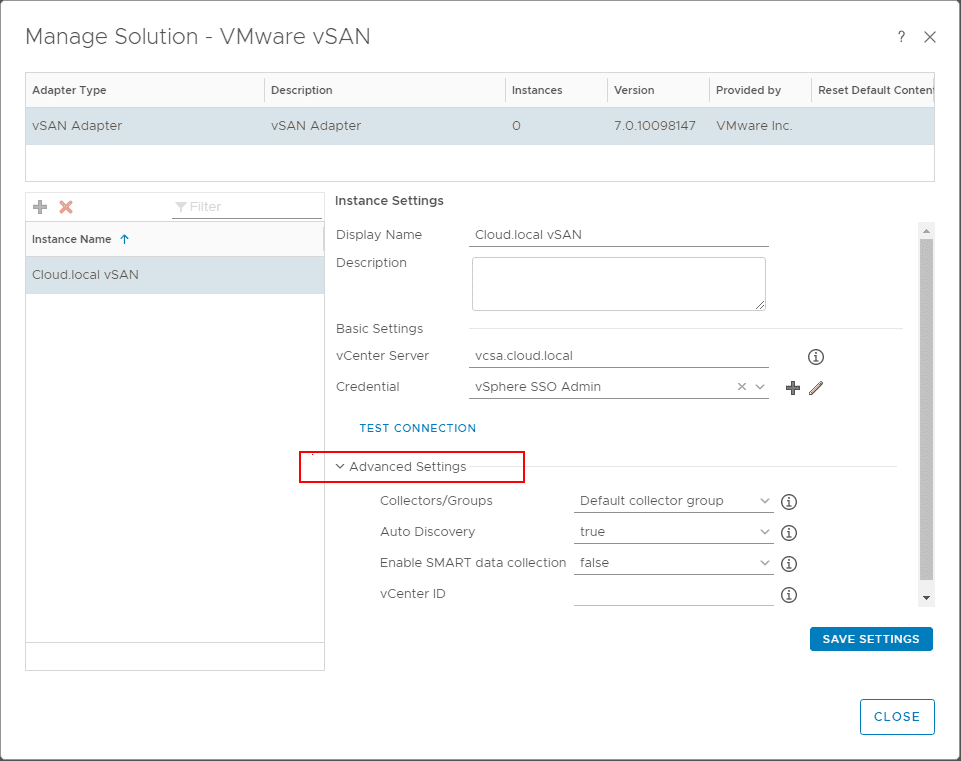
Under the Advanced Settings, there are several interesting options here including:
- Collectors/Groups – Determines which vRealize Operations Manager collector is used to manage the adapter process
- Auto Discovery – Determines whether new objects added to the monitored system are discovered and added automatically after the initial configuration of the adapter.
- Enable SMART data collection – When set to true enables SMART data collection for physical disk devices.
- vCenter ID – A globally unique identifier associated with this vCenter instance (VC UUID)
If you choose to either test or save the configuration, you will be presented with the certificate for the vCenter Server. Click Accept to accept it and make the connection.
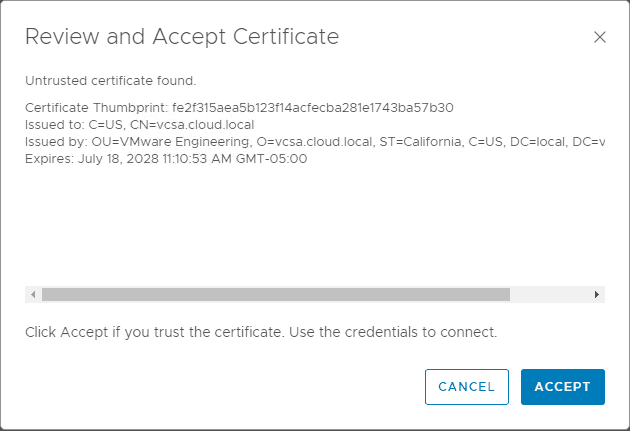
Choosing either the Test Connection or Save Settings option.
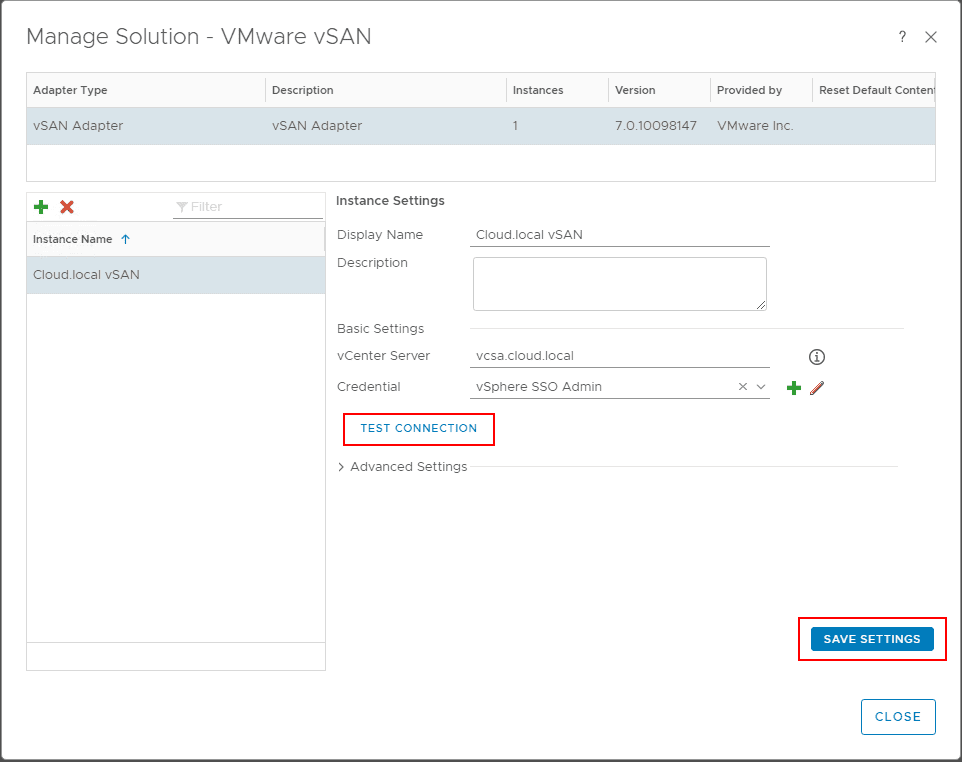
After clicking the Save Settings button, you will see the message indicating the Adapter instance successfully saved.
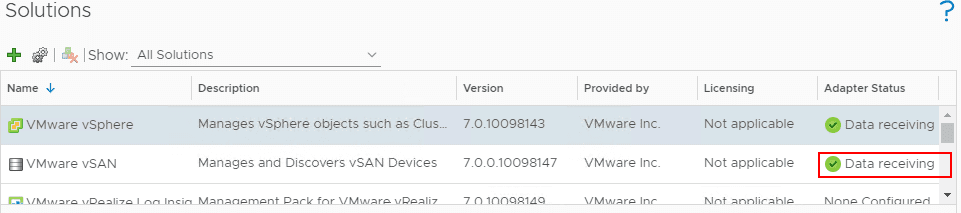
As is the case with the VMware vSphere adapter instance, you should see the Data receiving “Adapter Status” displayed in the Solutions window. This indicates the VMware vSAN adapter is talking to the vSAN environment.
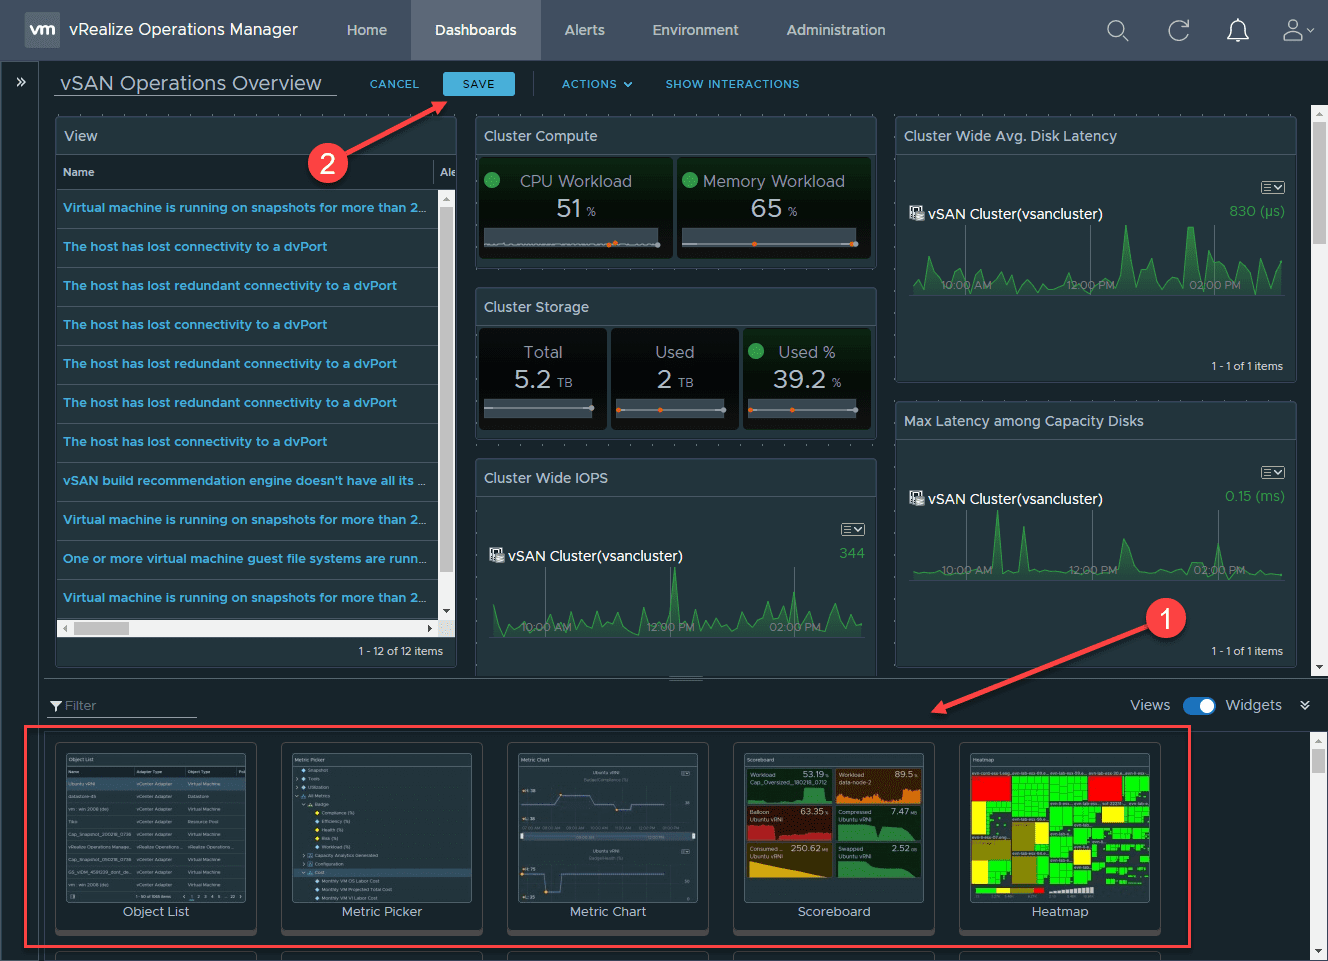
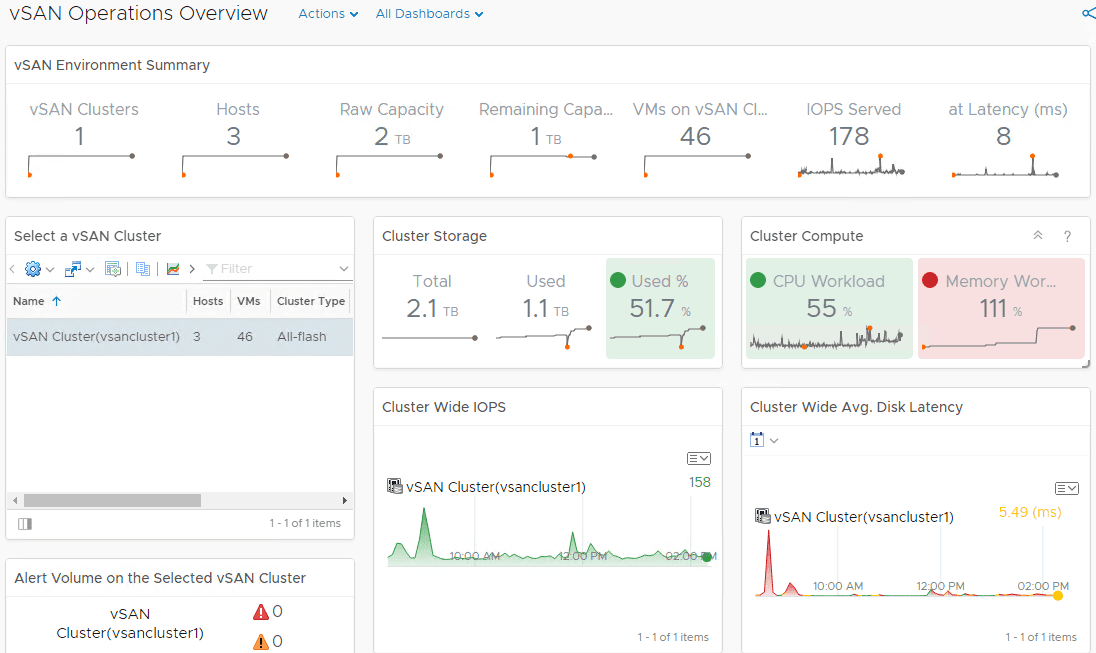
It may take a few minutes for the vSAN Operations Overview Dashboard to start displaying information as is shown below. It may appear blank for a few minutes. The dashboard is found under Dashboards > vSAN Operations Overview.
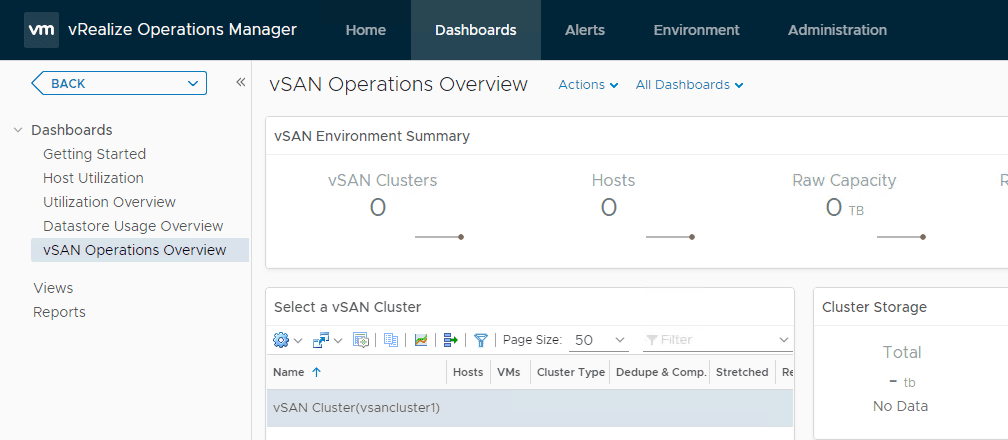
After a while you will see the data populated in the environment. Any hotspots will show up in red as is the case with the Memory Workload widget below. This provides a really great high-level overview of the vSAN environment including:
- vSAN clusters
- Hosts
- Raw Capacity
- Remaining Capacity
- VMs on vSAN Cluster
- IOPs Served
- Total Latency
- Cluster Storage
- Cluster Compute
- Cluster Wide IOPs
- Cluster Wide Avg. Disk Latency
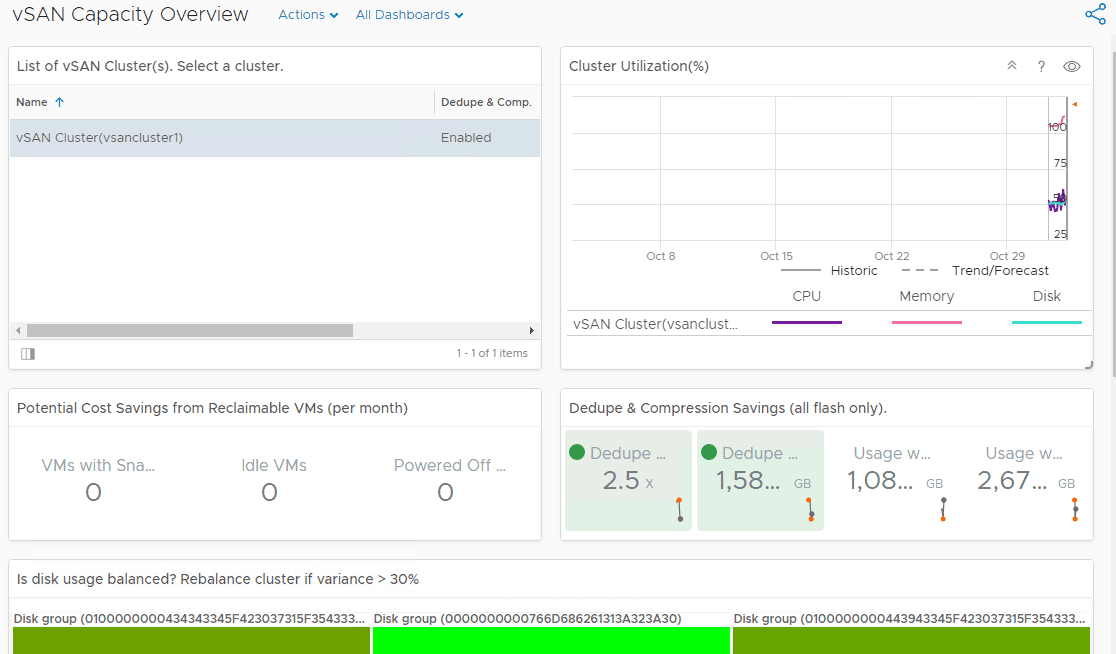
A look at the vSAN Capacity Overview Dashboard displaying great information from a forecasting and capacity planning perspective.
Takeaways
The new VMware vRealize Operations 7.0 solution provides a tremendous amount of features and capabilities for today’s VMware virtualized environments running on-premises or even in hybrid scenarios and with software-defined storage such as vSAN. The ability to Configure VMware vSAN Monitoring with vRealize Operations 7.0 is super simple and easy and provides instance return by way of automated intelligence based on business intent that is configured for the environment. The capacity planning dashboard is a great way to forecase usage. The vSAN Operations Overview provides an instant access glance of the overall performance in the VMware vSAN environment, including hot spots in key performance indicator areas that need attention. Stay tuned for further posts and insights on vRealize Operations 7.0.