Opvizor Performance Analyzer New vSAN 6.7 Performance Analysis
VMware vSAN 6.7 has incredible performance improvements, especially over legacy versions of vSAN. For a VMware administrator, especially with larger environments, keeping a handle on potential performance bottlenecks and other performance hotspots can be challenging. VMware vSAN has already included some really great basic troubleshooting tools built right into the vSAN interface in the vSphere client, however, for more in depth troubleshooting, administrators will want to dig deeper into the vSAN infrastructure. You can certainly have really great success with vSAN Observer as we have covered here. However, as we have already covered here, there is a great overall performance tool that now covers VMware vSAN in much greater depth and detail. Let’s take a look at Opvizor Performance Analyzer New vSAN 6.7 Performance Analysis and see the new dashboards that have been added to make analyzing vSAN performance much easier and intuitive.
Opvizor Performance Analyzer New vSAN 6.7 Performance Analysis
If you haven’t heard about Opvizor, it is a self-contained, downloadable appliance that contains everything you need to analyze the performance of your VMware vSphere environment. The appliance is relatively lightweight at under 1 gig or so. It deploys using the standard OVA/OVF deployment process.
So very quickly, you can get up and running gathering key performance indicators in your VMware vSphere environment. At a glance with the play boards, you can get a look at any potential problem areas in the overall vSphere environment.
With the latest patch rollup, version 4.9.2, Opvizor now has new and improved statistics and performance analysis of VMware vSAN, including the latest version, VMware vSAN 6.7!
Applying the Opvizor 4.9.2 Update
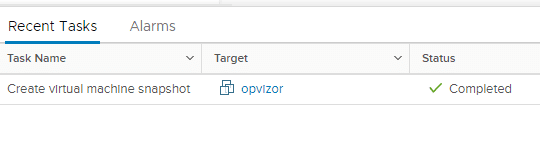
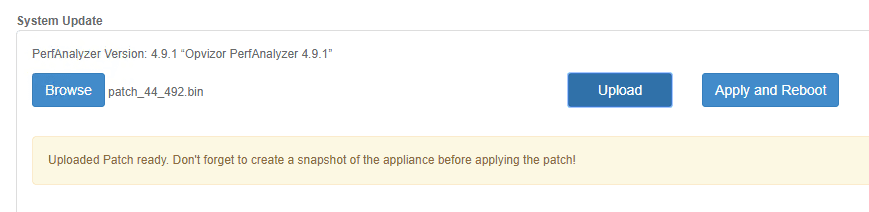
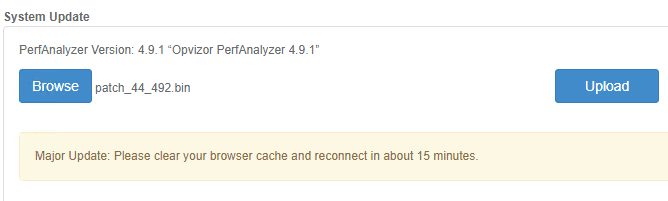
Applying the update if you already are running Opvizor is very simple. Under the Admin interface, you simply upload the patch and apply the update. Opvizor recommends creating a virtual machine snapshot of the appliance before applying the update.
Opvizor 4.9.2 New vSAN 6.7 Performance Dashboards
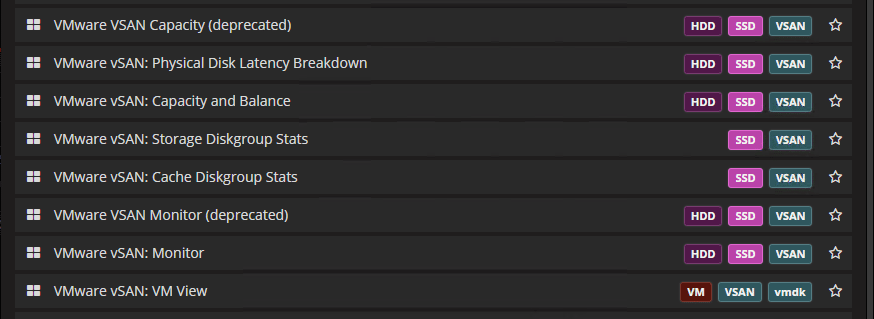
After the update is applied and the appliance reboots, you will quickly see new dashboards that have been added for vSAN 6.7 and legacy vSAN performance monitoring. These include:
- VMware vSAN Capacity and Balance
- VMware vSAN Physical Disk Latency Breakdown
- VMware vSAN: Storage Diskgroup Stats
- VMware vSAN: Cache Diskgroup Stats
- VMware vSAN VM View
- VMware vSAN Monitor
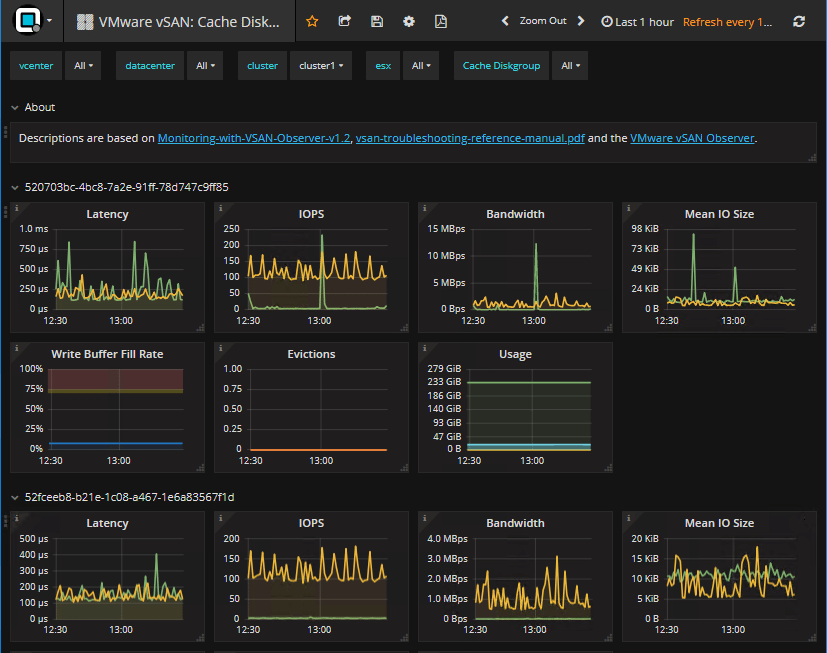
Below is a look at some of the new VMware vSAN 6.7 dashboards including the very detailed performance statistics that are shown by Opvizor 4.9.2.
You can see a very detailed view of your VMware vSAN Cache Diskgroups. The interface of Opvizor 4.9.2 is beautiful and it provides a wealth of information all in one screen.
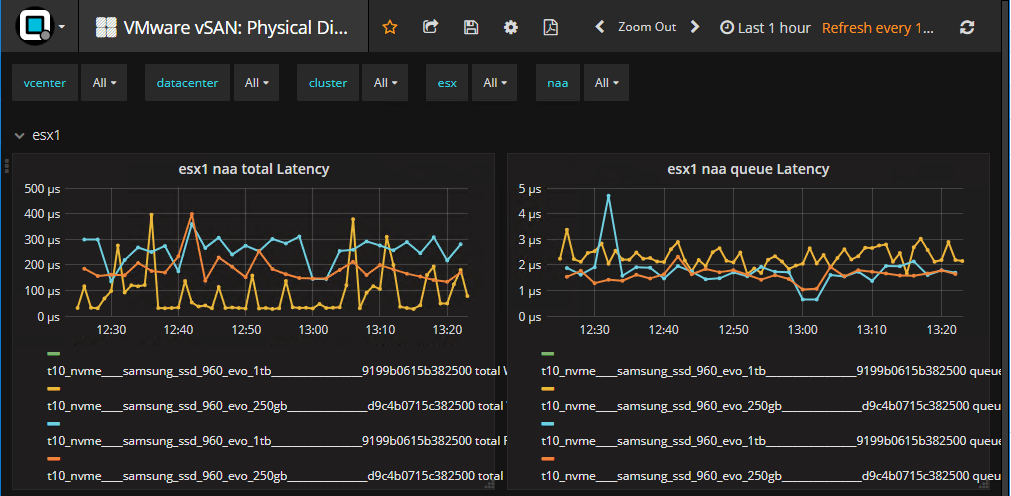
Looking at VMware vSAN 6.7 Physical Disk Latency using the new dashboards found in Opvizor 4.9.2.
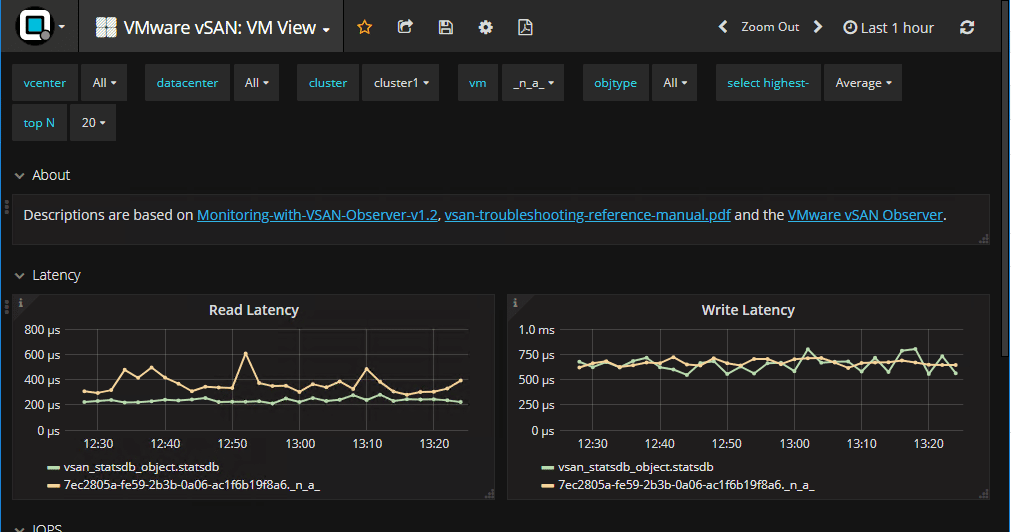
Looking at the VMware vSAN 6.7 environment with a look at performance from the virtual machine perspective.
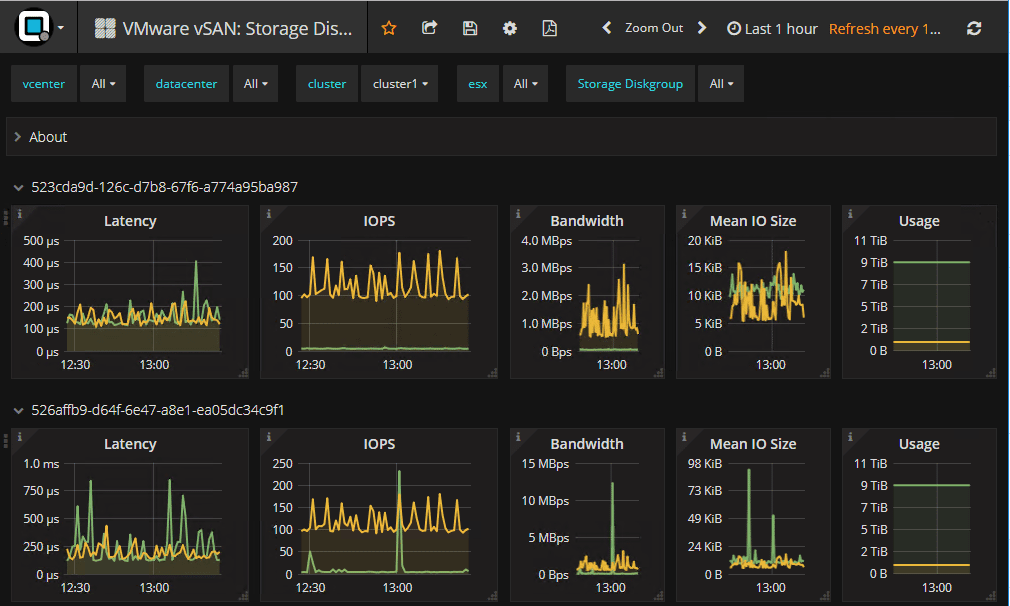
VMware vSAN 6.7 Storage Diskgroup performance analysis including latency, IOPs, Bandwidth, Mean I/O Size, usage, etc.
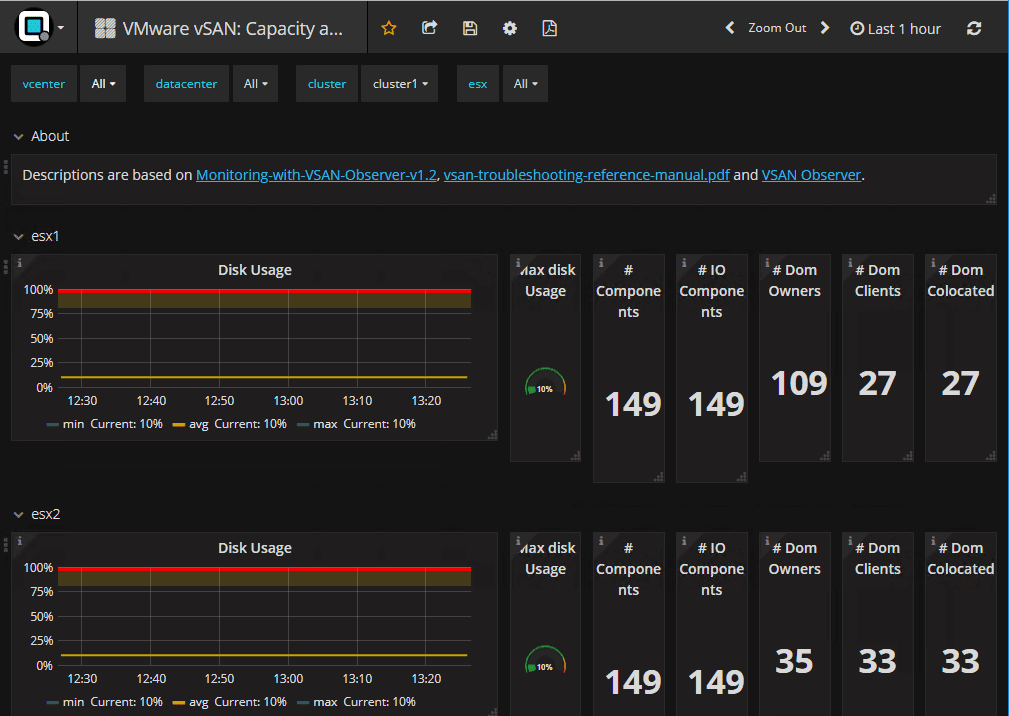
Looking at VMware vSAN 6.7 Capacity and Balance. This dashboard shows components, DOM owners, DOM clients, etc.
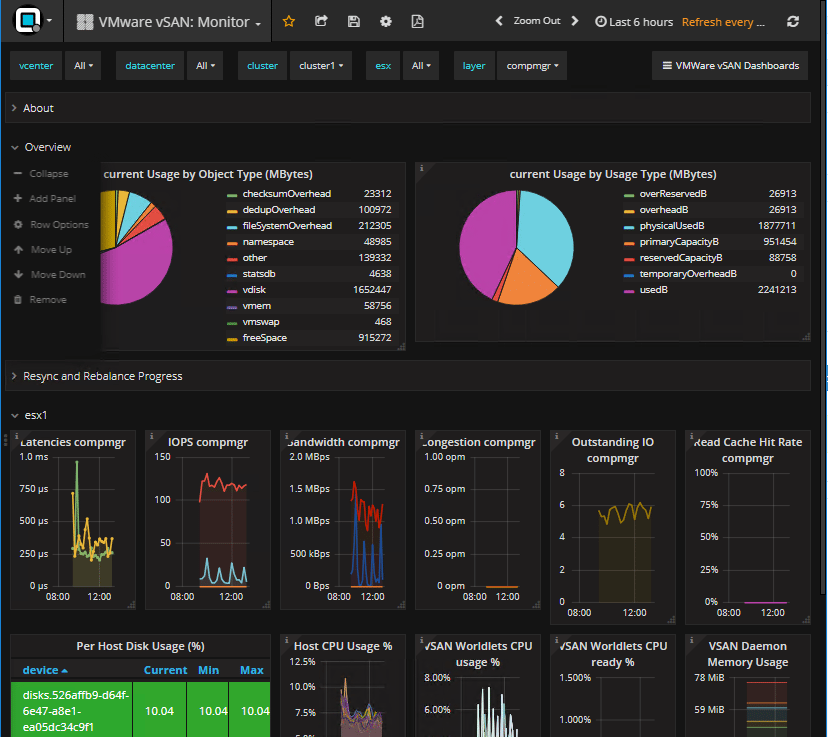
The VMware vSAN 6.7 monitor screen shows all the pertinent vSAN information for all of your hosts. Anything you can imagine can be found in the dashboard. It helps to easily identify a problem point in your vSAN performance across hosts.
Takeaways
Opvizor Performance Analyzer is one of the easiest and most powerful performance analysis tools that you will find on the market today. It is one of those tools that from deployment to real value is literally minutes. With the starter dashboards and the built in dashboards already available, you already have a powerful analysis of any VMware vSphere environment readily available. The new VMware vSAN 6.7 compatible dashboards are a great way to identify problems with any vSAN environment, including VMware vSAN 6.7. You can see just about any statistic you want to see in the components and architecture behind vSAN running on any host. Be sure to check out Opvizor Performance Analyzer as they offer a free 30-day trial to try out the product. You can download it here.