Running a homelab provides an excellent opportunity to learn new technologies, applications, services, troubleshooting skills, and the list goes on and on. When you start spinning up dozens or more applications, it can become difficult to have all of your links and entry points to these various self-hosted services and keep them organized. While creating browser bookmarks is viable, this can be cumbersome and doesn’t scale well when using multiple devices. Hence, the need for a home lab dashboard.
Even with browser synchronization on, the user experience is just not that great. Creating a homelab dashboard is a great way to solve this problem. Many great open-source solutions provide excellent homelab dashboard capabilities. However, I will highlight one I am using in my home lab environment, Dashy and show you guys how easy it is to spin up and customize.
Check out my posts on home lab:
- Home Lab virtualization software I use
- Cooling for Home Labs and tricks to reduce your heat
- Virtual firewall vs Physical firewall in the home lab
- Virtualization vs Containerization in 2022 home lab
Why create a homelab dashboard?
Let’s tease this apart just a bit more. Why create a home lab dashboard? A home lab dashboard allows you to have all your web applications in a single location. Many offer such additional features as pretty graphs, service status, data sources visualization, and other metrics. Some include performance data such as CPU usage.
Create from scratch or prebuilt?
You can build your own homelab dashboard from scratch using components if you want to choose Influxdb, Prometheus, Graphana, and other open-source tools and solutions. However, as mentioned in the outset, there are many premade homelab dashboard solutions available that take the heavy lifting out of creating something from scratch and that have additional features that make them more powerful than a simple bookmark utility.
Before the home lab dashboard, I was constantly playing around with bookmarks and other ways to easily get to services I had stood up in the home lab. However, this is clunky at best. And, there are other features and benefits from a home lab dashboard I wanted to have, such as nice icons, quick and easy service monitoring, themes, cloud backup and synchronization, and the ability to run as a simple Docker container.
What is Dashy?
I want to introduce you to the home lab dashboard I have been using for a while now, called Dashy. Dashy is a really cool open-source project, customizable dashboard containerized app system that allows the creation of nice home lab dashboards, monitor servers, and have quick access to apps running in the environment. It has a wide range of features, including:
Status checks
Keyboard shortcuts
Dynamic widgets,
Auto-feteched favicon icons
Font awesome support
Built-in authentication
Themes
Interactive config editor
Many different layouts
Good documentation
Plugins
I have tried out a few others, including Heimdall, and building my own app. Heimdall is also great and is worth a look if you are looking for the most visually appealing out of the group. However, Dashy, for me, was the best mixture of “looks good,” easy to use and maintain, and does the job. It is also actively developed, which is nice to see the current interest in the product and that it will receive additional features and capabilities.
Let’s see how to spin up Dashy, create the first dashboard with the solution, and start integrating your software into the environment.
How to provision Dashy
To level set, I have an Ubuntu Server 22.04 server setup with Docker installed, nothing special, just a plain configuration with all the updates installed.
Dashy is easy to provision with a simple Docker command. You can use an existing configuration file, which is written in YAML, or you can allow the installation to simply build a new configuration file, which is what it does by default when you spin up a new installation in Docker.
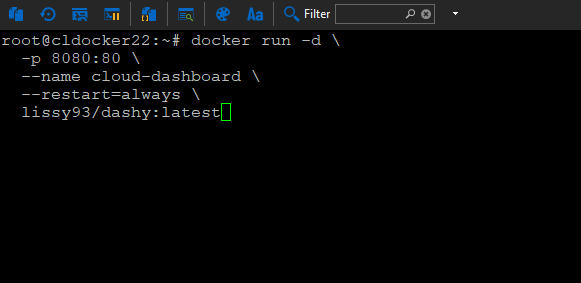
The Docker command you use to configure a new Dashy installation is the following:
docker run -d -p 8080:80 --name cloud-dashboard --restart=always
lissy93/dashy:latest
Pulling the container
The data source for the container is the lissy93/dashy:latest source. Below, we running the command listed above. You can adjust the external port as needed from the 8080 default. Just point the internal port to port 80. The nice thing about the installation is there is no database component that we have to configure as this is all taken care of most likely behind the scenes.
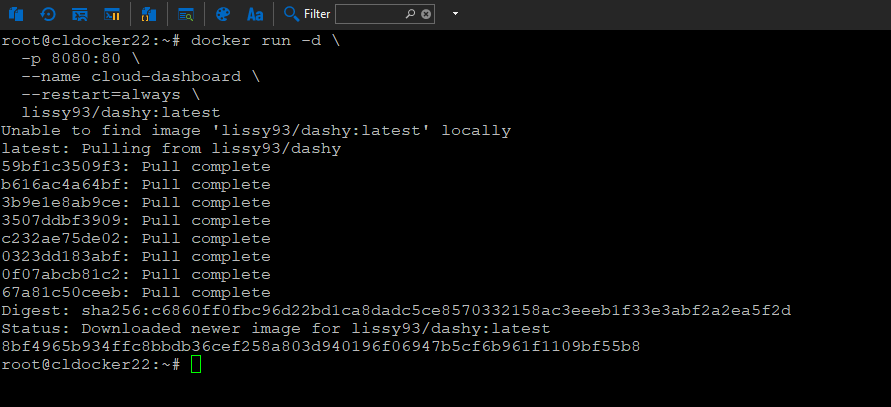
After we execute the initial pull of the Docker container, we will see the container pull from the Docker registry.
Spinning up the container
Once the container is up and running, you can access the solution on port 8080 of your Docker host, where you pulled the container.
Once the platform is up and running, you can access the solution and the default site for managing the home lab dashboard.
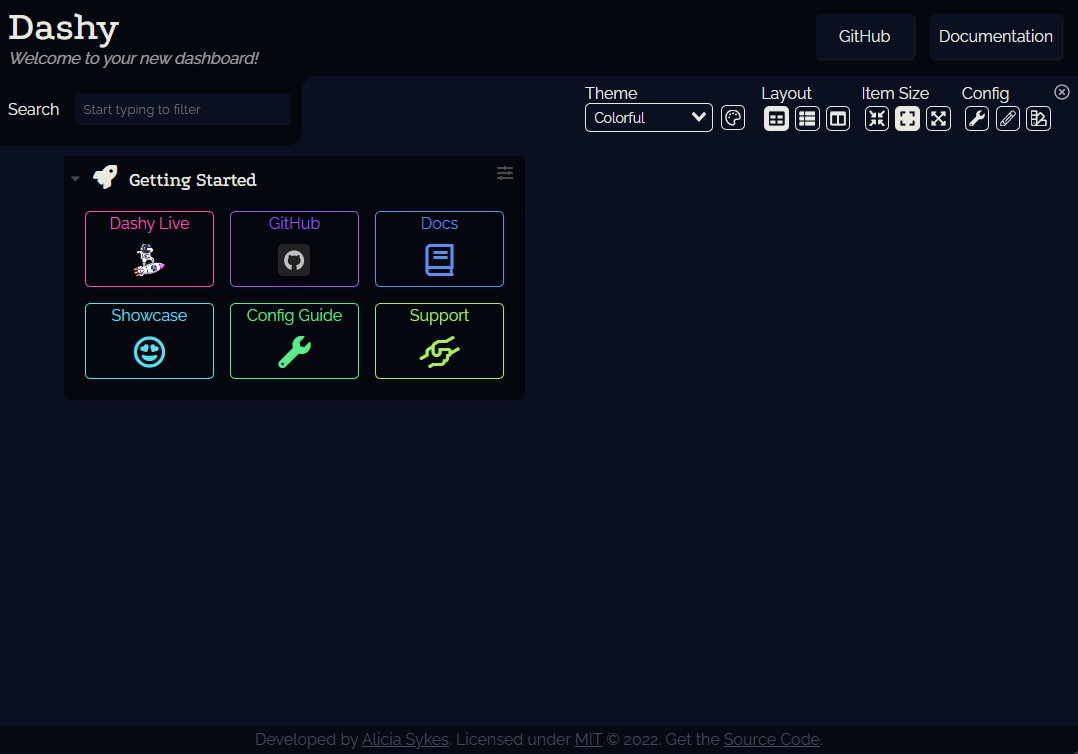
Visiting the Dashy web interface for the first time
When the interface loads, you have the default dashboard that presents itself to you via the web interface. You will see the default tiles created for apps on the screen. These link back to documentation, github and other Dashy resources, so it is great it points to these locations for getting up and running with apps in Dashy. Take note of each menu on the right-hand side of the upper top. You will see the options for the layout, item size, and config.
By default, it does not prompt you for a password when you access the service.
A note on authentication for users and password access
Dashy has a basic login page included with username and password capabilities, and frontend authentication. You can enable this by adding users to the auth section under appConfig in your conf.yml. If this section is not specified, then no authentication will be required to access the app, and it the homepage will resolve to your dashboard.
The process to create a new dashboard in Dashy
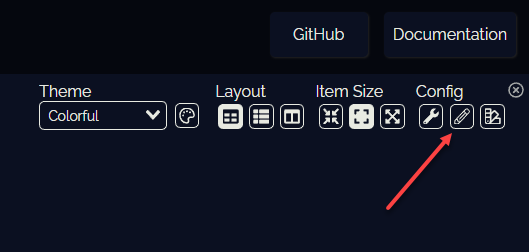
The process to create new dashboards is easy. Click the pencil icon in the upper right-hand corner.
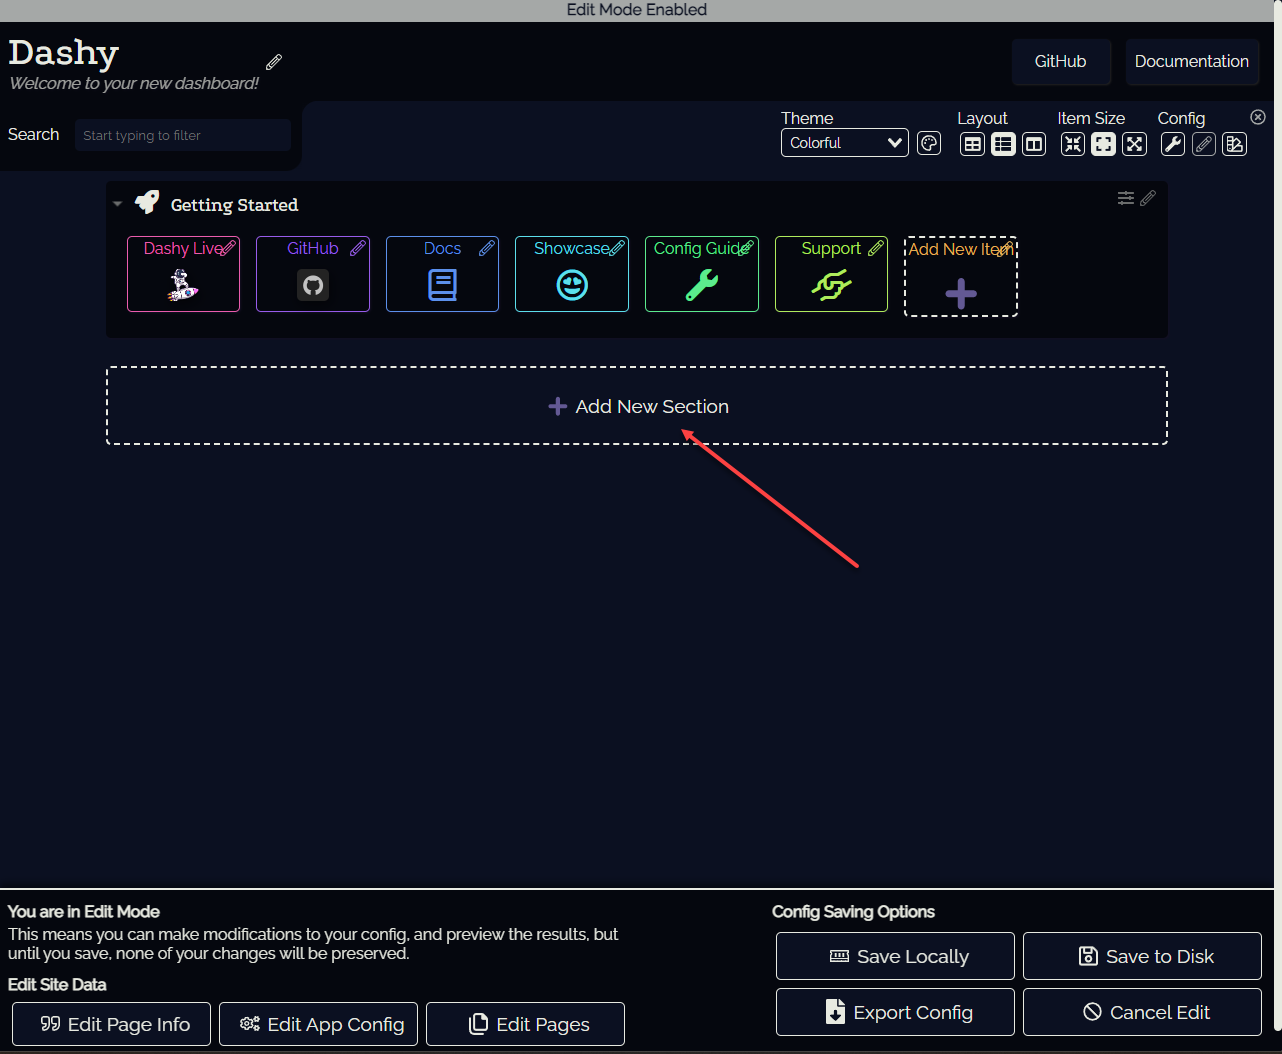
Click the Add new section button.
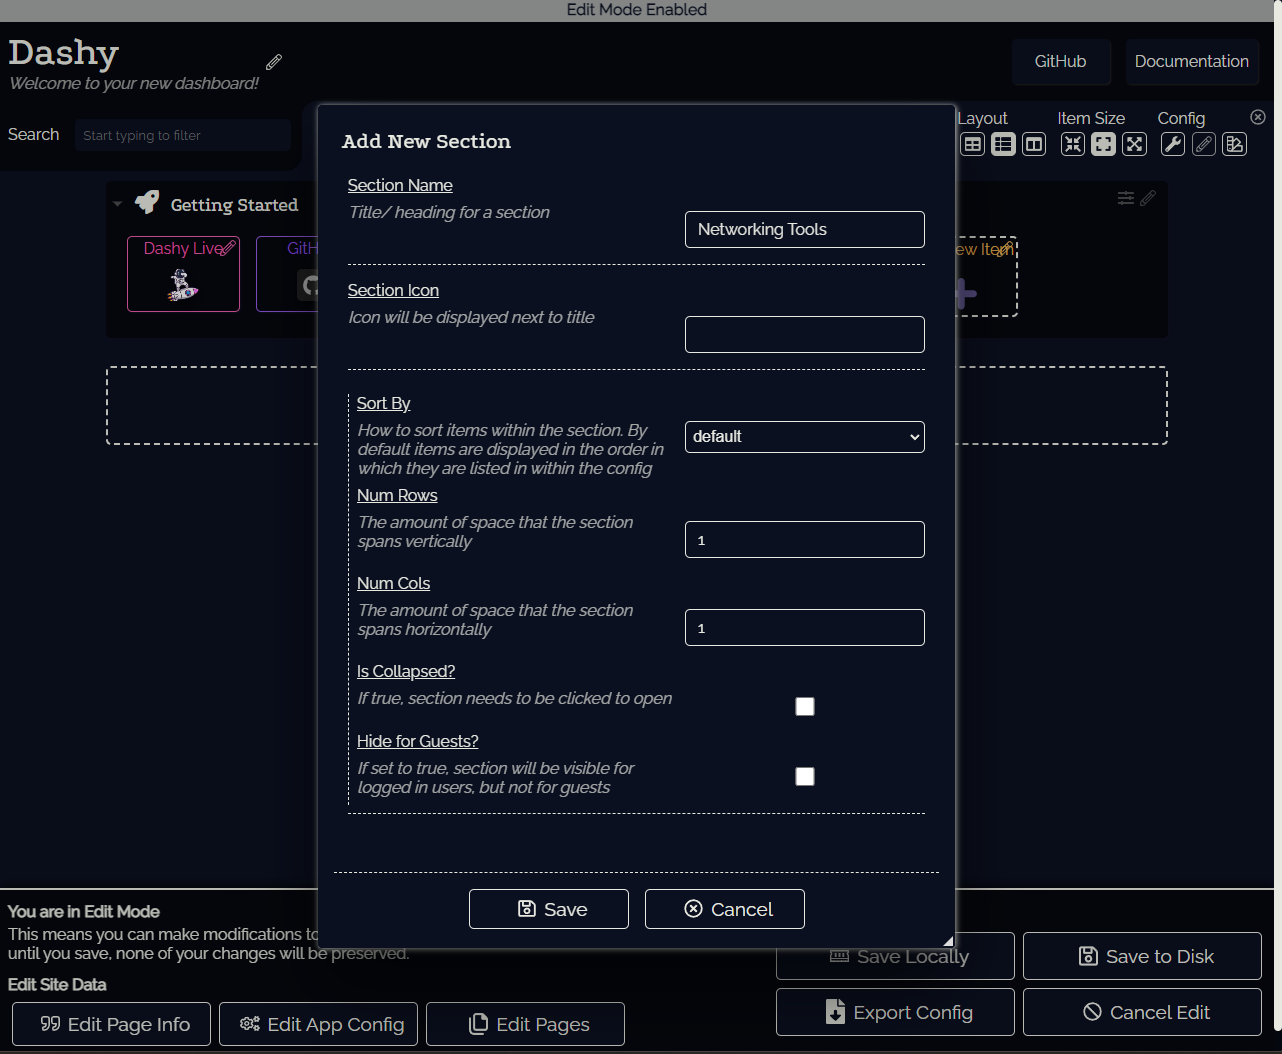
You will get the configuration dialog to configure the new section name, etc.
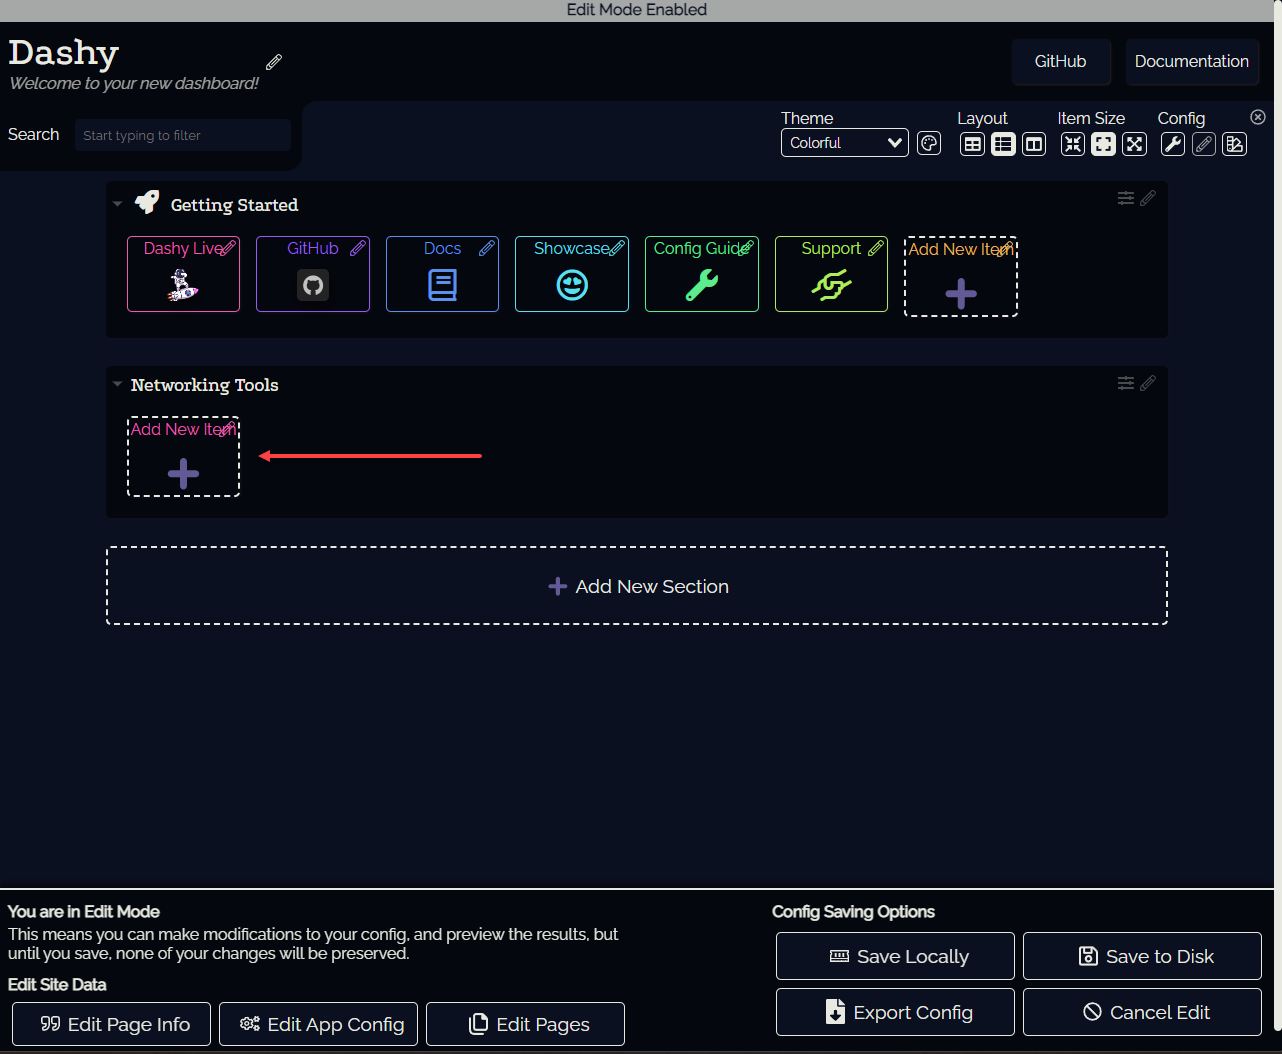
Once the new section is added, you can then start adding items to the new section.
The new item configuration dialog is similar to the new section dialog.
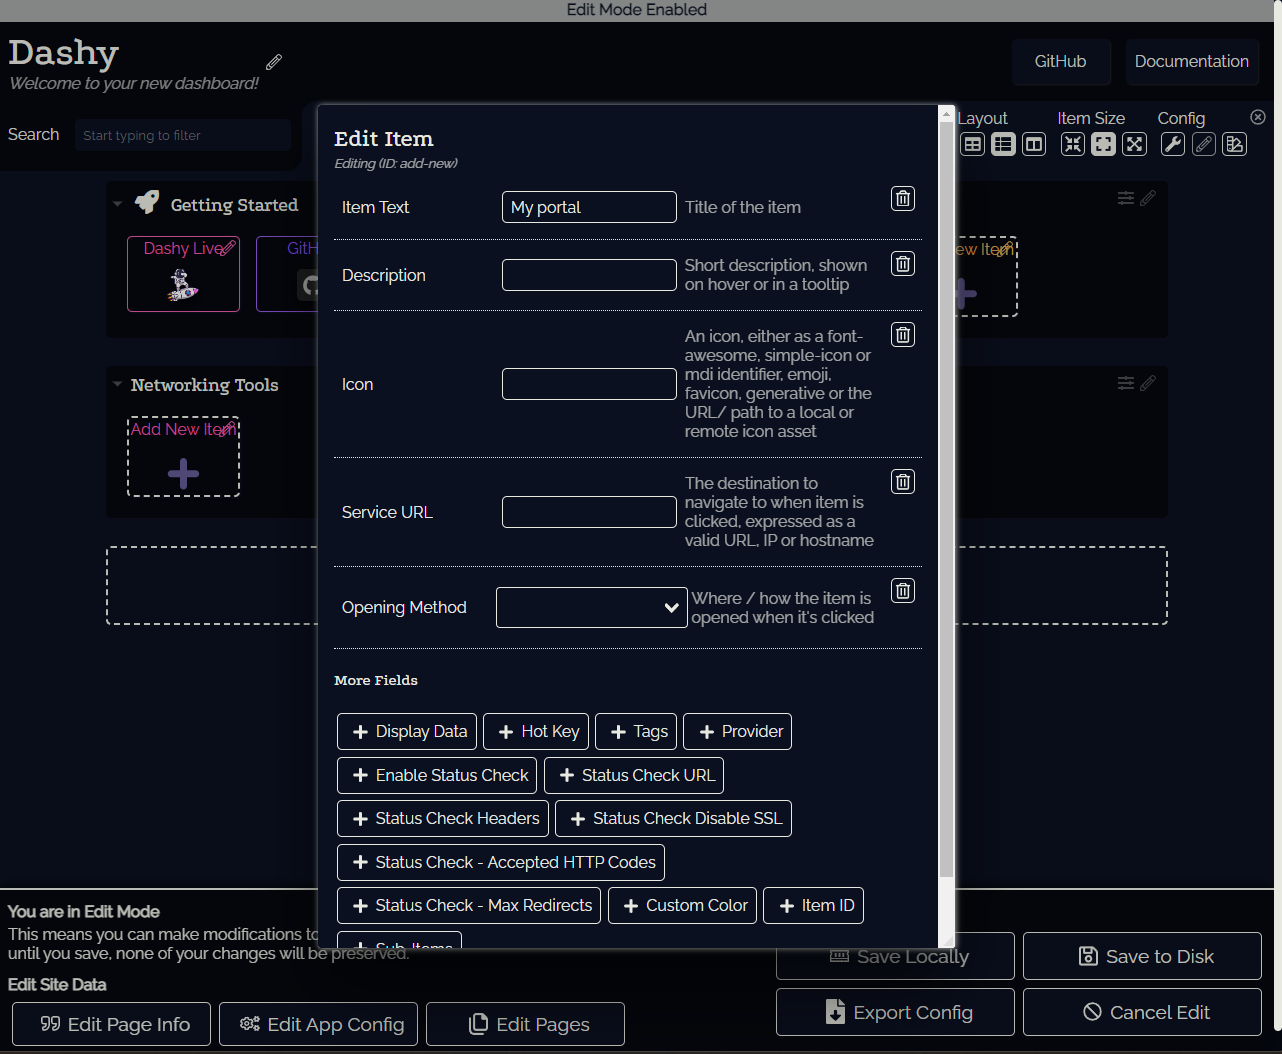
Also, one of the great features of Dashy is the various configuration and status checks you can make with each new item. You see this when editing an item or when you manage a new item you have created. When you add a server box to monitoring and the dashboard, you have the ability to get quick status checks of systems on the reachability of the server, service, container, etc.

You can also choose the opening method for the new dashboard service, such as if you want to open a new tab or use the existing tab when you navigate to the service.
Write code and edit code with the built-in editor
As part of the configuration settings, Dashy has a built-in code editor that allows editing custom code for your home lab dashboards. There are many examples of the YAML configuration on the community page.
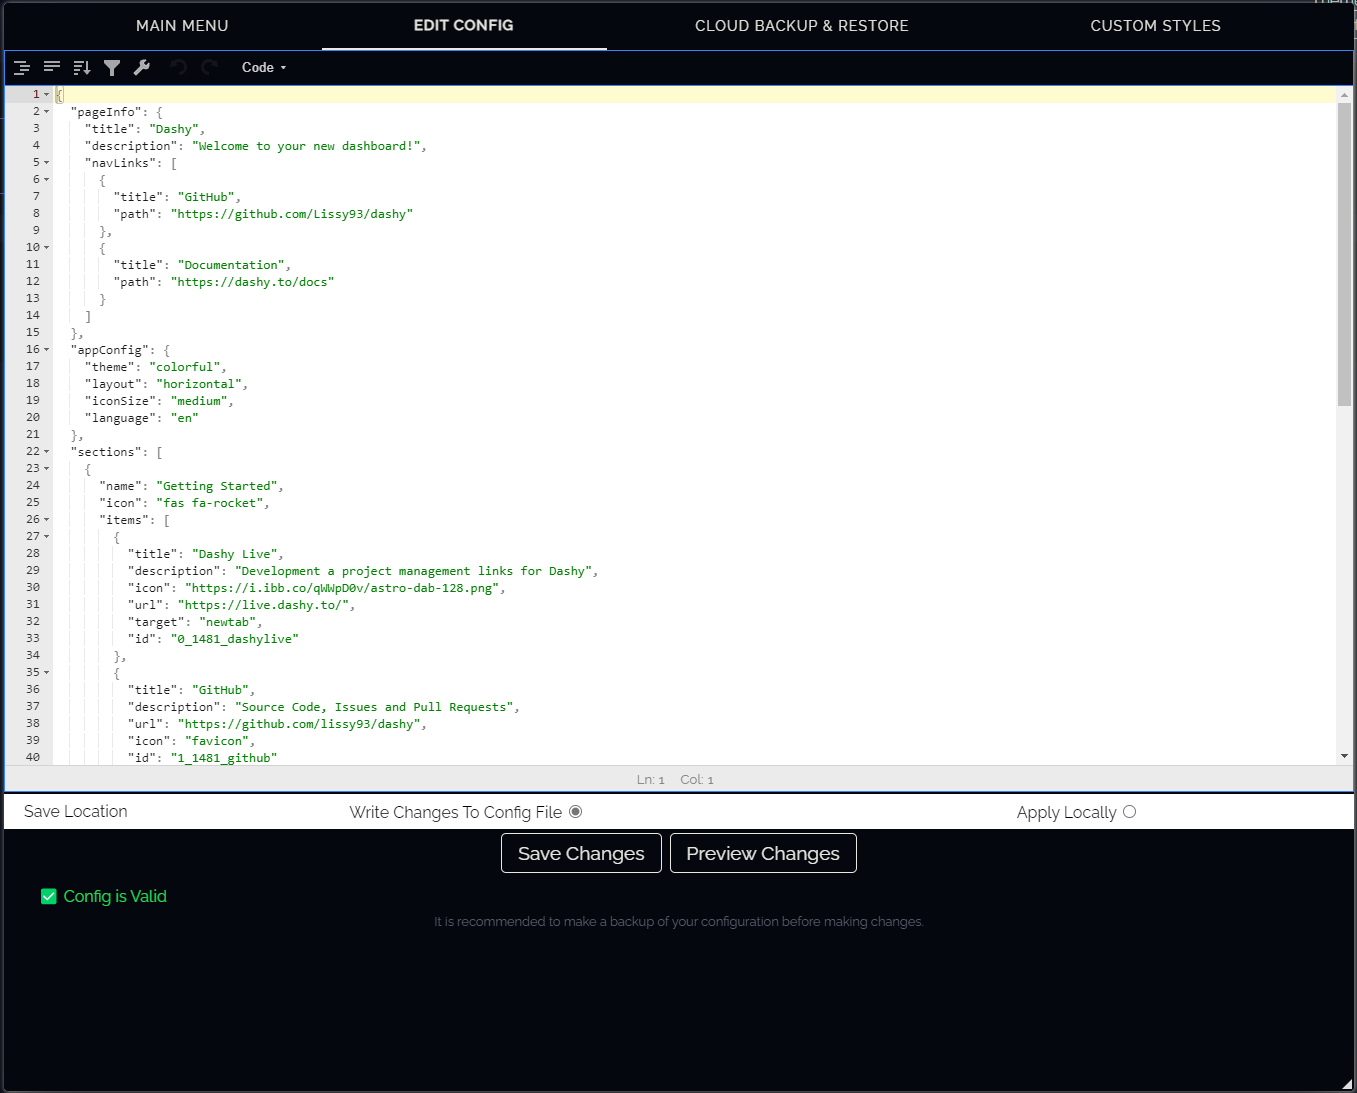
Viewing the editor
The built-in code editor allows you to edit the code of the running configuration file in real-time and then save the changes, making them live when you refresh your display. The great thing is there are no low-level commands you have to execute, you simply access this from the web interface.
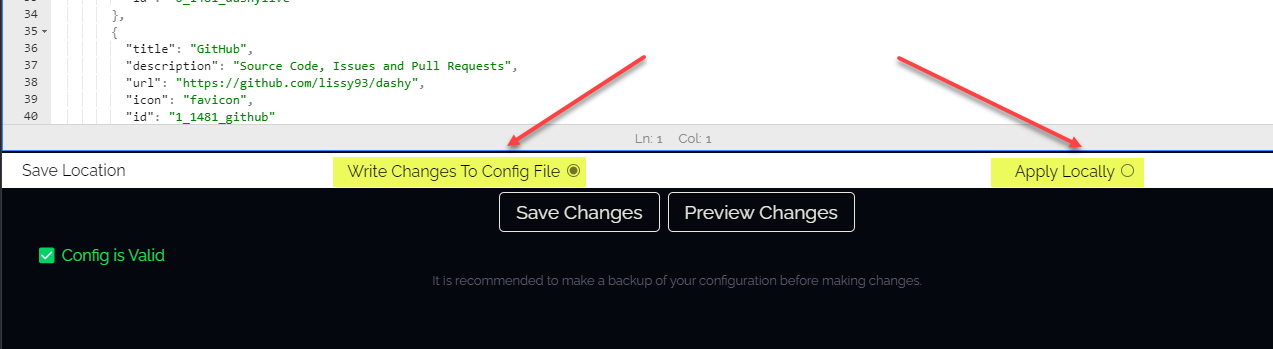
Making changes and saving the changes to different locations
When you make changes to the Dashy configuration, there are essentially two locations you can save your configuration changes. If you choose the Write changes to config file, these will be written to the running configuration file. If you choose the Apply locally option, these are written to the local browser session.
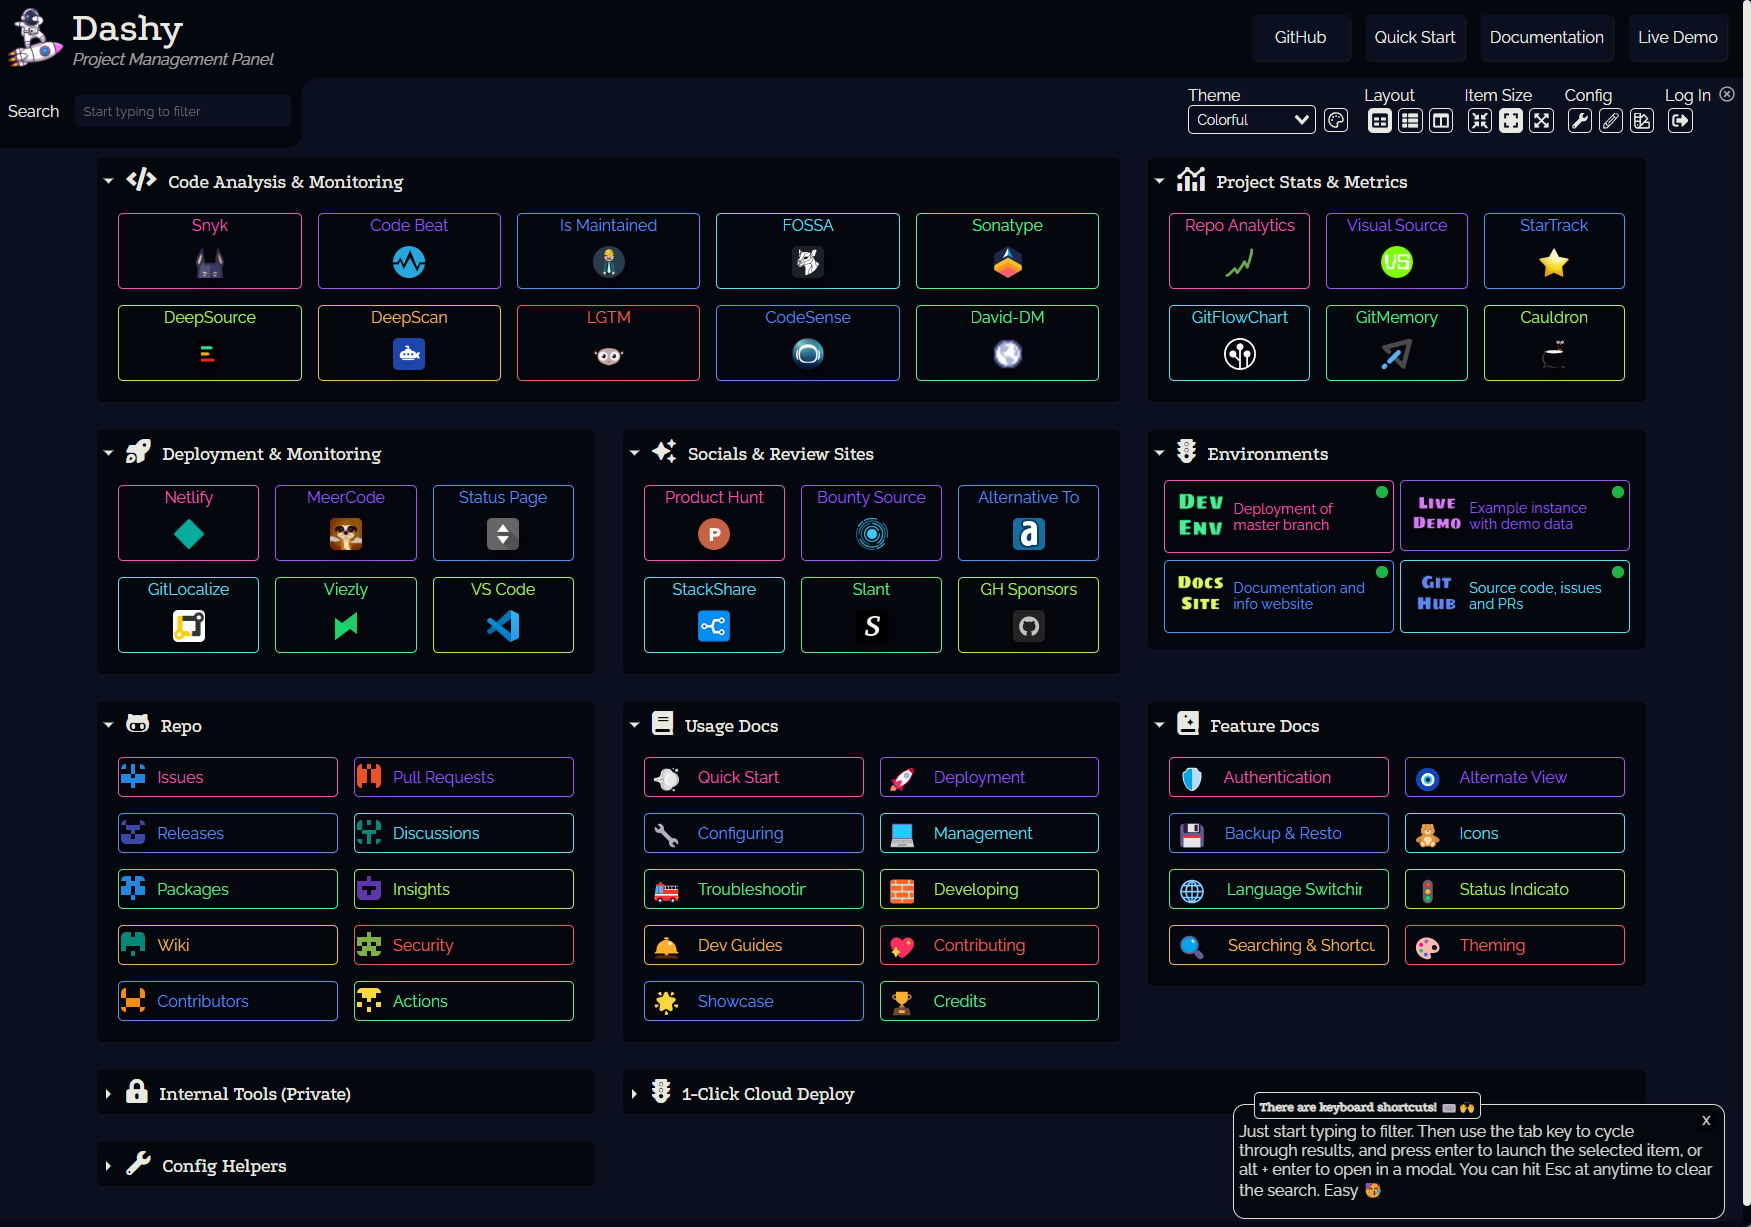
Home Lab Dashboard example created in Dashy
Dashy provides a live example of what your home lab dashboards can look like. Note the following example that provides an awesome look at what is possible:
Wrapping Up Home Lab Dashboard with Dashy
As you can see from the pictures of what is possible with the Dashy home lab dashboard, you can create really amazing home lab dashboards with the Dashy solution. Again, there are many other open-source projects out there that allow creating really amazing home lab dashboards. Dashy is just one example of a great solution out there.
For me, it is great and does everything I want it to do and allows creating really nice home lab dashboards for quickly accessing all services in the environment. You can check out Dashy here: Dashy | Dashy
More in this topic


Discuss this in the Community
Google is updating how articles are shown. Don’t miss our leading home lab and tech content, written by humans, by setting Virtualization Howto as a preferred source.
About The Author

Hello,
After I watch your video, I decided to test dashy.
I have an issue that I didn’t find a way to resolve so far, I hope you may be able to help me.
The status check don’t work if I use the local dns name set in pihole for my servers/container, even if I specify the IP of my pihole as dans in the dashy container.
Any idea what I can do to solve this?