Monitoring VMware vSphere Infrastructure with Paessler PRTG
Monitoring an environment is one of the most complex tasks that administrators are tasked with doing in an environment. Today’s VMware vSphere administrators may have multiple hosts, vCenter Servers, switches, storae arrays, network connections, and many other things that need to be successfully monitored to have the entire picture of the health of the infrastructure environment. Paessler’s PRTG product is a great solution that allows VMware vSphere administrators to have the tools needed to monitor not just the VMware environment, but everything in between. In our post today, let’s take a look at Monitoring VMware vSphere Infrastructure with Paessler PRTG to see how this tool can be used to monitor VMware vSphere and other infrastructure components.
Why PRTG to monitor VMware Infrastructure?
In the realm of VMware vSphere, there are many monitoring solutions that allow pulling various VMware specific metrics that are extremely useful and quite powerful. A readily known solution for doing this is VMware vRealize Operations Manager. So, I am not comparing PRTG here with solutions such as vROPs which is probably the best solution for pulling VMware specific metrics and information about vSphere in particular. What I think PRTG is really great at is being able to monitor the entire VMware Infrastructure environment, hence the title of “Monitoring VMware vSphere Infrastructure with Paessler PRTG. The infrastructure term here in my mind encompasses everything (anything that is in the path of data in and out of the VMware vsphere environment) – Internet connection, switches, health of physical infrastructure across the board, etc. PRTG can literally monitor anything including:
Traffic, packets, applications, bandwidth, cloud services, databases, virtual environments, uptime, ports, SSH, IPs, hardware, security, web services, disk usage, physical environments, IoT devices and almost everything you can imagine.
It supports most technologies – SNMP (all versions), Flow technologies (i.e. NetFlow, jFlow, sFlow), SSH, WMI, Ping, and SQL. Powerful API (Python, EXE, DLL, PowerShell, VB, Batch Scripting, REST) to integrate everything else.
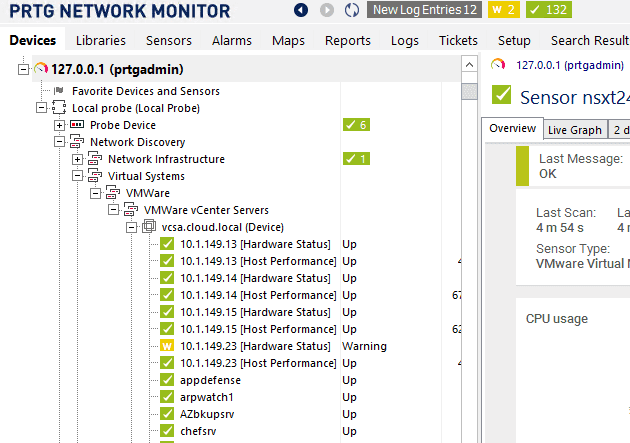
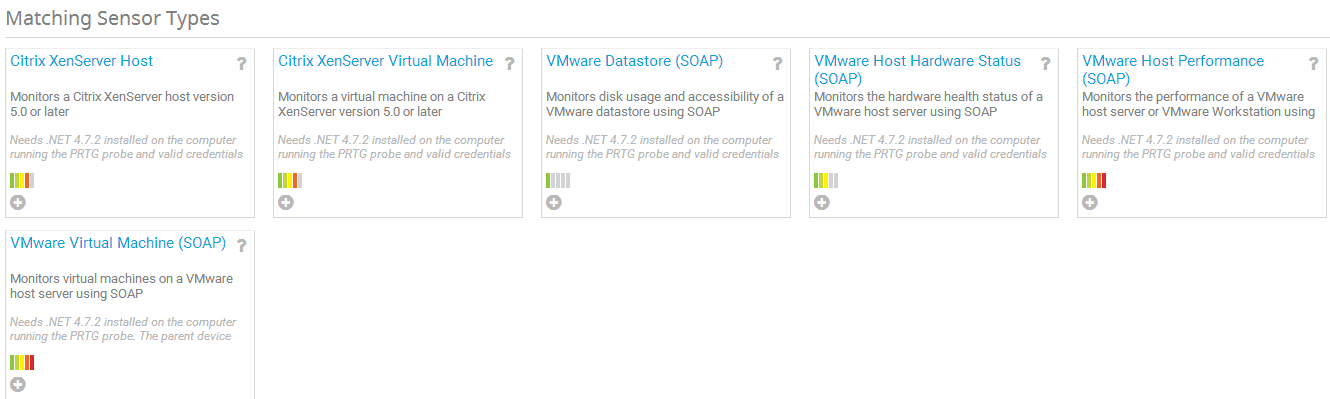
PRTG makes use of the concept of “sensors” to monitor the environment. There are VMware specific sensors that can be added to pull information about the VMware vSphere environment and it takes the heavy lifting out of discovering your VMware resources. The Network Autodiscovery feature allows scanning network segments defined by IP ranges, or in the case of a VMware vSphere environment, when you add the VMware Virtual Machine (SOAP) sensor to your vCenter object, it automatically pulls all the virtual machines from vCenter inventory and adds them as devices with default performance and other monitors.
PRTG has a variety of built-in default sensors:
- VMware Datastore
- VMware Host Hardware Status
- VMware Host Performance
- VMware Virtual Machine
You can add any of these sensors to your VMware vCenter object once added to PRTG.
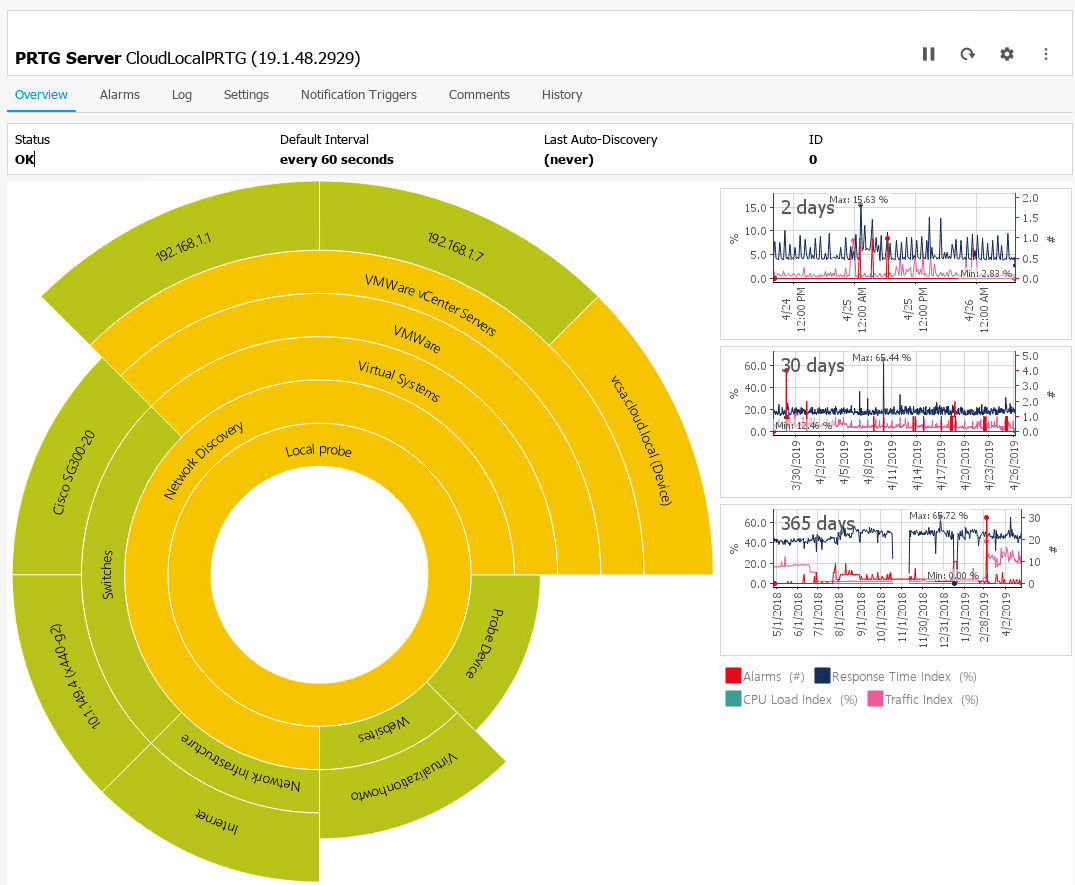
Below, you can see the vCenter Server being monitored. After I added the VMware Virtual Machine sensor and Hardware sensors, you can see below, I started getting information on VMs and host hardware and performance.
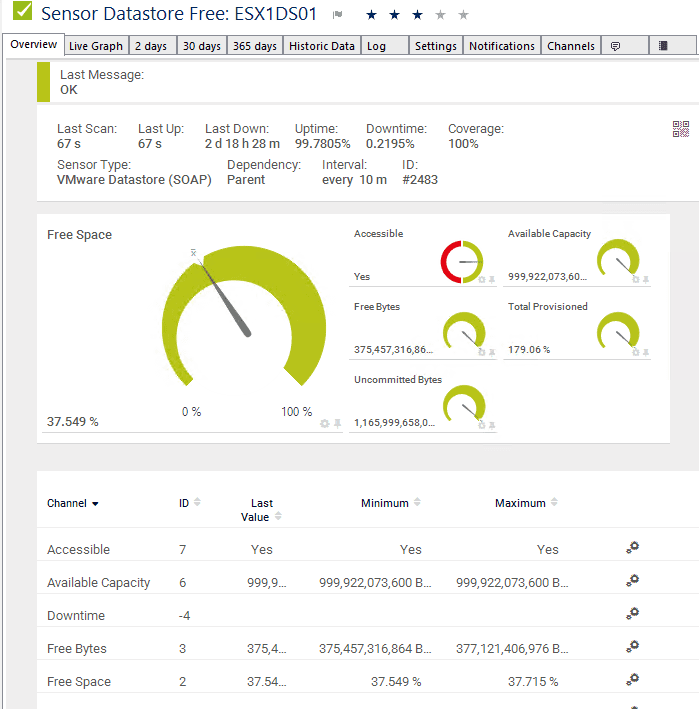
Below is the detailed information you get from PRTG on the datastore. This includes:
- Accessibility
- Free Space
- Uncommitted bytes
- Available Capacity
- Total Provisioned
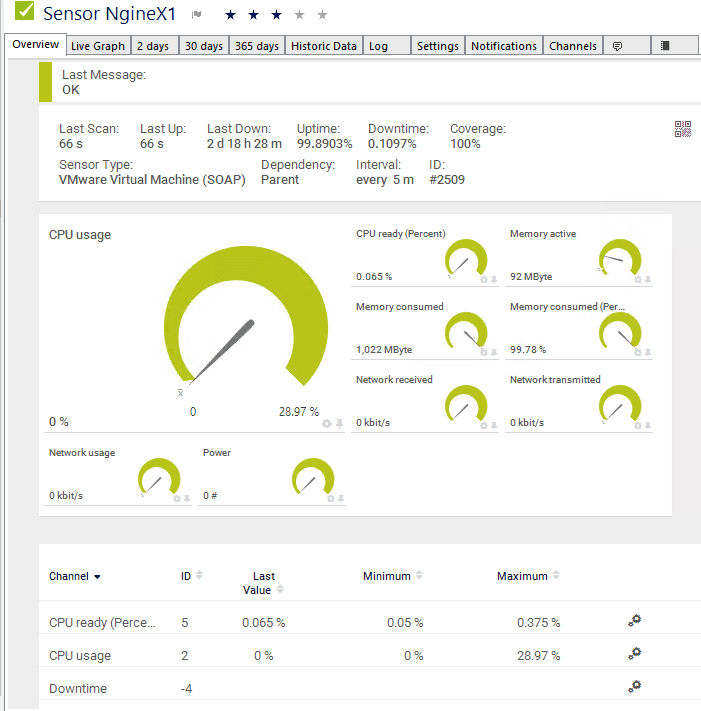
The virtual machine sensor provides a wealth of information for review and monitoring purposes:
- CPU usage
- CPU ready (Percent)
- Memory consumed
- Memory active
- Memory consumed percentage
- Network received
- Network transmitted
- Network usage
- Power
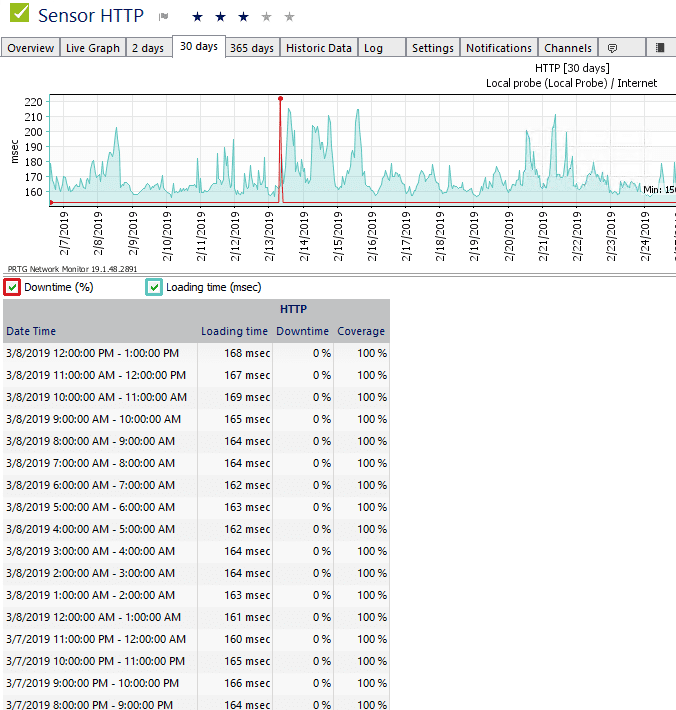
When I mentioned above, monitoring any environment needs to monitor the big picture. If you only monitor vSphere specifically, there may be factors outside of vSphere that could be affecting performance, etc such as a switch, Internet connectivity, or any other number of things that could be going on. Below is a simple Internet connectivity sensor that you can configure with PRTG to monitor Internet connectivity. The great thing with each sensor is you can easily see the 30 day history to see the trend of performance, health, or other metrics.
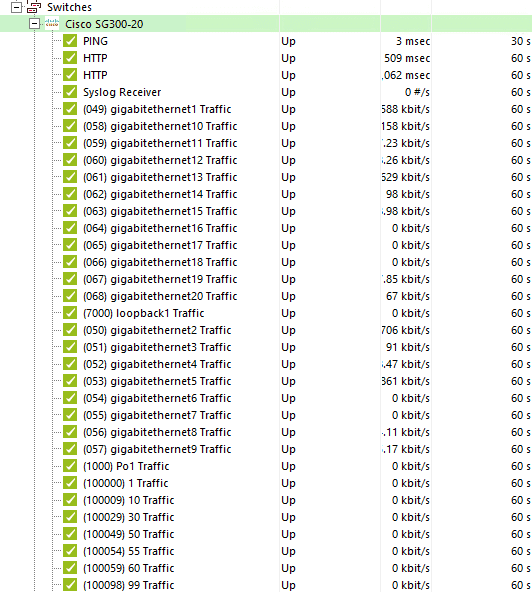
Below, I have a detailed view of a Cisco SG300-20 switch including down to the port view of performance, and other traffic metrics.
I recently spun up a PRTG monitor the other day for a client to monitor a DHCP scope that was experiencing pressure from a usage standpoint. This was easily done using PRTG and a custom SNMP sensor. The possibilities are endless!
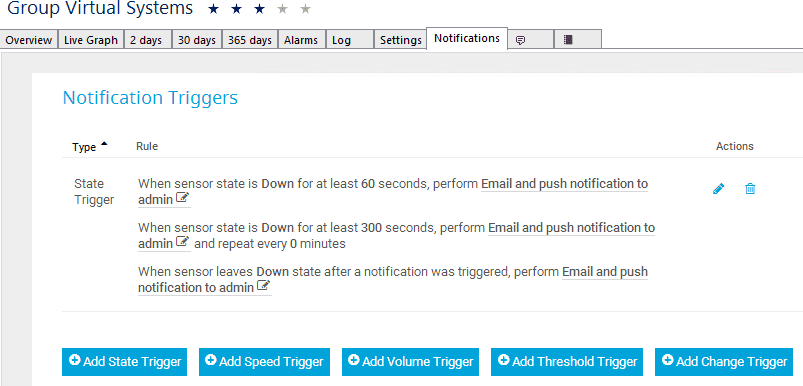
I also like in PRTG you have an easy mechanism to setup notifications and escalation of notifications such as you want the notifications to start paging out after a certain threshold of time or number of “downs”.
You can also add various triggers including:
- State trigger
- Speed trigger
- Volume trigger
- Threshold trigger
- Change trigger
Monitoring Lab or Production Environment with PRTG
PRTG is a great company with a great product for monitoring. They include a very generous 100 sensor Free edition that allows spinning up 100 sensors that are fully functional which is a great way to stand up PRTG in a home lab or work lab. The various monitors that can be configured are endless and the technologies you can use are numerous and extensive.
I have been using PRTG in the home lab and various customer sites for years now and it has worked beautifully as an all encompassing monitoring solution to capture an overall footprint of the environment health.
PRTG offers cloud hosted solutions as well as cluster configurations for high-availability and performance that organizations can take advantage of in various use cases.
PRTG is very open about pricing of sensors here: https://www.paessler.com/prtg/pricing
Be sure to check out PRTG by way of a free unlimited trial that goes into the Free version after the trial expires. Again this is a great product and provides tremendous value even in the free version! Great for home labbers and production alike!