Monitoring VMware vSAN with vSAN Observer
VMware vSAN is certainly the market leader in software defined storage solutions. VMware vSAN, especially in the new VMware vSAN 6.7 release is a powerful platform that allows organizations to have a powerful software defined approach to managing and provisioning storage. Once organizations deploy VMware vSAN in their environments, the need arises to ensure proper monitoring takes place especially if any problems with performance or otherwise arise. In case you haven’t had a chance to take a look at VMware vSAN Observer, it provides a very intuitive and helpful look at very detailed performance metrics when it comes to VMware vSAN. This allows you to have even greater visibility to what is going on under the hood with your vSAN environment. Let’s take a look at monitoring VMware vSAN with vSAN Observer and see what visibility to performance this tool allows vSAN administrators.
Installing VMware vSAN Observer in VMware vCenter VCSA 6.7
VMware vSAN Observer is powered by the Ruby vSphere Console. The VMware Fling looks to be deprecated on the official Fling site. However you will find the Ruby vSphere Console is already a part of VMware vSphere VCSA 6.7. Note the message received if you attempt to install the Ruby vSphere Console inside of VCSA 6.7 appliance.
- gem install rvc – this is the documentation from the fling
However, as you see below, you will receive the message “rvc” conflicts with /usr/bin/rvc
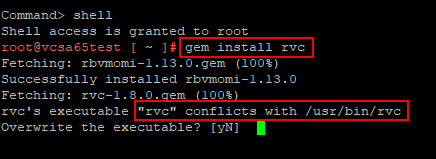
So your VCSA 6.7 appliance already comes with the ruby console installed and ready for using the vSAN Observer monitoring utility.
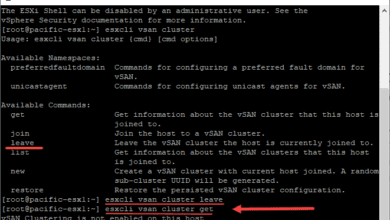
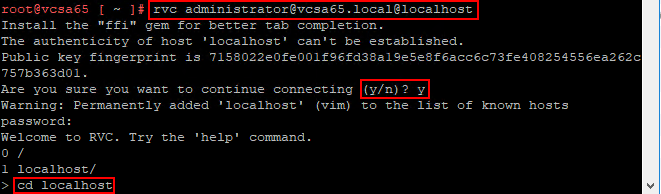
Now that we have verified that we already have the Ruby vSphere Console, we can login to the Ruby vSphere Console.
- Login to the Ruby vSphere Console
- Accept the fingerprint of the connection
- Issue the cd localhost command
- Issue the cd <your Datacenter name>
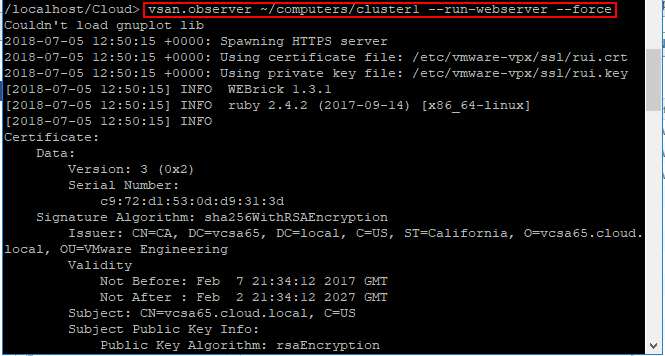
Now, we can start the vSAN Observer web server and start collecting performance statistics. To begin the vSAN Observer web server and start collecting the key performance statistics in the environment. To begin the vSAN Observer web server, you can easily get started by issuing the command:
- vsan.observer ~/comnputers/<your cluster name> –run-webserver –force
- If you want to only run it via HTTP, you can use the command vsan.observer ~/comnputers/<your cluster name> –run-webserver –force –no-https
Monitoring VMware vSAN with vSAN Observer
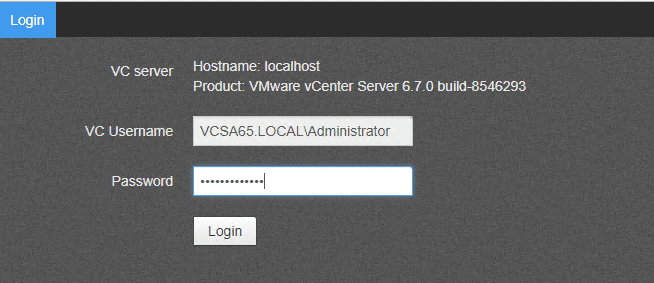
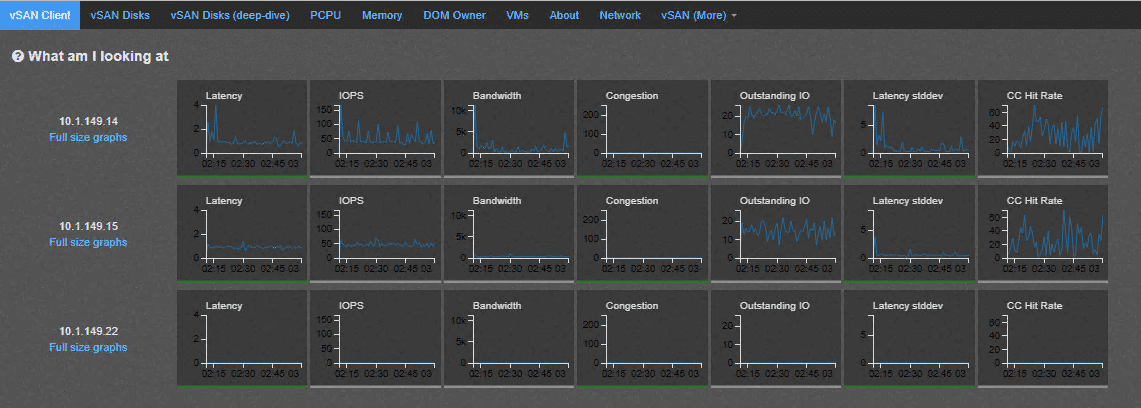
Now that we have the web server up and running and vSAN Observer is capturing performance statistics, we can login to the interface and start looking at the information being captured. The link to login after you start the vSAN Observer web server is:
- https://<your VCSA appliance FQDN or IP>:8010
Here, you simply login with your VCSA credentials.
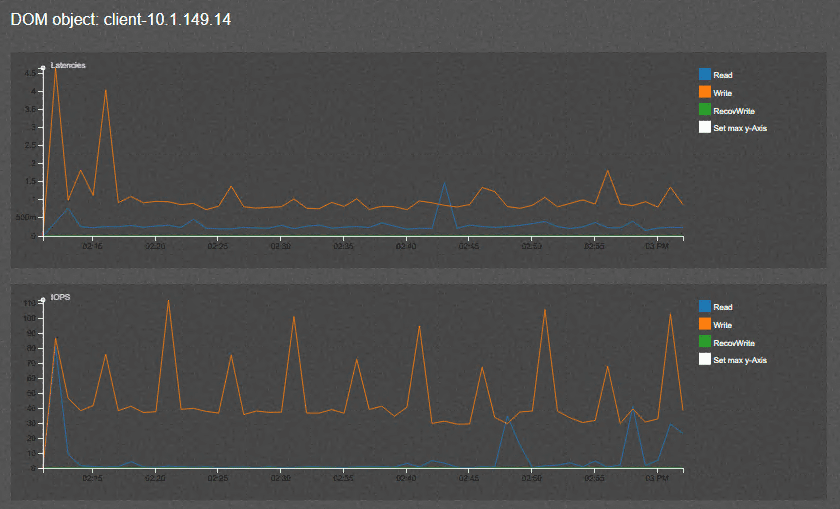
DOM is responsible for the creation of virtual machine storage objects from local components across multiple ESXi hosts in the vSAN cluster by implementing distributed RAID. There are 3 roles within DOM; client, owner, and component manager.
Client – Provides access to an object. There may be multiple clients per object depending on access mode.
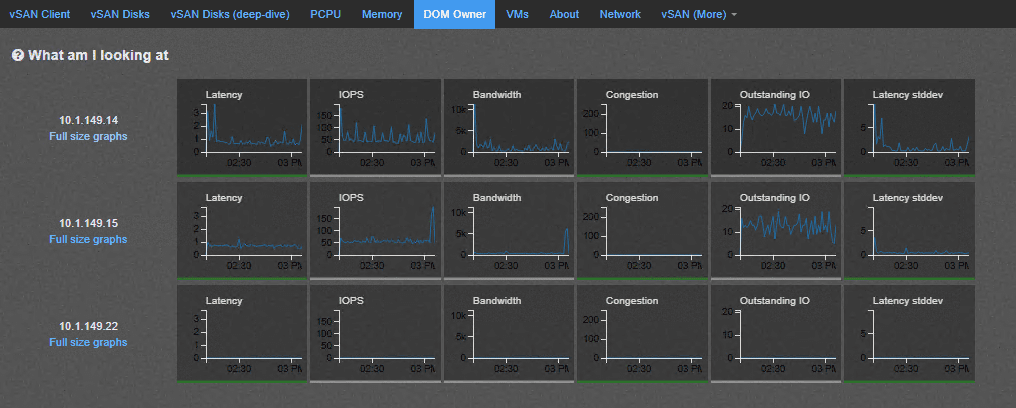
Owner – Coordinates access to the object, including locking object configuration and reconfiguration. there is a single DOM owner per object. All objects changes and writes go through the owner. This may typically be the same host, but this is not guaranteed and they may be on different hosts.
Component Manager Interface for LSOM and the physical disks.
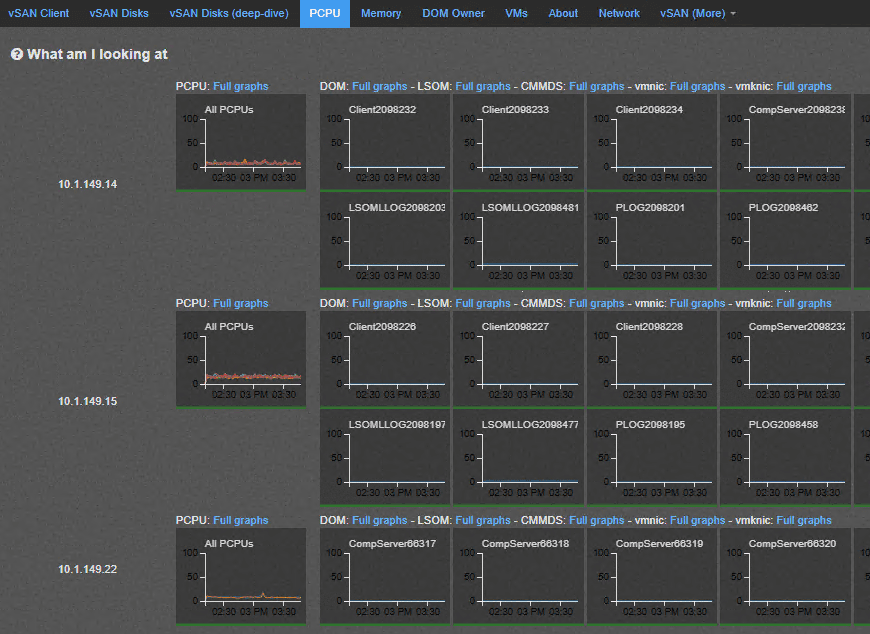
PCPU shows the overall CPU usage and also per component CPU usage statistics of vSAN. It shows CPU usage from the overall host perspective as well as from the view of vSAN worldlet and networking worldlet. A worldlet is a process that does some work on behalf of vSAN.
As mentioned the DOM owner coordinates the writes and other changes to VMs.
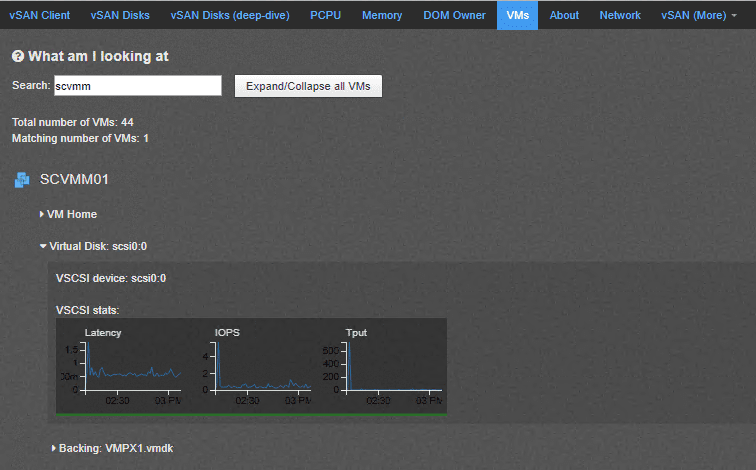
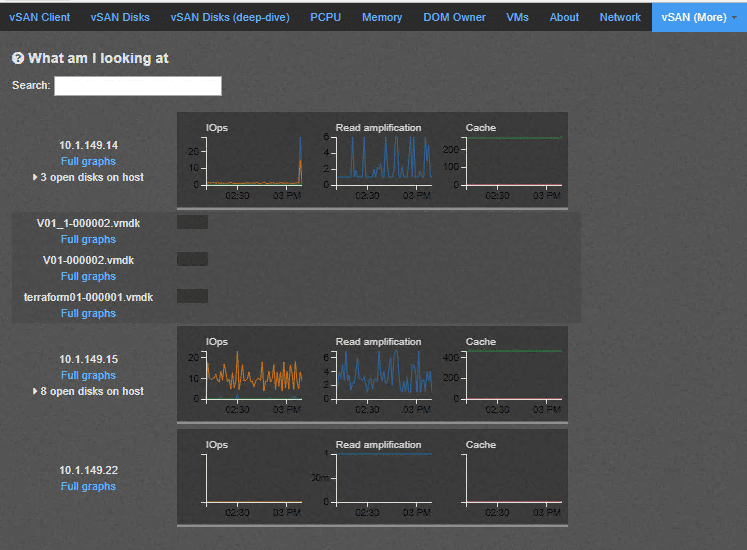
A really great view with vSAN Observer is the VMs dashboard view that allows you to drill down onto a specific virtual machine and see the vSAN performance of that specific VM along with the specific VMDK along with latency and IOPs.
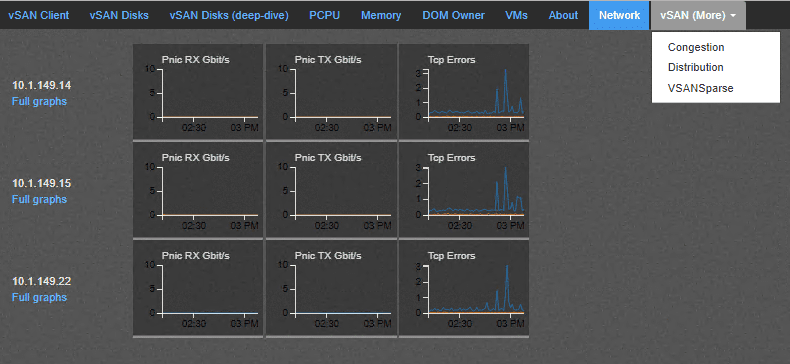
The networking graph as you would expect shows all the pertinent networking statistics of the vSAN environment that you can look into in detail based on the host.
The vSANSparse dashboard allows you to see the snapshots that are currently in place and various statistics of the sparse disks.
Great VMware vSAN Observer Resources
The following are a few great vSAN Observer resources to get your feet wet with the utility:
- https://www.vmware.com/content/dam/digitalmarketing/vmware/en/pdf/products/vsan/vsan-troubleshooting-reference-manual.pdf
- https://labs.vmware.com/flings/ruby-vsphere-console#summary
Takeaways
Monitoring VMware vSAN with vSAN Observer is a great way to have really in depth analysis of performance in the various key performance indicator areas of VMware vSAN. The utility is extremely easy to get up and running on with VCSA 6.7. The Ruby vSphere Console is already available to be used in the VCSA 6.7 appliance. Simply start the utility web server and start collecting performance analysis of VMware vSAN. The metrics collected can help to narrow in on any possible performance issues and the underlying reason or area where the bottleneck exists. Stay tuned for more vSAN Observer tidbits and other vSAN Performance utilities.