



One of the primary learning exercises that I think can benefit most in the home lab is getting more familiar with Linux. Linux though, has a way of letting you do things the hard way for years without ever tell you there is a better command or way to do something. I have had this happen to me more times than I care to admin. However, most of the time this isn’t an obscure utility buried somewhere. Most of the tools and commands that are helpful are found right there in the default Linux command line. When you start running docker hosts, Kubernetes clusters, NAS systems, reverse proxies and other types of systems on Linux, you usually run into questions you need to answer. These can be like “what process owns this port?” Or, “What route is Linux actually going to use?” Let’s look at 7 Linux commands that I think many home labbers discover later than they should.
1. ss
One of the first troubleshooting tools that I think many come to learn about late is the ss command. I can’t tell you how many times in troubleshooting a service that I have asked the question, is my host actually “listening” on the port the application is supposed to listen on?
You might spend a ton of time actually troubleshooting outside your host, looking at your firewalls, Docker networking, etc, when the machine was never listening to begin with.
A common set of switches to use with the ss command is below that displays listening TCP and UDP sockets along with the processes they are associated with:
ss -tulpn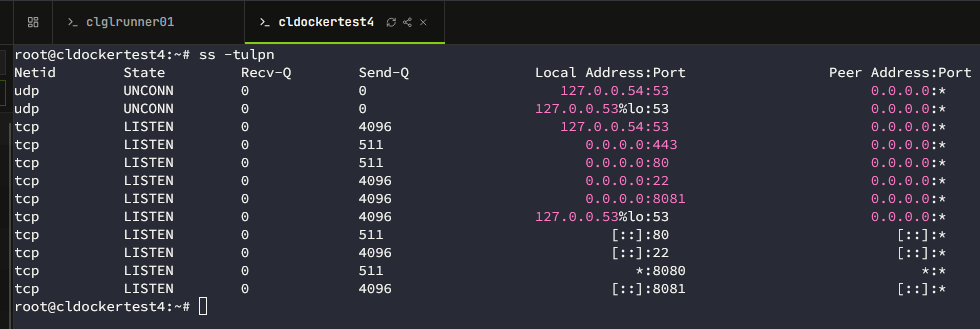
Here is a breakdown of what each of those options do:
-t   TCP sockets
-u   UDP sockets
-l   listening sockets
-p   process information
-n   don't resolve service names
If you are only interested in TCP, you can drop the “u” and just run:
ss -lntpAlso, you can combine this with grep so you can narrow in on a specific port.
ss -lntp | grep ':53'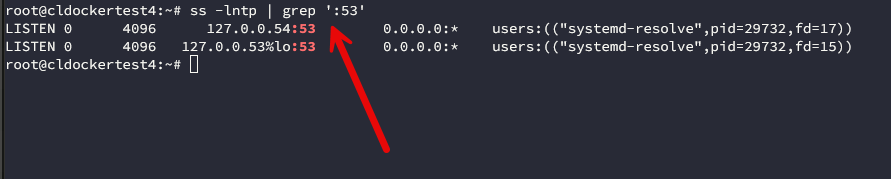
Why I like starting with this when troubleshooting an application, it helps to shortcut that path if the host itself isn’t listening, you know where to start with your troubleshooting.
Or, maybe you find that the host is listening, but only on the loopback address. This is generall just a quick change on the Docker Compose side to get this resolved:
127.0.0.1:8080You can also look at the ss command to look at connections that have been established on your Linux box:
ss -tnp
With this one, you can see which processes have active TCP connections and where these are actually going. All in all, the ss command is definitely one of the first home lab commands to become familiar with as it can help to shortcut tons of troubleshooting quickly if the problem is on the host side.
2. lsof
You have probably ran into an issue or error message that looks very vague and maybe similar to this:
target is busyWhat does “is busy” mean? You may know that you want to unmount something. Linux knows that you want to unmount it. But there might be a process somewhere on the box that thinks otherwise. If you see a message like this, this is a situation where a command called lsof comes into play.
The name stands for literally “list open files”. But the description of the command doesn’t do it justice in what it can show you because it can actually do more than that.
For example, if I want to figure out what is using a mounted filesystem, I can run:
lsof +D /mnt/storageThis will give you the processes with files that are open from that directory. You can also use lsof for network troubleshooting. What??? Yes. For instance, if you want to know what owns TCP port 443 on a server, you can do the following:
lsof -i :53
So, this way, instead of just knowing that something is listening, you can also look at the process that is associated with the socket.
Here is another simple one to see what has a “hold” on a file:
lsof /path/to/fileI think lsof is especially really useful around storage operations. It seems like that is when it comes in the most handy. Home labs tend to have lots of NFS mounts, SMB, external disks, ZFS datasets, locations for backup, and other types of storage.
Eventually, you are going to run into something that says it is “busy” or “locked” or something along those lines where lsof will be THE tool to use.
3. findmnt
For years, I always typed the command below:
mountor something like this when I wanted to understand my filesystems.
cat /etc/fstabThese commands are definitely good ones to know. But did you know about the findmnt command that is much faster and easier for figuring out how your storage is actually arranged?
If you just run this one without any arguments it is super valuable:
findmnt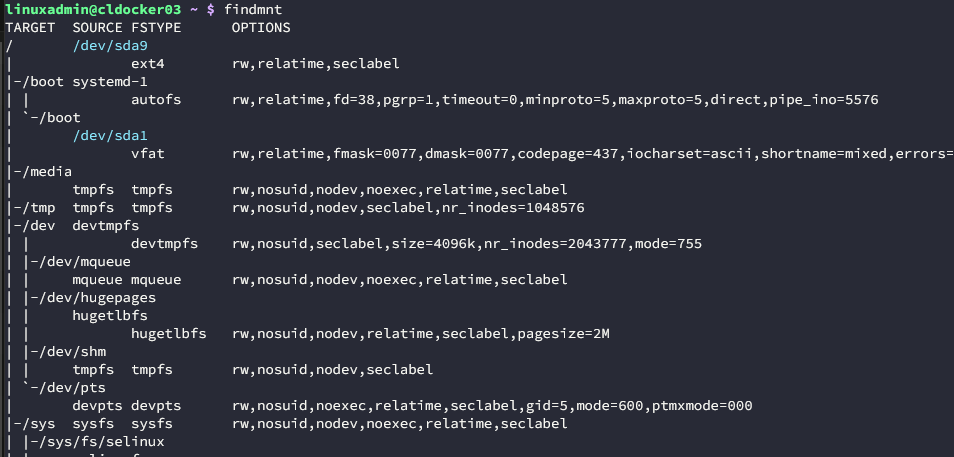
When you run it, you will get a tree view of how mounted filesystems are arranged and their relationships to each other. There is another option that is really powerful and that is the -T option.
findmnt -T /home/linuxadminThis flag allows you to see which filesystem contains this path. This is really useful if you have systems with LOTs of mount points.
You can do something really similar to this with individual files too. The findmnt command will tell you which filesystem backs that path and its source. It will also tell you the filesystem type and mount options.
findmnt -T /home/linuxadmin/somefileYou can also look for certain filesystem types with this findmnt command. Below will give you a quick view of the NFS storage that you have provisioned.
findmnt -t nfs,nfs4You can also inspect and find a particular mount point if you are looking for that by name:
findmnt /mnt/storageI think as you are dealing with more and more mount points, this is an excellent one to remember and take down in your notes to use more often. It is really helpful and can cut your troubleshooting time in half.
4. journalctl
If there is one command to learn and learn well off the top of your head, it is the journalctl command. It is one of those commands that Linux users know exists but it is one that most don’t really think about or learn to use very effectively.
I used to be the same way and spent a lot more time looking through logs in /var/log and then looking for whatever file applies to the error that I am trying to troubleshoot. I might still need to do this and find a direct error log to look for something. But on most modern systemd enabled systems, journalctl is more powerful and should be your first stop off when troubleshooting.
For instance, this is a common one. Let’s say your Docker instance is having problems. If you want to see what is going on with Docker, you can do the following:
journalctl -u docker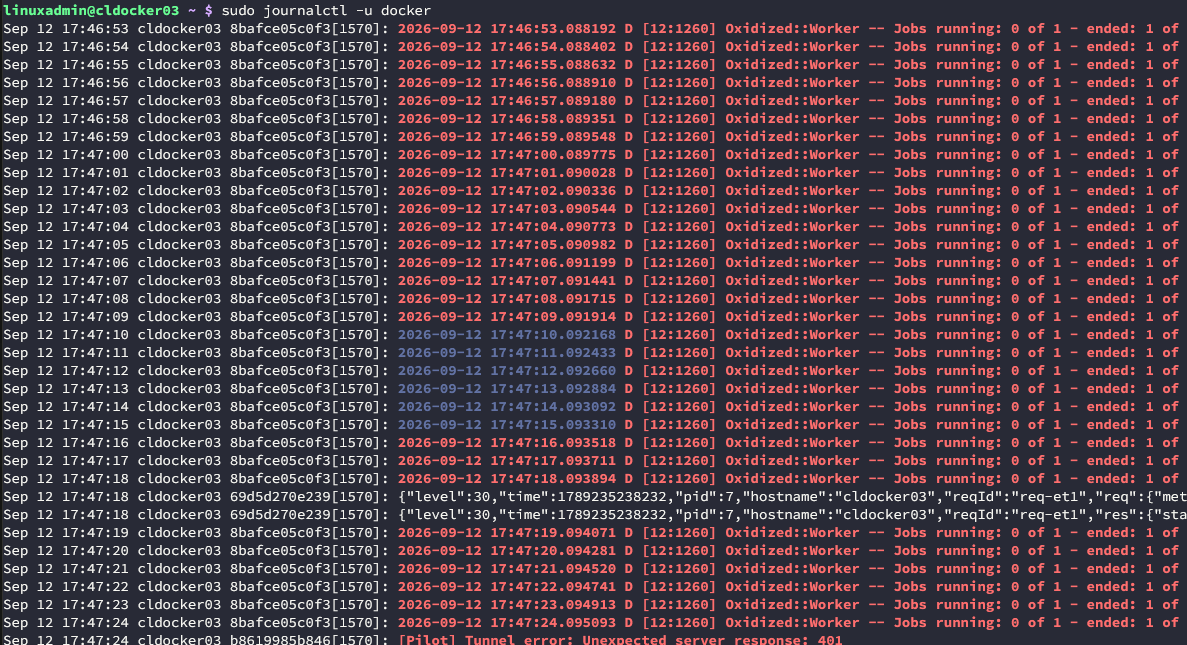
Also, really cool is if you don’t want ALL of the logs which might be a lot, you can ask for a specific time frame or limit:
journalctl -u docker --since "30 minutes ago"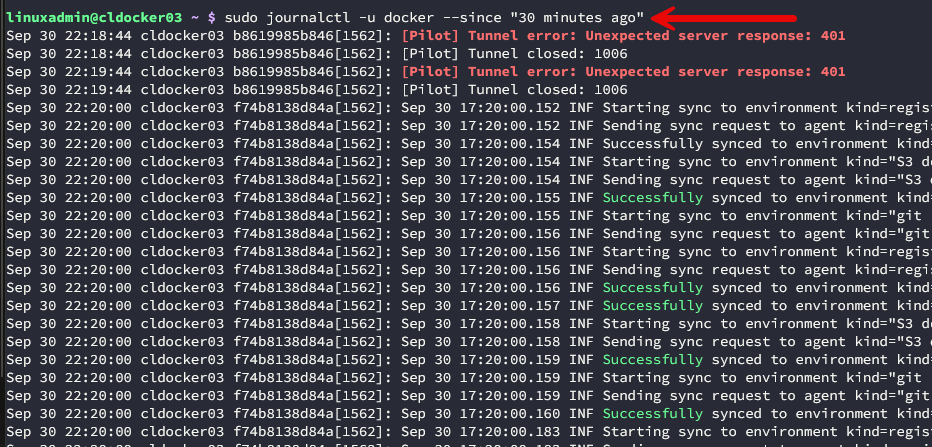
You can also “tail” the logs with the “-f” switch:
journalctl -u docker -fAnother command if you want to see the error-level messages since the current boot process, you can use this command below. This is really a good one if your server has been acting weird since the last reboot. This is a good place most likely to begin:
journalctl -p err -bIf I were stepping through troubleshooting steps on a box, I would probably start with systemctl commands like:
systemctl status <service>Then, if you see the service in a bad state, stopped, errored, you can use the command below to broaden the search out to see what has happened in the last few minutes as systemctl willonly show you just the last few log entries in that view.
journalctl -u <service> --since "10 minutes ago"Then, if you restart the container and believe the issue is fixed, you can follow the logs on the service with the “-f” parameter:
journalctl -u <service> -fSo, to gain super powers by using journalctl, learn not only about the command itself, but how to use it to filter for time ranges, units, boot sessions, and other useful information.
5. watch
The watch command might be one of the simplest one-ups that you can do for your command line kung fu. It turns just about any command into a real time update that almost looks like a dashboard in the terminal.
A really simple example of this is let’s say if you are watching disk space, you can use the watch command to refresh the “df -h” command every 2 seconds. Pretty cool!
watch -n 2 df -h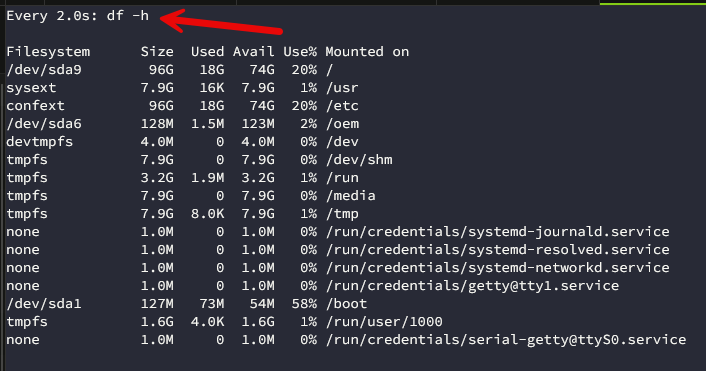
Another one that I think is really handy if you are running a lot of containers is using the watch command to watch your docker containers:
watch -n 1 'docker ps'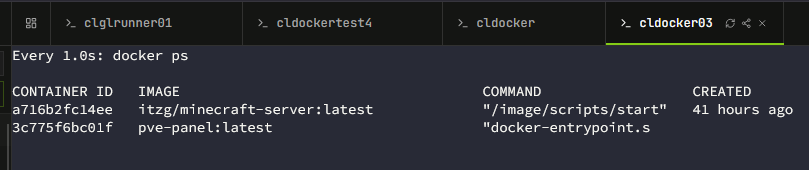
You can watch your network statistics with the following too:
watch -n 1 'ip -s link'If you are waiting on a Kubernetes workload to change you might use the watch command in conjunction with the kubectl command:
watch -n 2 'kubectl get pods -A'Dashboards are great for some things, but maybe a dashboard would be overkill for what you are trying to do. For this, the watch command can give you the same effect with very little effort. One other command parameter to know that is really awesome for the watch command is the -d parameter.
This flag “highlights” the differences” between updates.
watch -d -n 1 'ip -s link'After gaining some experience with Linux troubleshooting, most find that a large part of the troubleshooting process involves running the same command over and over to get the status of a service, health, etc. With the watch command, this is made really easy.
6. ip route
Linux has some really good network troubleshooting tools that are built in. However, one of my favorites is the command that shows you the route table on your Linux server:
ip route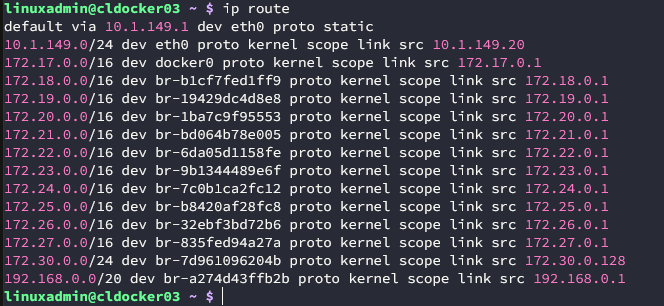
If you just have one IP address on a server and the routing is pretty simple, this may not be something that you think about. However, if you have a Linux server that has multiple interfaces, VLANs, static routes, VPN tunnels, etc, it can start to get convoluted on which network route is being used for what communication.
Also, one thing that is really handy too is that you don’t have to just stare at the routing table and try to decipher which route will win. You can allow the ip route command to do this for you by simply giving it the IP address that you want to see the route needed to reach it.
ip route get 8.8.8.8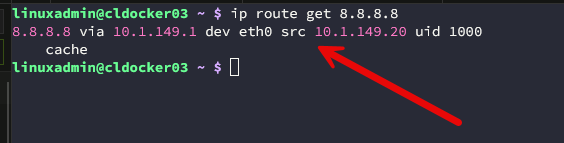
That command might give you output that looks something like this:
8.8.8.8 via 192.168.1.1 dev eth0 src 192.168.1.20From this output, you get to see things very quickly that are important:
- Which interface it will use
- Which gateway address
- Which source IP address
You can use the same thing for internal destinations if you are trying to figure out which network adapter an internal call is using:
ip route get 10.3.37.50I have used this quite a lot when I am troubleshooting VPN tunnels like my Wireguard tunnels. If you are wondering if traffic is getting captured by a VPN tunnel, you don’t have to wonder any more. You can just take a look at the command to see if the tunnel is the interface used for the call.
7. timeout
This is another really simple command that can be simple to use but has a lot of good benefits. The timeout command keeps another command from just hanging and running forever. In Linux, we all know the ping command will just stay there until you kill it.
You can keep that from happening by using the timeout command before the ping command like this below. The command below stops the ping command after 5 seconds.
timeout 5 ping 10.10.10.1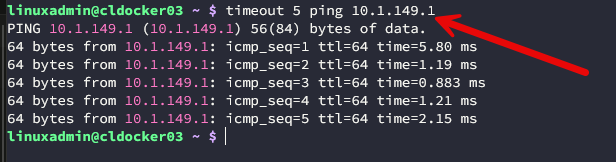
This one is also really useful inside of scripts or other automation when you don’t want a single command to hose up your automation script. You can include the timeout command and have this timeout before it pauses the rest of the script.
Wrapping up
Hopefully this list of Linux commands will help you to up your game as a Linux administrator inside your home lab. Many of these commands ones have heard about or seen referenced and maybe they have copied and pasted them numerous times. But, actually understanding what they do and knowing how you can manually use these commands from the command line when you need to is a game changer. What about you? Which commands for Linux do you feel like you discovered too late?
More in this topic




Google is updating how articles are shown. Don’t miss our leading home lab and tech content, written by humans, by setting Virtualization Howto as a preferred source.
About The Author