When your virtual machines or ESXi hosts hit performance snags, it’s key to know how to identify and fix these issues. A really useful tool you can use is ESXTOP. It’s a command line tool that gives live info about the ESXi host and virtual machines.
Table of contents
What is ESXTOP?
ESXTOP is a core tool that you need to be familiar with as part of your VMware ESXi troubleshooting toolbelt. With it, you can troubleshoot everything from CPU, memory, storage, network, and other very specific issues. If you have a problem in ESXi, likely there is an ESXTOP command line command that can help.
ESXTOP commands for troubleshooting performance issues
The ultimate goal of using ESXTOP is to troubleshoot performance issues. This involves understanding what the performance metrics mean, reading the ESXTOP results, and identifying when something is not right. You can also use the vSphere Management Assistant (vMA) to manage ESXTOP remotely and handle batch mode operations more efficiently.
To access esxtop, you’ll first need to initiate an SSH session to the ESXi host or open the ESXi shell directly if you have console access. This can be done with an SSH tool like PuTTY. The syntax would look like:
ssh root@<YourESXiHostnameOrIPAddress>Once logged in, you can start ESXTOP by simply typing esxtop at the command line:
esxtopFrom here, you can use the following keys to navigate between different views:
c : CPU screen
m : Memory screen
d : Disk Adapter screen
u : Disk Device screen
v : Disk VM screen
n : Network screen
To view power management information, press the “p” key:
pThe “f” key allows you to change the fields that are displayed for each view. For example, to add the NWLD (Number of Worlds) field to the CPU screen:
f cTo monitor a particular VM, use the “V” command:
VTo highlight a specific row (for example, a VM or a disk device), use the “h” command:
hTo run esxtop in batch mode, which is useful for gathering long-term statistics, you can use the “-b” flag. For example, the following command will run esxtop in batch mode for 60 seconds, refreshing once every 5 seconds (for a total of 12 samples), and output the data to a CSV file:
esxtop -b -d 5 -n 12 > esxtop_output.csvRemember, ESXTOP commands are case-sensitive, so be sure to use the correct case.
These are just a few of the commands and options available in ESXTOP. The utility has a very good help screen compared to other command line tools. You can use this any time that you want to access it by pressing “h“.
ESXTOP CPU Metrics
The way a virtual machine uses CPU resources is an important part of performance you want to look at. ESXTOP gives you a detailed view of the CPU and processes. This includes the percentage of time each virtual machine runs on the CPU, how often the CPU scheduler is used, and when there is competition for CPU resources. If you notice a high value in CPU competition, it might mean there’s a performance issue that needs to be fixed.
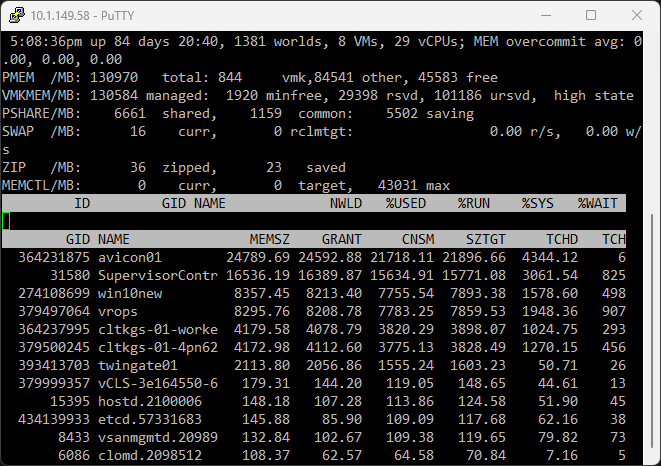
Let’s look at the “c” key, for instance. This command spends its time bringing up the CPU view. This display offers invaluable insight into CPU utilization across your ESXi host, CPU resources, and how the CPU scheduler is working. Keep an eye on CPU contention; a high value can indicate potential performance issues.

ESXTOP Memory Metrics
Getting ESXi host memory usage goes beyond merely knowing the quantity of memory in use. It’s crucial to comprehend the functionality of the memory and the processes utilizing it. ESXTOP equips you with the knowledge of the VM group, VM worlds, and other worlds (processes) operating on the ESXi system. This helps in gaining a nuanced understanding of the system’s undertakings.
The “m” key reveals the memory view. Here, you get detailed information about physical memory usage, including guest physical memory and memory size of each VM. You’ll see if memory is being swapped or compressed, which can impact performance.
Understanding Guest Physical Memory
ESXTOP offers a rich perspective into how guest physical memory is used. For instance, you might find a guest operating system actively compressing memory, which can slow down VM performance. The memory view will show if the VM is accessing compressed memory or swapped pages, which can also be signs of performance issues.
Understanding memory usage isn’t just about knowing how much memory is being used. You also need to understand how the memory is used and what processes are using it. ESXTOP provides insight into the VM group, VM worlds, and other worlds (processes) running on the ESXi system, giving you a deeper understanding of the system’s activities.
ESXTOP Disk Metrics
Disk performance is an area often associated with storage performance issues. ESXTOP provides insights into disk device and disk adapter activities. By analyzing these, you can identify if a particular VM is causing high disk IO, the average response time of a storage device, or if there are too many SCSI reservations.
Analyzing Disk Performance with ESXTOP
ESXTOP’s disk view (accessible by pressing “d” for disk adapter view or “u” for disk device view) offers crucial insights into storage performance issues. You can see the average response time of a storage device, the amount of time a command spends in the VMkernel, and any SCSI commands or other SCSI commands that are taking an unusually long time.
This view can also show if a particular VM or disk device is causing performance issues. For instance, you might see an unusually high value of vendor string requests, or perhaps unit attention commands that should not be present. Both can indicate performance issues that require attention.

ESXTOP Network Metrics
Finally, network performance is an important area to monitor. ESXTOP allows you to display network statistics, helping you understand if the VM is generating high network traffic or performance issues at the network layer.
Network Statistics and ESXTOP
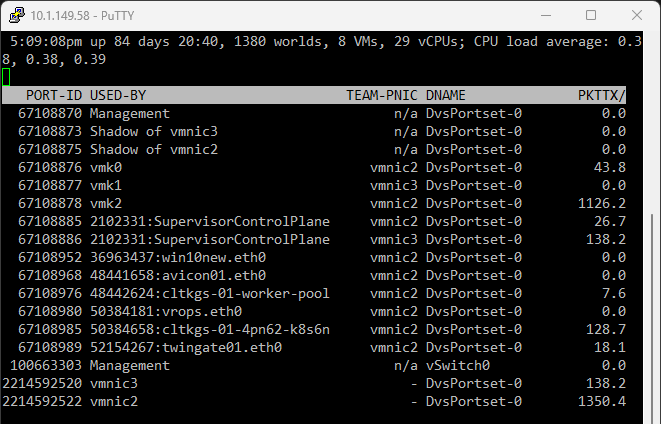
Press “n” to access ESXTOP’s network view, which shows the network statistics for your VMs and ESXi hosts. This view helps to identify if the guest OS is generating excessive network traffic or if there are any network-related performance issues.
Saving ESXTOP Results for Analysis
A single ESXTOP session offers a real-time snapshot of performance, but sometimes, you need a broader perspective. This is where ESXTOP’s batch mode comes in handy. By running ESXTOP in batch mode, you can capture esxtop results over a specific duration, saving the data to a CSV file.
To run ESXTOP in batch mode, use the “-b” flag, like this:
esxtop -b -d 5 -n 12 > esxtop_output.csvIn the above command, ESXTOP will run in batch mode, capturing data every 5 seconds for a total of 12 iterations and then writing the data to a file called “esxtop_output.csv”.
This file can be analyzed using other tools to identify performance trends, find bottlenecks, and troubleshoot performance issues.
ESXTOP commands for troubleshooting performance issues
The ultimate goal of using ESXTOP is to troubleshoot performance issues effectively. This involves understanding what the performance metrics mean, reading the ESXTOP results, and identifying when something is not right. You can also use the vSphere Management Assistant (vMA) to manage ESXTOP remotely and handle batch mode operations more efficiently.
To access esxtop, you’ll first need to initiate an SSH session to the ESXi host or open the ESXi shell directly if you have console access. This can be done with an SSH tool like PuTTY. The syntax would look like:
ssh root@<YourESXiHostnameOrIPAddress>Once logged in, you can start ESXTOP by simply typing esxtop at the command line:
esxtopFrom here, you can use the following keys to navigate between different views:
c : CPU screen
m : Memory screen
d : Disk Adapter screen
u : Disk Device screen
v : Disk VM screen
n : Network screen
To view power management information, press the “p” key:
pThe “f” key allows you to change the fields that are displayed for each view. For example, to add the NWLD (Number of Worlds) field to the CPU screen:
f cTo monitor a particular VM, use the “V” command:
VAlso, to highlight a specific row (for example, a VM or a disk device), use the “h” command:
hTo run esxtop in batch mode, which is useful for gathering long-term statistics, you can use the “-b” flag. For example, the following command will run esxtop in batch mode for 60 seconds, refreshing once every 5 seconds (for a total of 12 samples), and output the data to a CSV file:
esxtop -b -d 5 -n 12 > esxtop_output.csvRemember, ESXTOP commands are case-sensitive, so be sure to use the correct case.
These are just a few of the commands and options available in ESXTOP. The utility has a comprehensive help screen that you can access at any time by pressing “h”. It’s always a good idea to refer to the official VMware documentation for the most detailed and up-to-date information about using ESXTOP.
using it. ESXTOP provides insight into the VM group, VM worlds, and other worlds (processes) running on the ESXi system, giving you a deeper understanding of the system’s activities.
necks, and troubleshoot performance issues.
Top VMware ESXi commands you need to know
Wrapping up
Learning ESXTOP commands, views, and metrics can give you a huge advantage when working with your VMware vSphere environment and trying to troubleshoot performance and other issues. This tool can be used for both refining performance and identifying problems. The more you use ESXTOP, the more comfortable you’ll become with its commands and views. It will allow you to improve performance and resolve issues more quickly.
Google is updating how articles are shown. Don’t miss our leading home lab and tech content, written by humans, by setting Virtualization Howto as a preferred source.
About The Author