



I recently finished building a new TrueNAS configuration for use with my Proxmox VE server for additional iSCSI storage in the home lab. Take a look at my build post that I just posted detailing the configuration on my TerraMaster F8 SSD Plus: I Built My Ultimate TrueNAS Storage Setup for Proxmox. I wanted to experiment with getting my TrueNAS configuration monitored with Grafana to have visibility on my VDEVs and the hardware running my NAS. Let me take you through my configuration to monitor TrueNAS with Grafana
Overview of my configuration
In the post I linked to in the beginning, you can see all the details of the build. But just a brief overview of that I reloaded my Terramaster F8 SSD Plus with TrueNAS and running (6) Samsung 980 Pro 2TB NVMe drives for data. I did something a little bit different with the configuration. I decided to do (3) two-drive mirrors for VDEVs. The cool thing is Proxmox stores the data across all the VDEVs in the pool. So, it shows up as a single storage location. T/his config performs better than just putting them all in a RAIDZ config. I lose capacity, but I was after the best performance I could get.
I took benchmarks of the performance inside a test VM that was running in Proxmox and backed by the TrueNAS storage provisioned with the new TrueNAS storage plugin. The benchmarks showed the storage to be super responsive and performant. But I am all about the “real” performance and behavior I see when I have lots of workloads running.
I knew that TrueNAS has native reporting with the Graphite exporter. So I wanted to get this exporting into Graphite and have Grafana displaying the relevant metrics from the environment.
Why I used Grafana and Graphite
TrueNAS has a reporting configuration that integrates natively with Graphite. So this was an obvious choice for ease of configuration. It sends the metrics to Graphite’s Carbon receiver. Graphite then stores the metrics. This acts as the “data source” that Grafana needs as a place to query data to display and graph.
I think eventually I will introduce Prometheus for TrueNAS. But I will need to have a Graphite to Prometheus conversion in the middle. Prometheus is the more modern solution for aggregating data. But, for this first pass I wanted to get the native TrueNAS export working and see what data it provided. So, it is a good setup to monitor TrueNAS with Grafana.
Where I deployed Grafana and Graphite
I already had a Grafana instance up and running in my Talos Linux Kubernetes cluster that helps me monitor many other things in the home lab. However, I didn’t have Graphite running. So I spun this up as well inside my Kubernetes cluster. This turned out to work really well in my environment. Kubernetes is really built for running things like Grafana, Prometheus, Graphite and other monitoring suites.
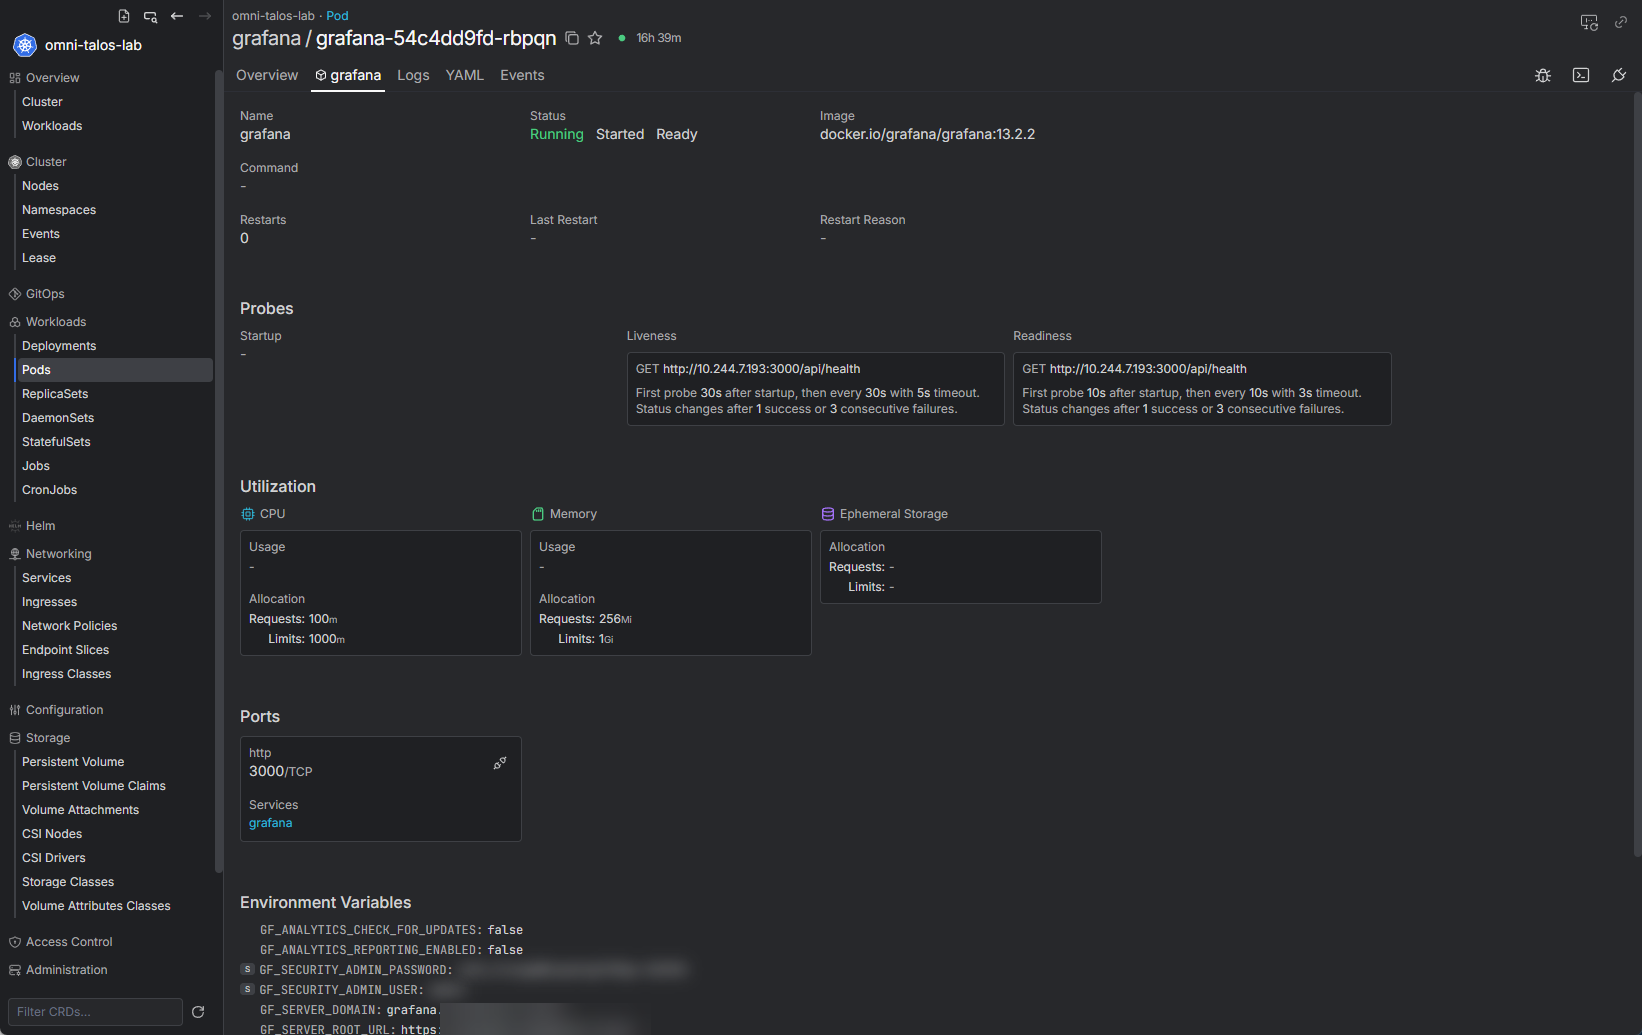
Overview of how I stood up the monitoring stack in Kubernetes
So I have Grafana deployed in my Talos Linux Kubernetes cluster. I decided this is where I would also run Graphite. This also makes connections between the two much easier since it allows Grafana to connect to the data source inside the Kubernetes network.
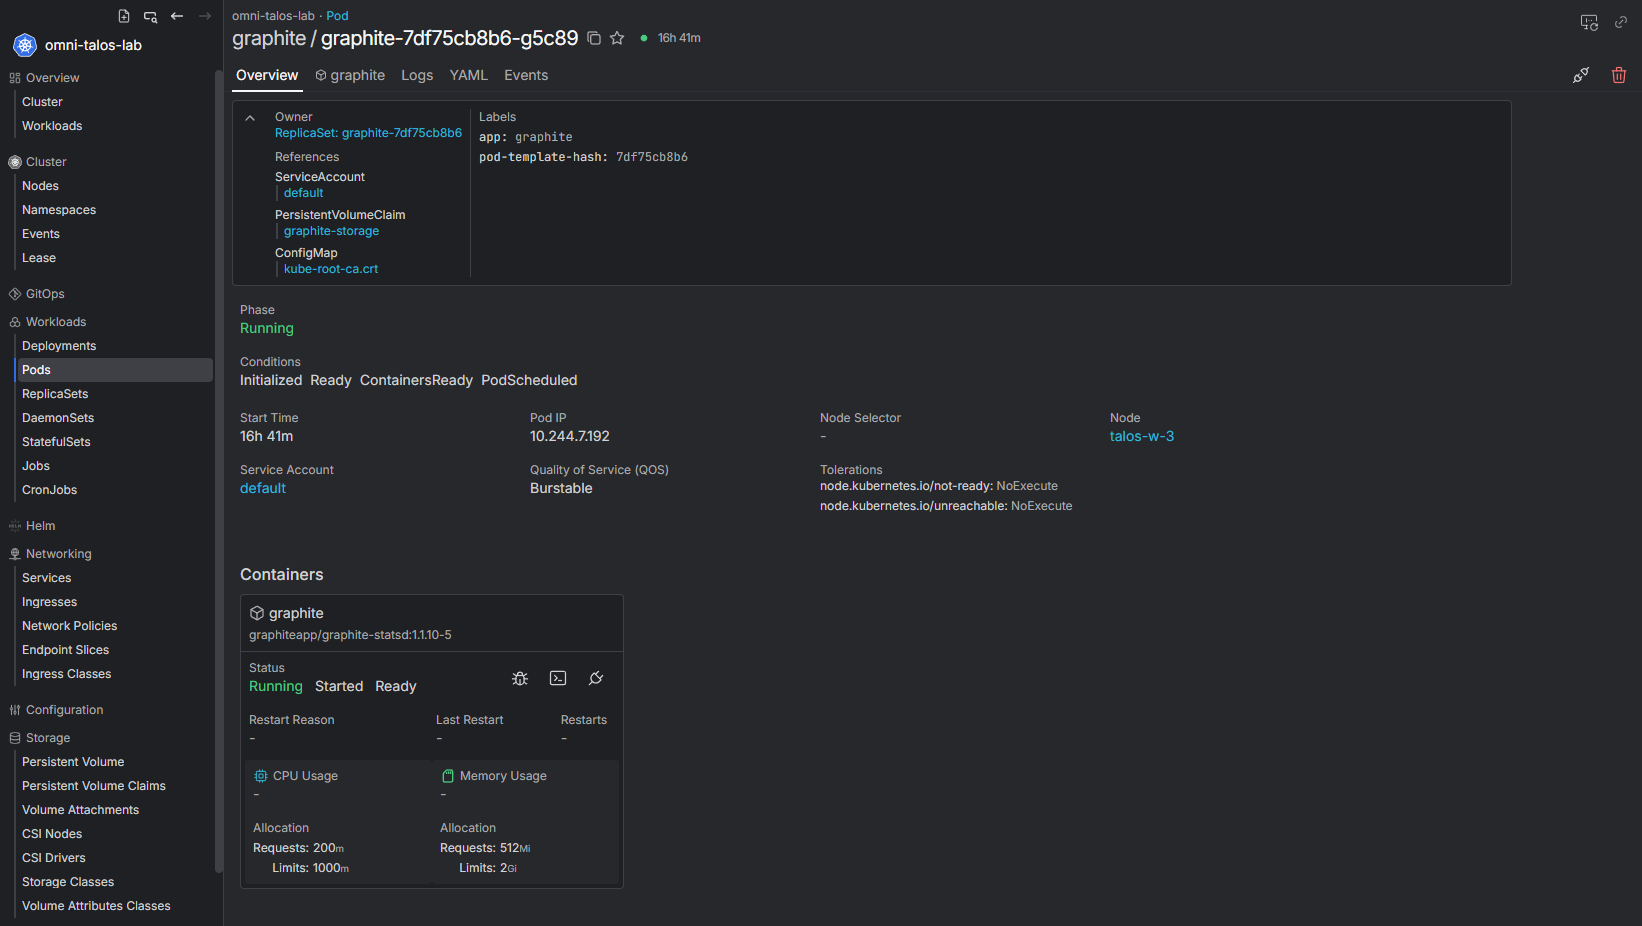
I have both of these solutions with persistent volumes on my Ceph RDB storage that is part of my Ceph storage solution running in my Proxmox cluster. I assigned the following:
- Grafana has a 10 GB volume mounted at /var/lib grafana for its database, dashboards, and plugins.
- I gave Graphite a 20 GB volume mounted at /opt/graphite/storage where it stores its Whisper metric files
- These are the starting sizes for my lab and not necessarily universal recommendations for every environment.
Then, I have both web interfaces exposed with Traefik in my Kubernetes cluster. Then I have services that ingress into the pods with my proper domain names and SSL certificate termination. The traffic follows a couple of paths. TrueNAS sends data to my internal IP address 10.1.149.240:2003. The port is Graphite’s Carbon receiver. Grafana then queries the Graphite web service over the Kubenetes network.
When configuring the connection from Grafana to Graphite, I use the internal Kuernetes DNS name for Graphite:
http://graphite.graphite.svc.cluster.local:80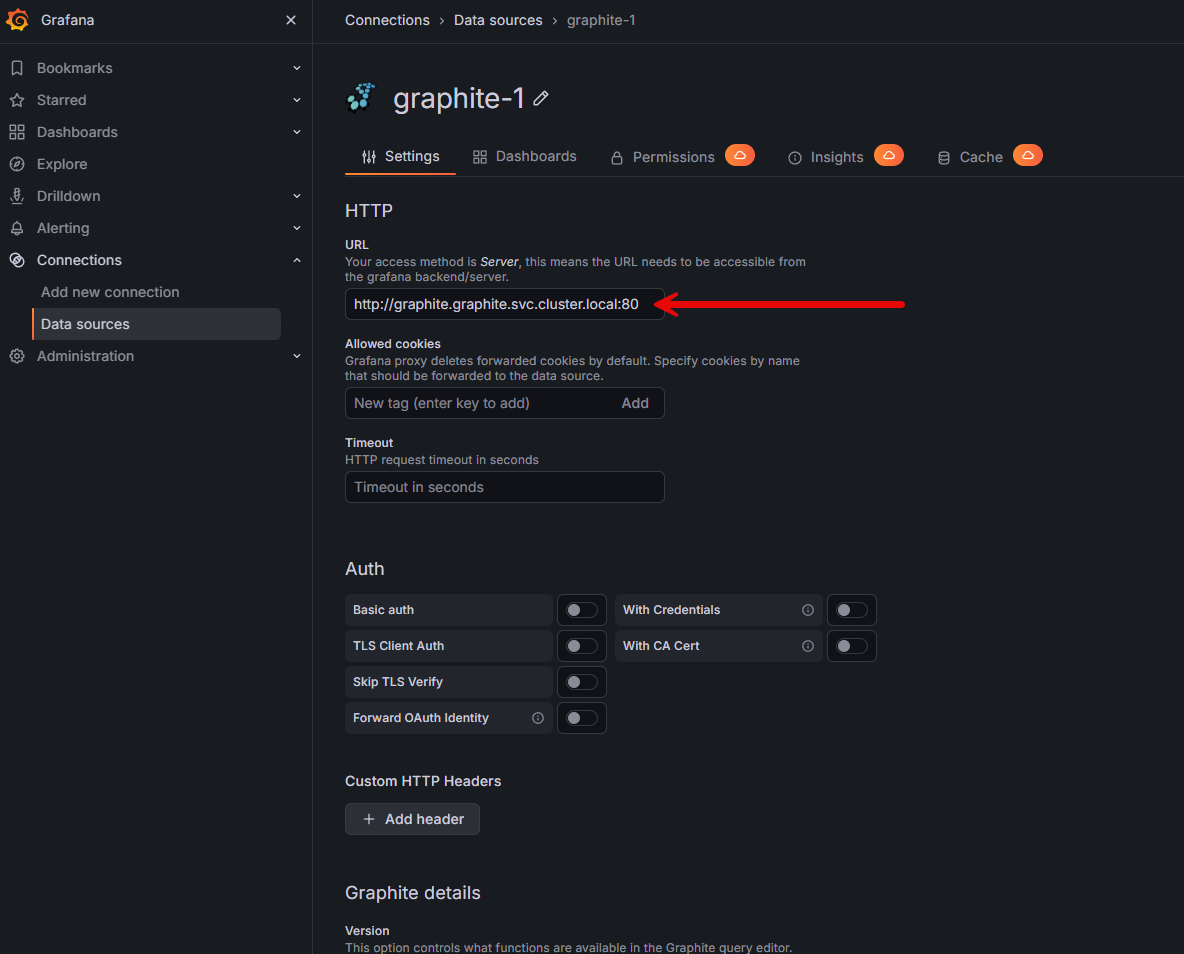
This is the most efficient path since it keeps Grafana from having to go out through the public Graphite hostname and back through Traefik when both applications already had cluster services. Then I just ran the Save and Test which was successful as you can see below.
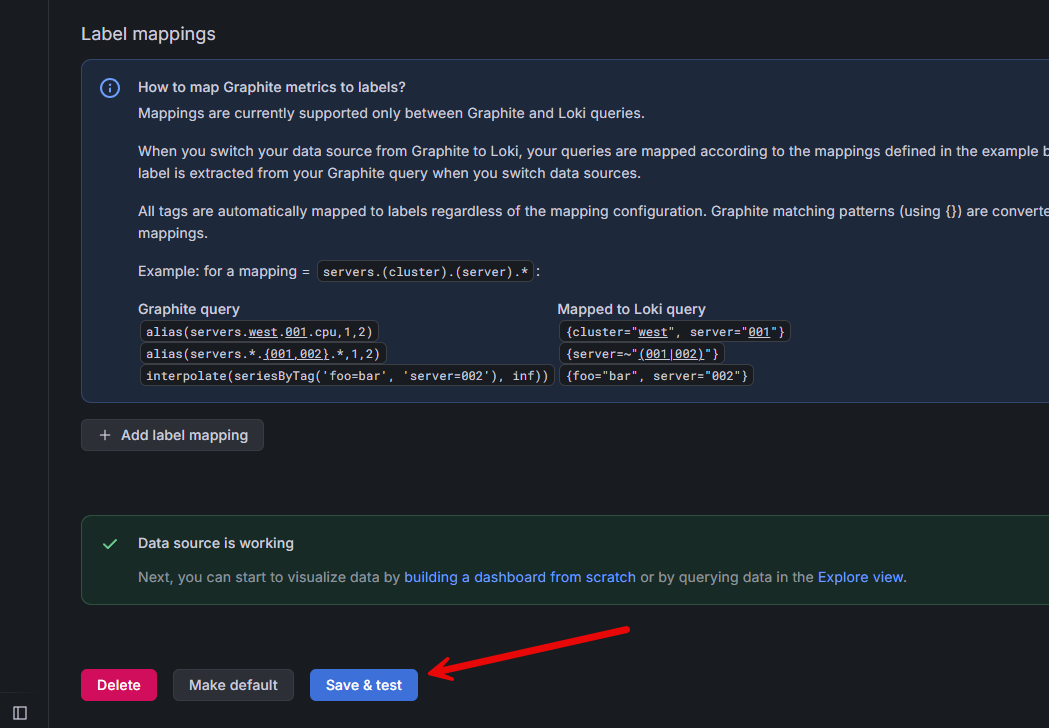
Configuring the exporter in TrueNAS
On the TrueNAS side, it was easy to configure the integration between it and Graphite. The configuration dialog box was pretty straightforward. You just navigate in the TrueNAS interface to Reporting > Exporters and then I added a new exporter.
Below are the settings that I entered in for my environment that will give you an idea of what needs to be configured here:
| Setting | Value |
|---|---|
| Type | Graphite |
| Enabled | Yes |
| Destination IP | 10.1.149.240 |
| Destination port | 2003 |
| Prefix | truenas |
| Namespace | truenas |
| Update every | 10 seconds |
| Matching charts | * |
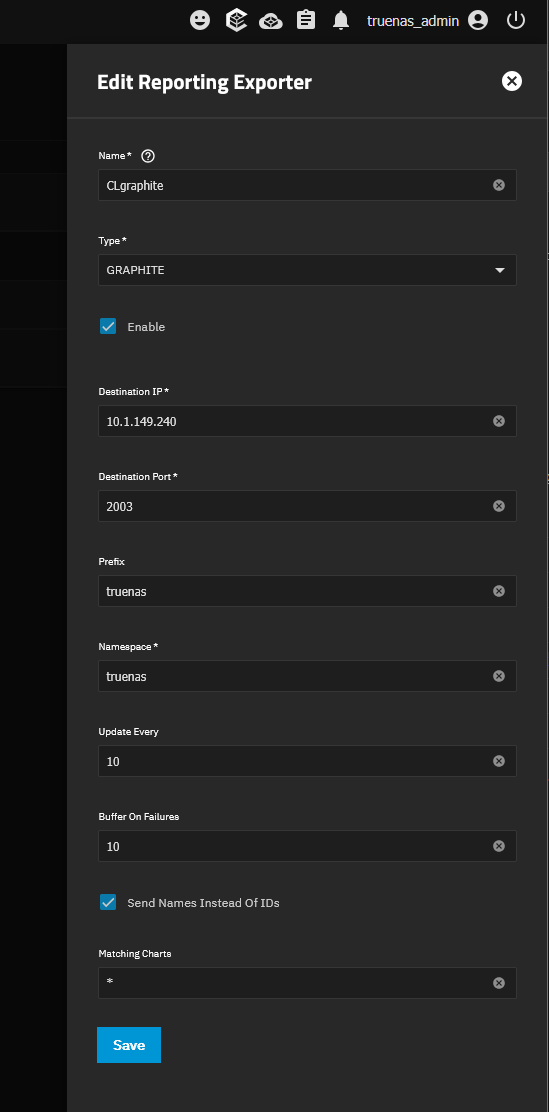
With this configuration, using truenas for the prefix and namespace gave me metric paths that had the naming format of truenas.truenas. That was ok in my configuration, but I had to tweak an existing Grafana dashboard from the Grafana dashboards marketplace as I will show below. I had to match the Graphite paths and capitalization that the queries used for the dashboard.
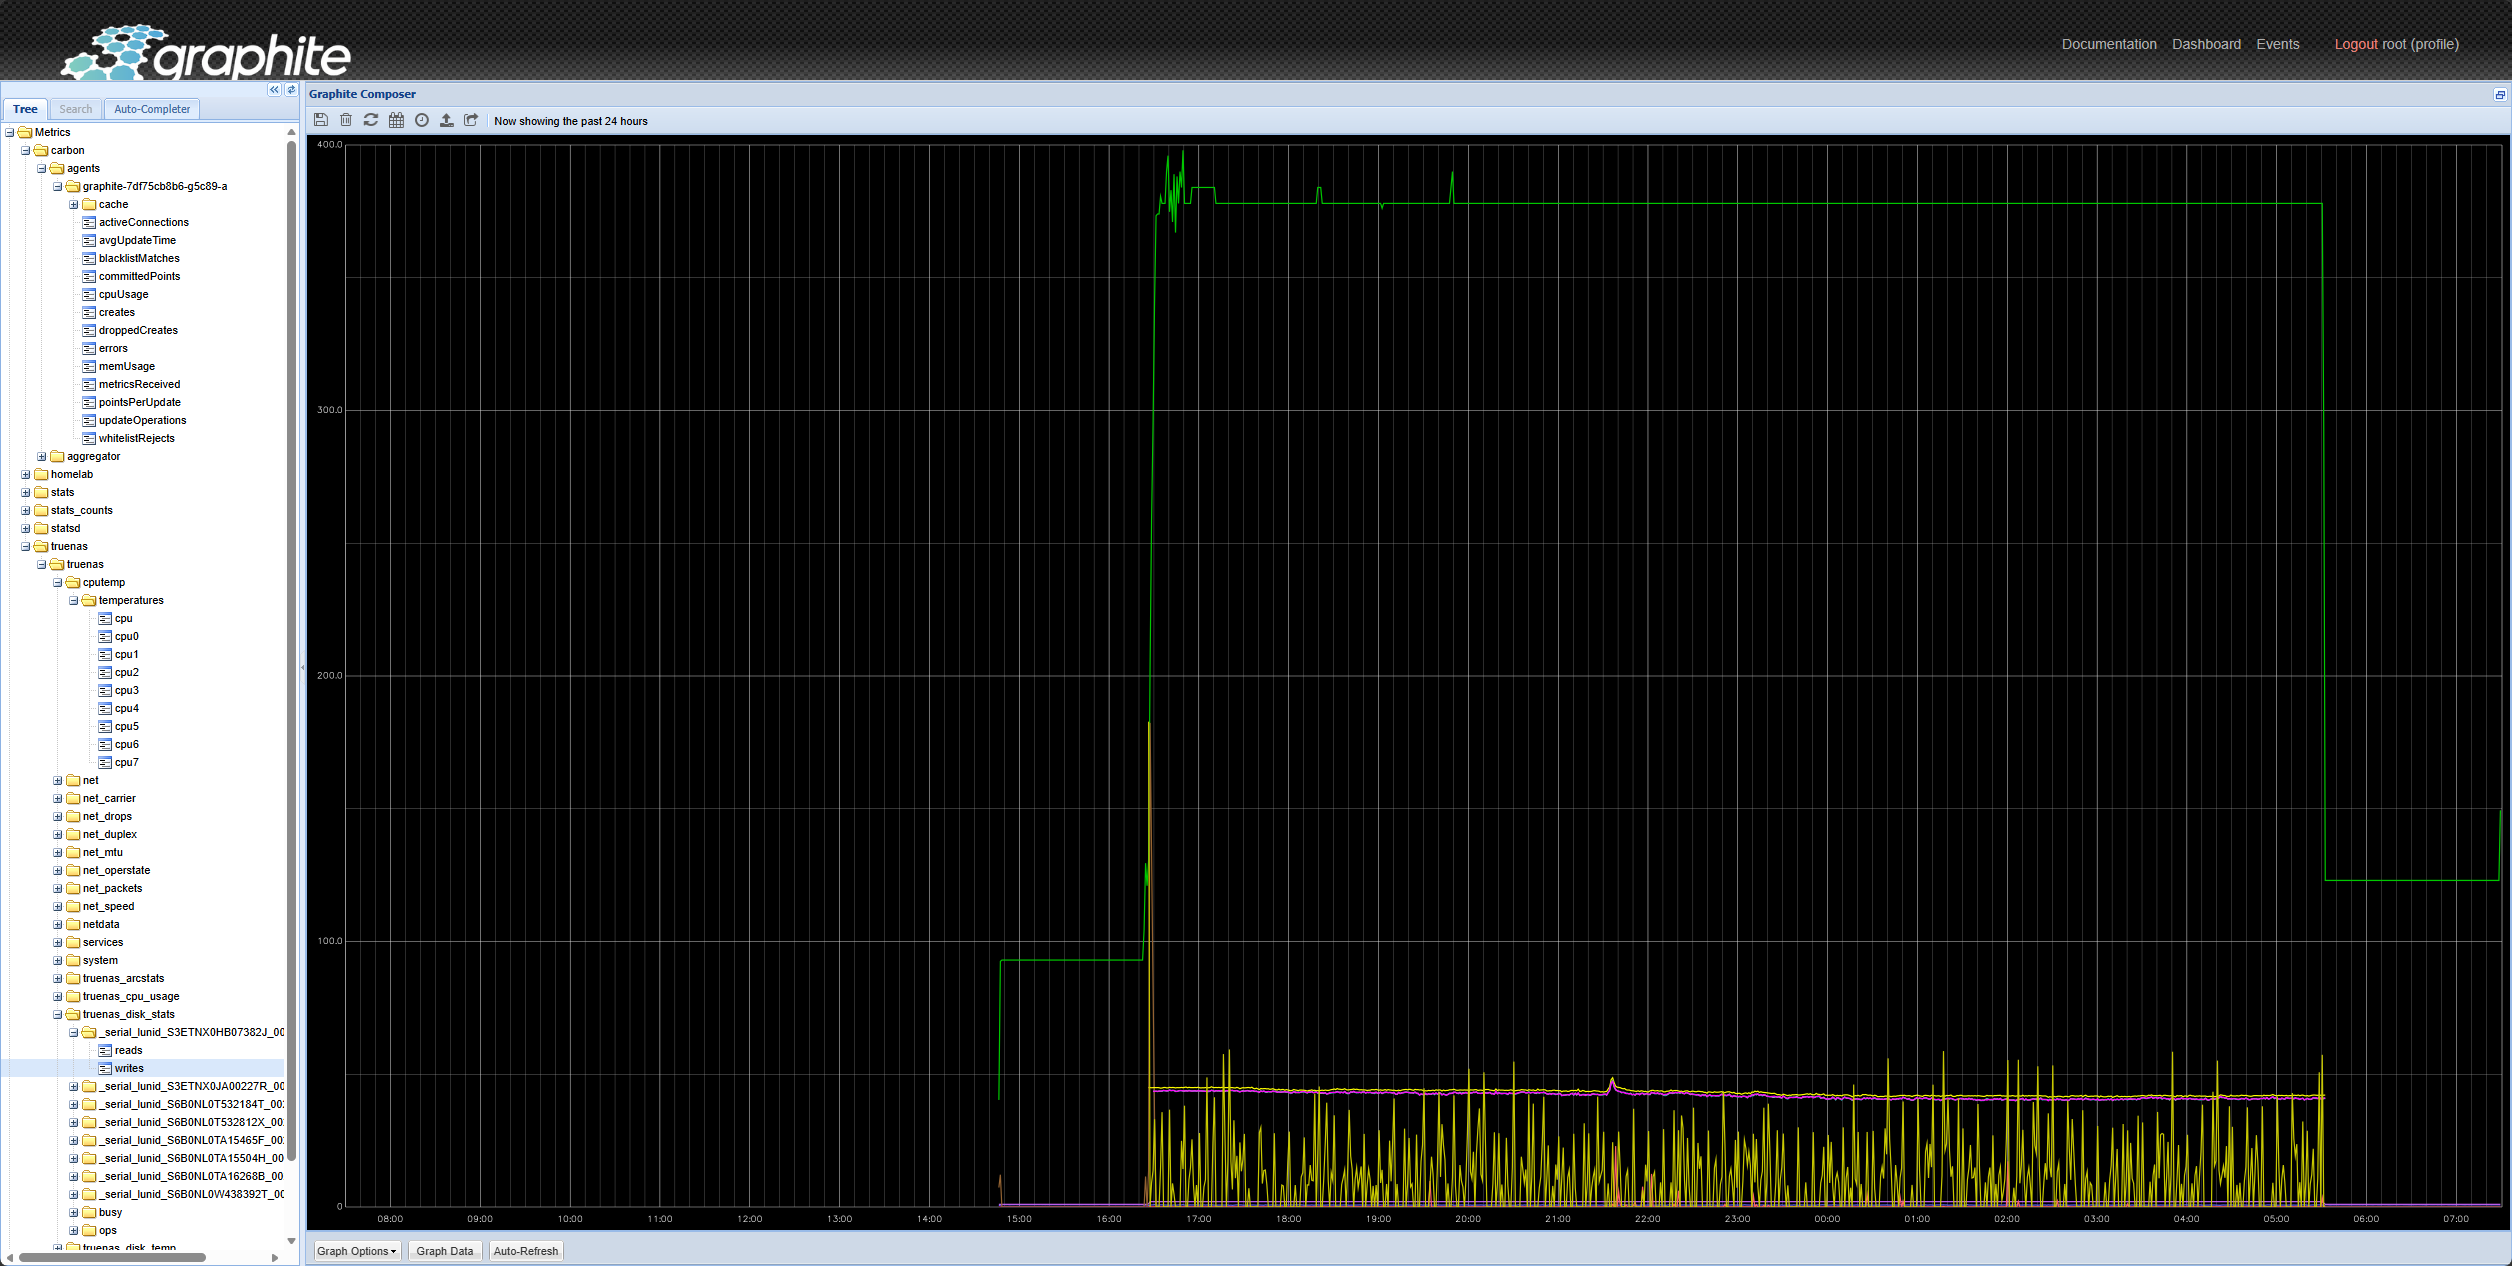
After I saved my exporter configuration, I gave it a little bit of time and looked in the metric tree. It took it a bit, but eventually TrueNAS started sending and the truenas tree showed up.
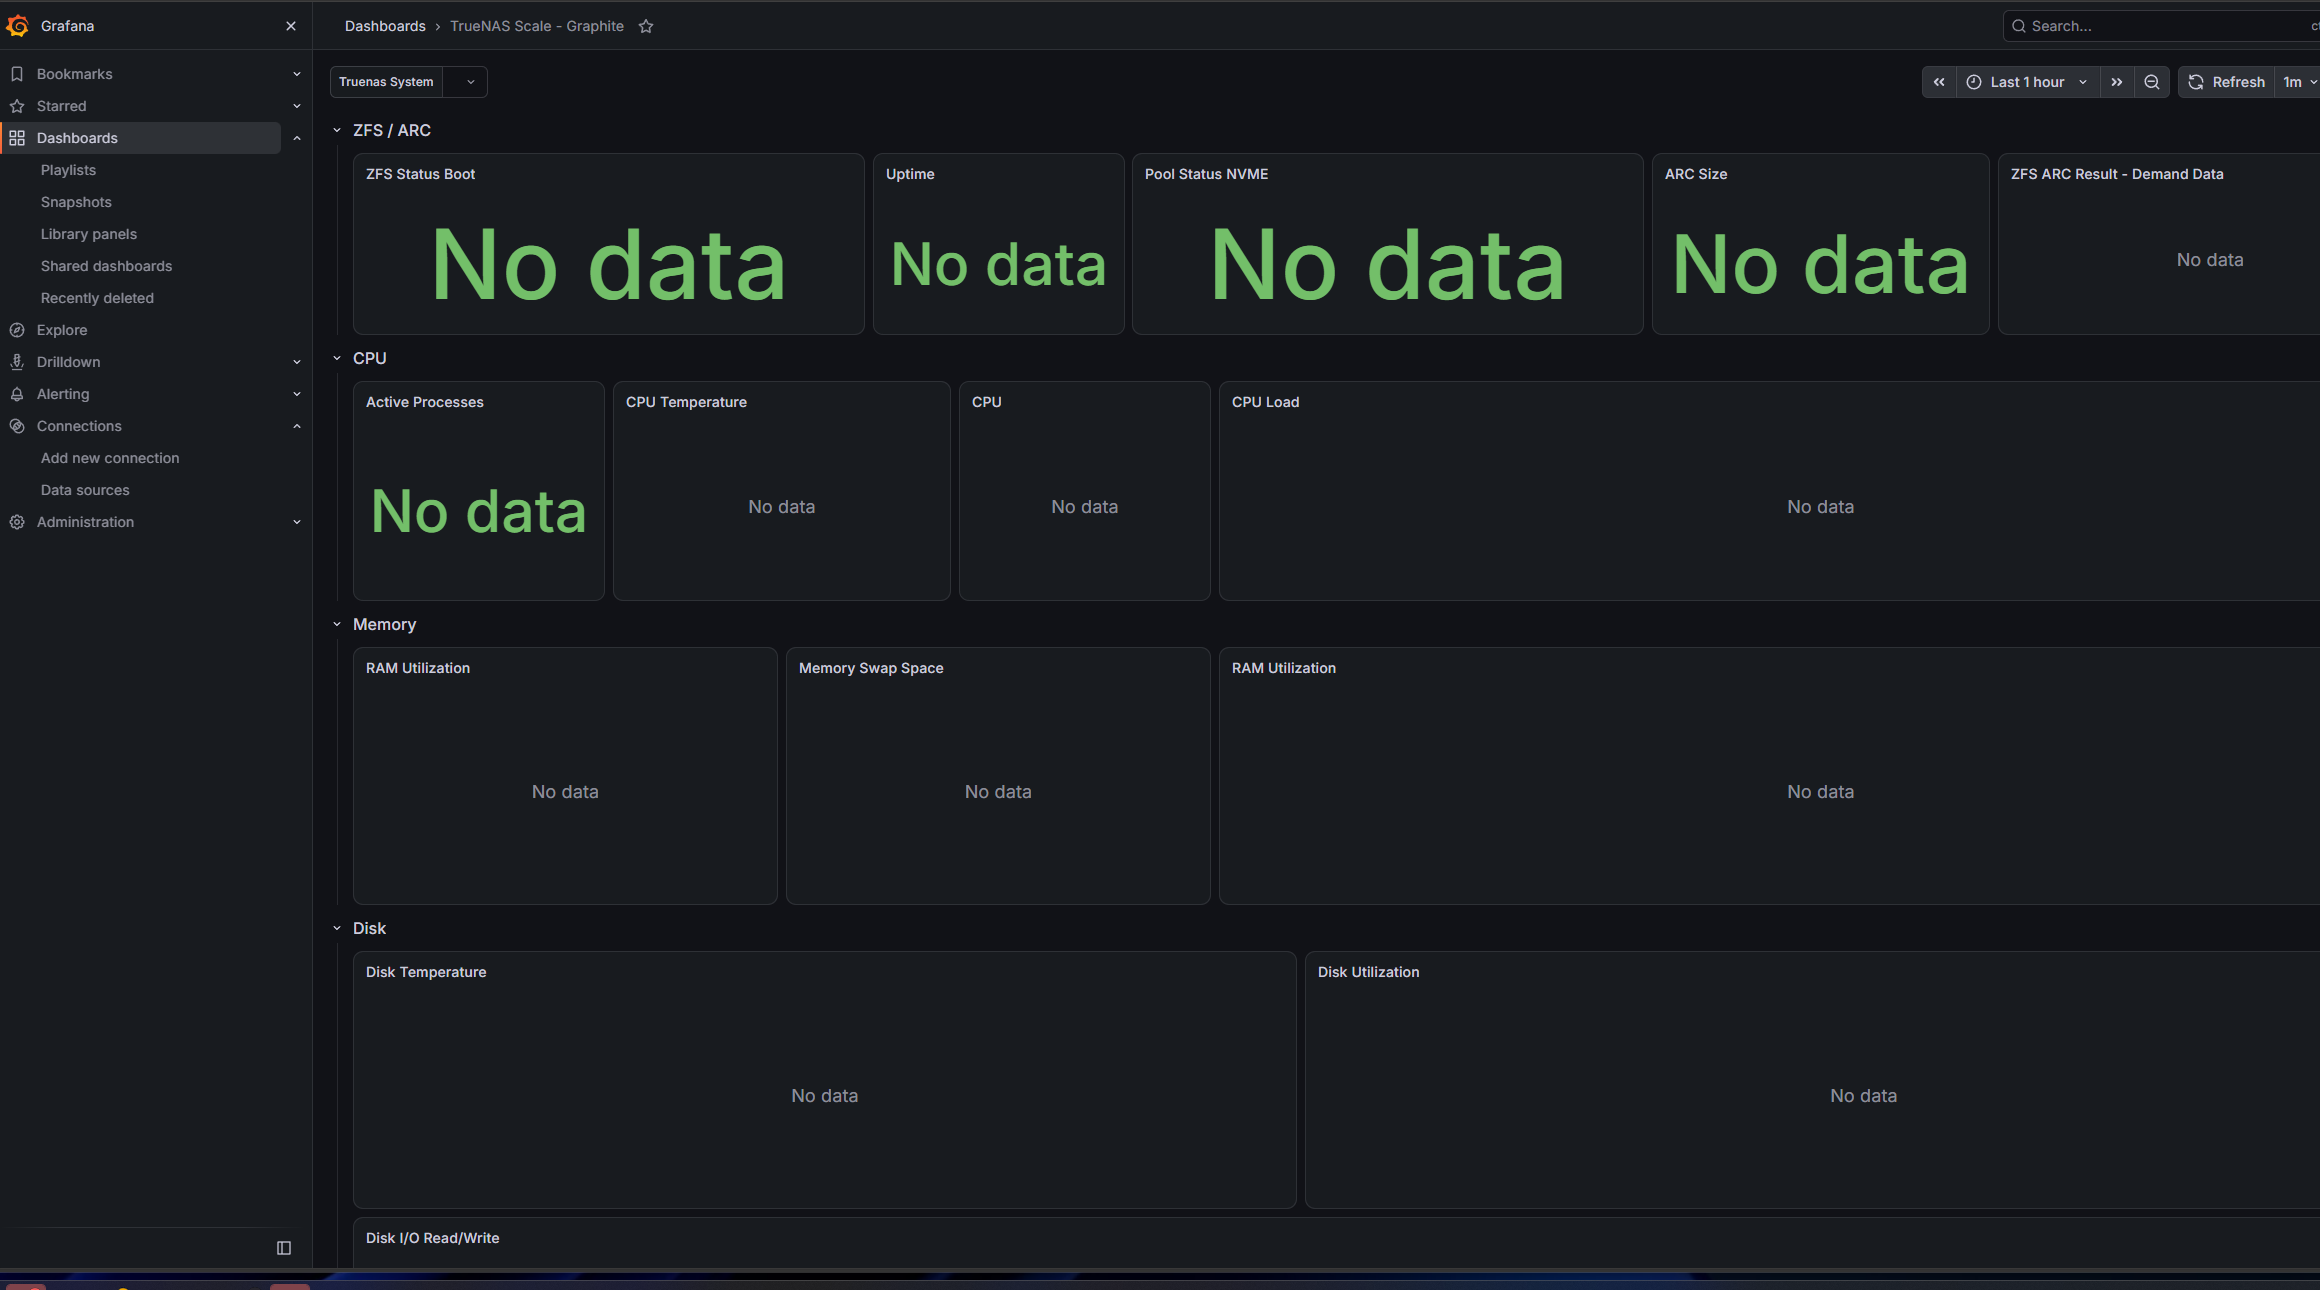
No data appeared in the imported dashboard from Grafana
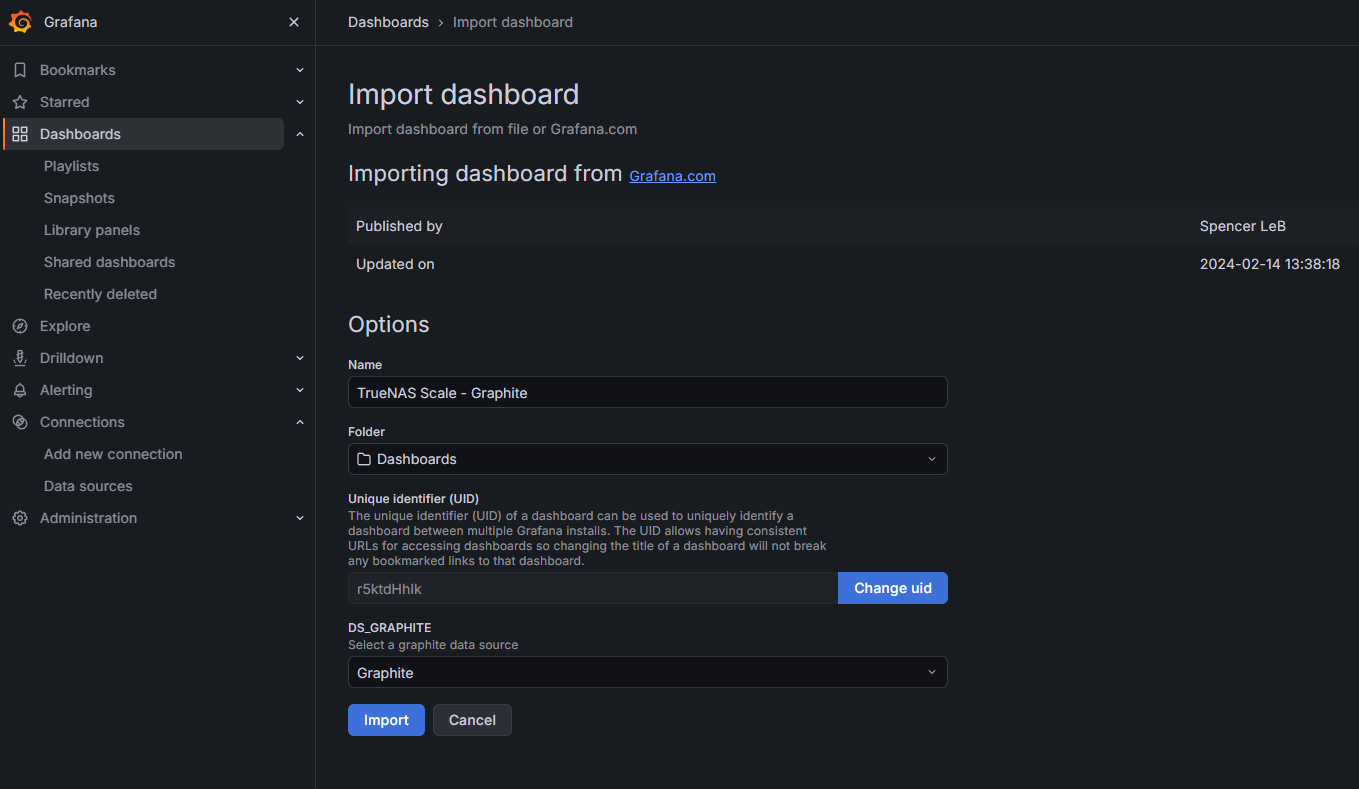
Instead of reinventing the wheel here, I decided to look at the dashboards available from Grafana. I settled on Grafana dashboard 20439 since it was built for Graphite and Grafana. The dashboard loaded up just fine.
But, I noticed an issue. The panels were empty. I could see my metrics in Graphite, so I knew the data was making it there. So I figured it must be something with the paths that it expected.
Sure enough, in checking the imported dashboard, it expected paths like:
- TrueNAS.*.zfs.arc_size.arcsz
- TrueNAS.*.cpu.cpu0.idle
My exporter was sending paths under truenas.truenas, including truenas_arcstats and truenas_cpu_usage. So, ultimately, there were two differences. First, the dashboard expected TrueNAS with capital letters (remember Linux is case sensitive) and my prefix was lowercase. Second, the dashboard’s chart names were meant for a different TrueNAS metric layout. My current export used names like truenas_pool, truenas_meminfo, and truenas_disk_stats. The older dashboard expected different ones here.
So, what I did was remapped the dashboard queries to the metrics that were being sent.
- Pool panels use: truenas_pool.usage
- CPU panels use truenas_cpu_usage
- disk activity uses truenas_disk_stats
- ARC panels use truenas_arcstats
I also mapped the available disk temperature, system load, uptime, and network series. I would say the quickest way to troubleshoot a dashboard that says No data is to go back to Explore in Graphite. If the graphs are populating in graphite then there is probably just a mismatch somewhere in these areas I have described here.
The 12.7 PB ARC reading was a unit problem
One other odd thing I found was that after I remapped the dashboard queries, panels were displaying odd numbers. The one that especially stood out was my ZFS ARC size. It was displaying as 12.7 PB. Which I wish I had that amount!!! But, unfortunately, it should have been around 12 GB. My NAS only physically has 16 GB of RAM.
I found the panel was formatting that value as though it represented megabytes instead of bytes. So definitely made it exaggerate the total. So I set the Grafana unit to bytes and this got the result back to roughly 12 GB.
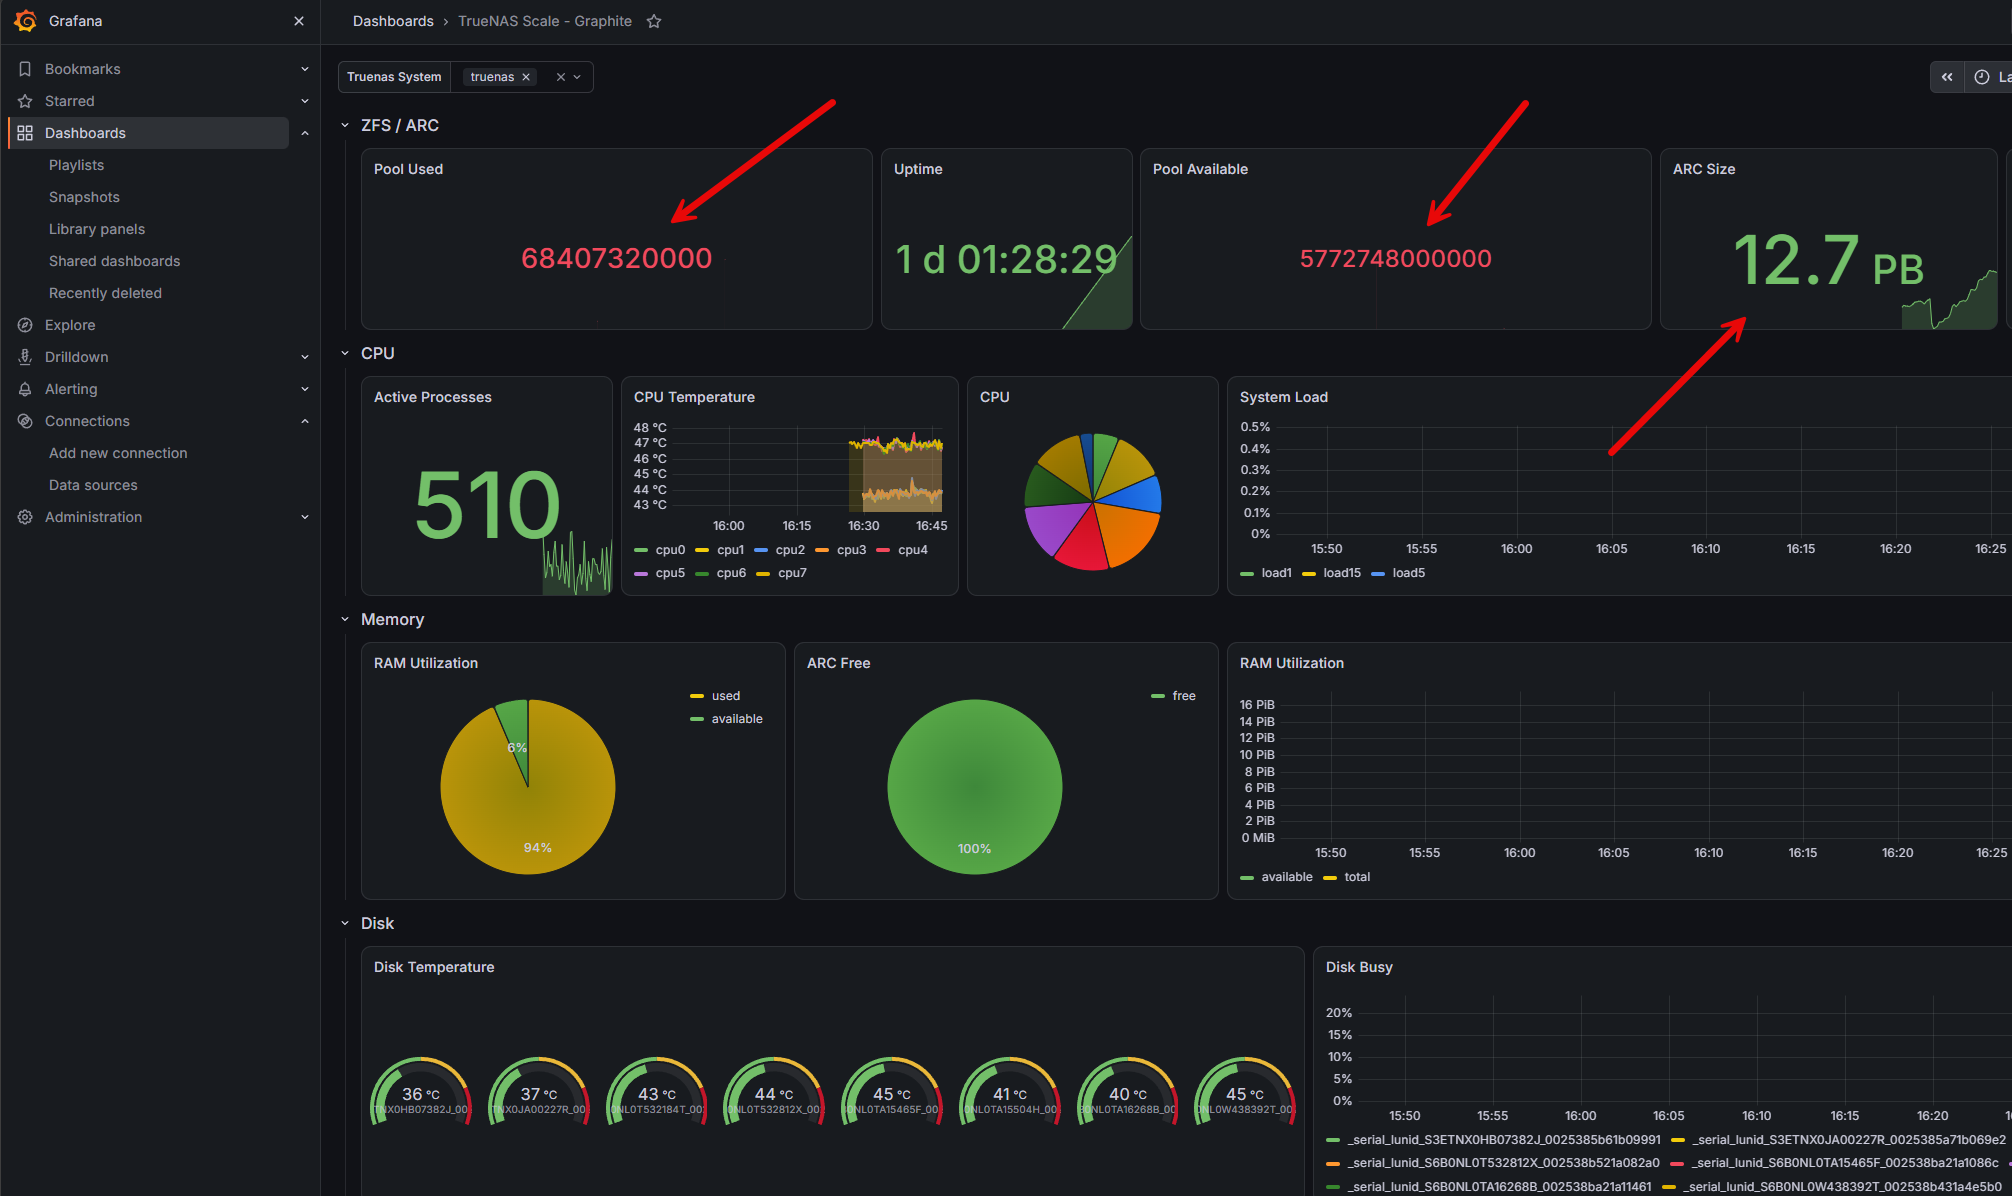
I would recommend before relying on the information that you are seeing in Grafana to actually look at some of the information inside of TrueNAS to make sure the formatting in the dashboard is correct. This includes panels like Pool capacity, installed memory, disk temperature, and network throughput, just to name a few that I would spot check.
So, finally, I got the board lined out and it looked like below which is nice.
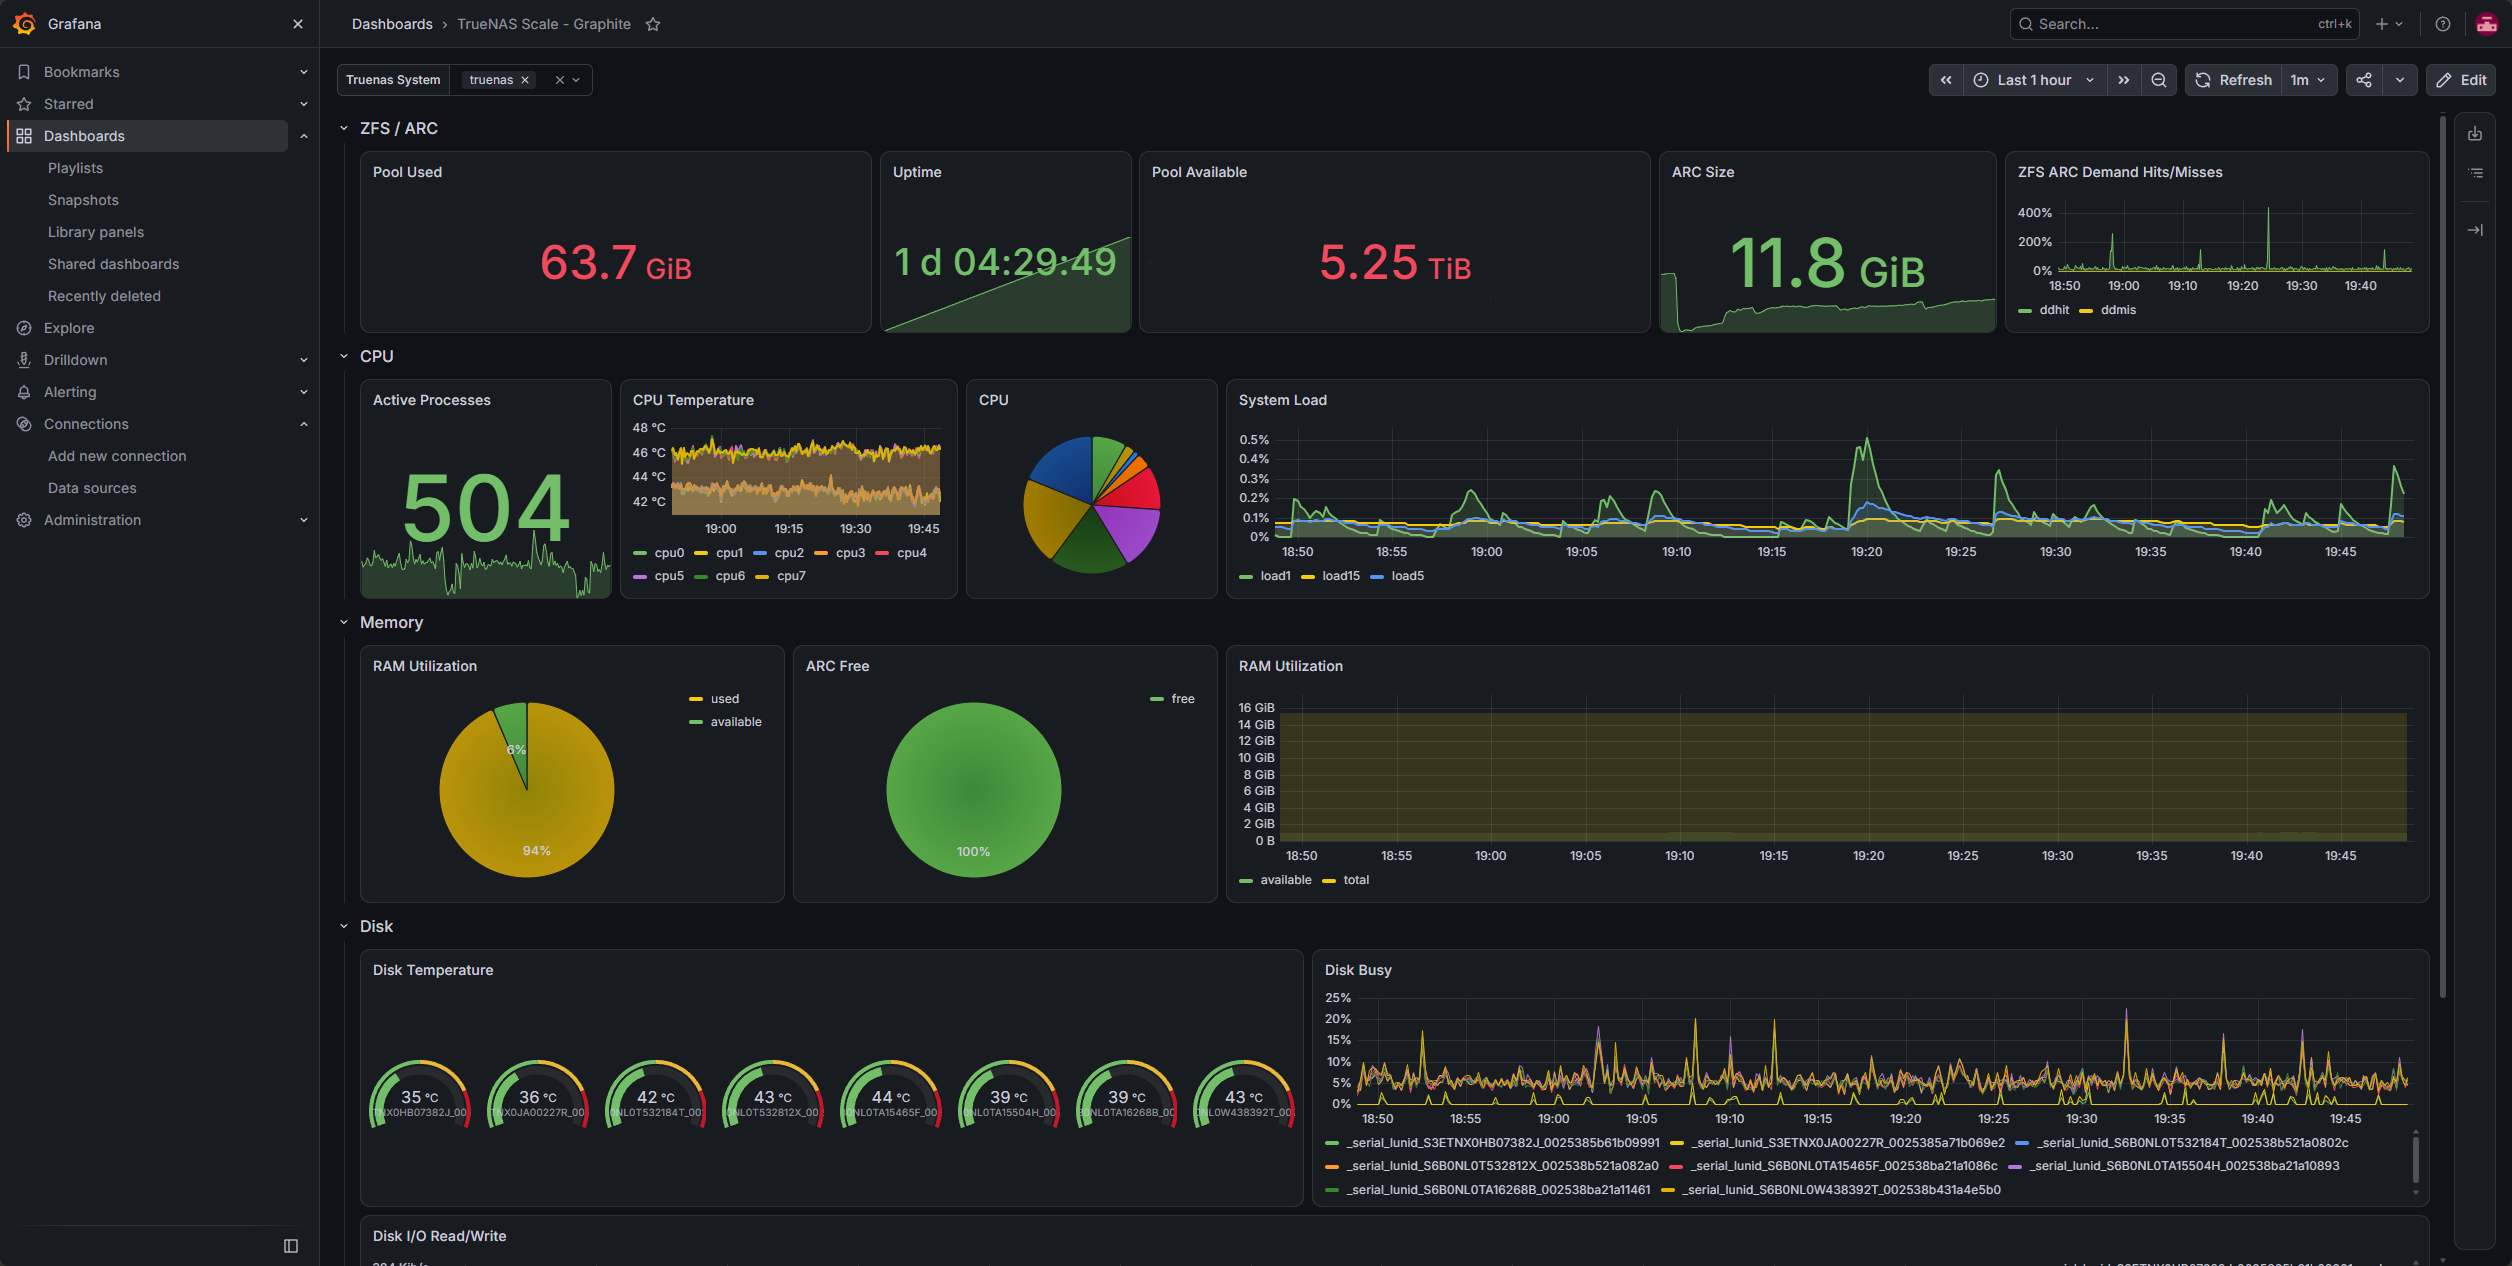
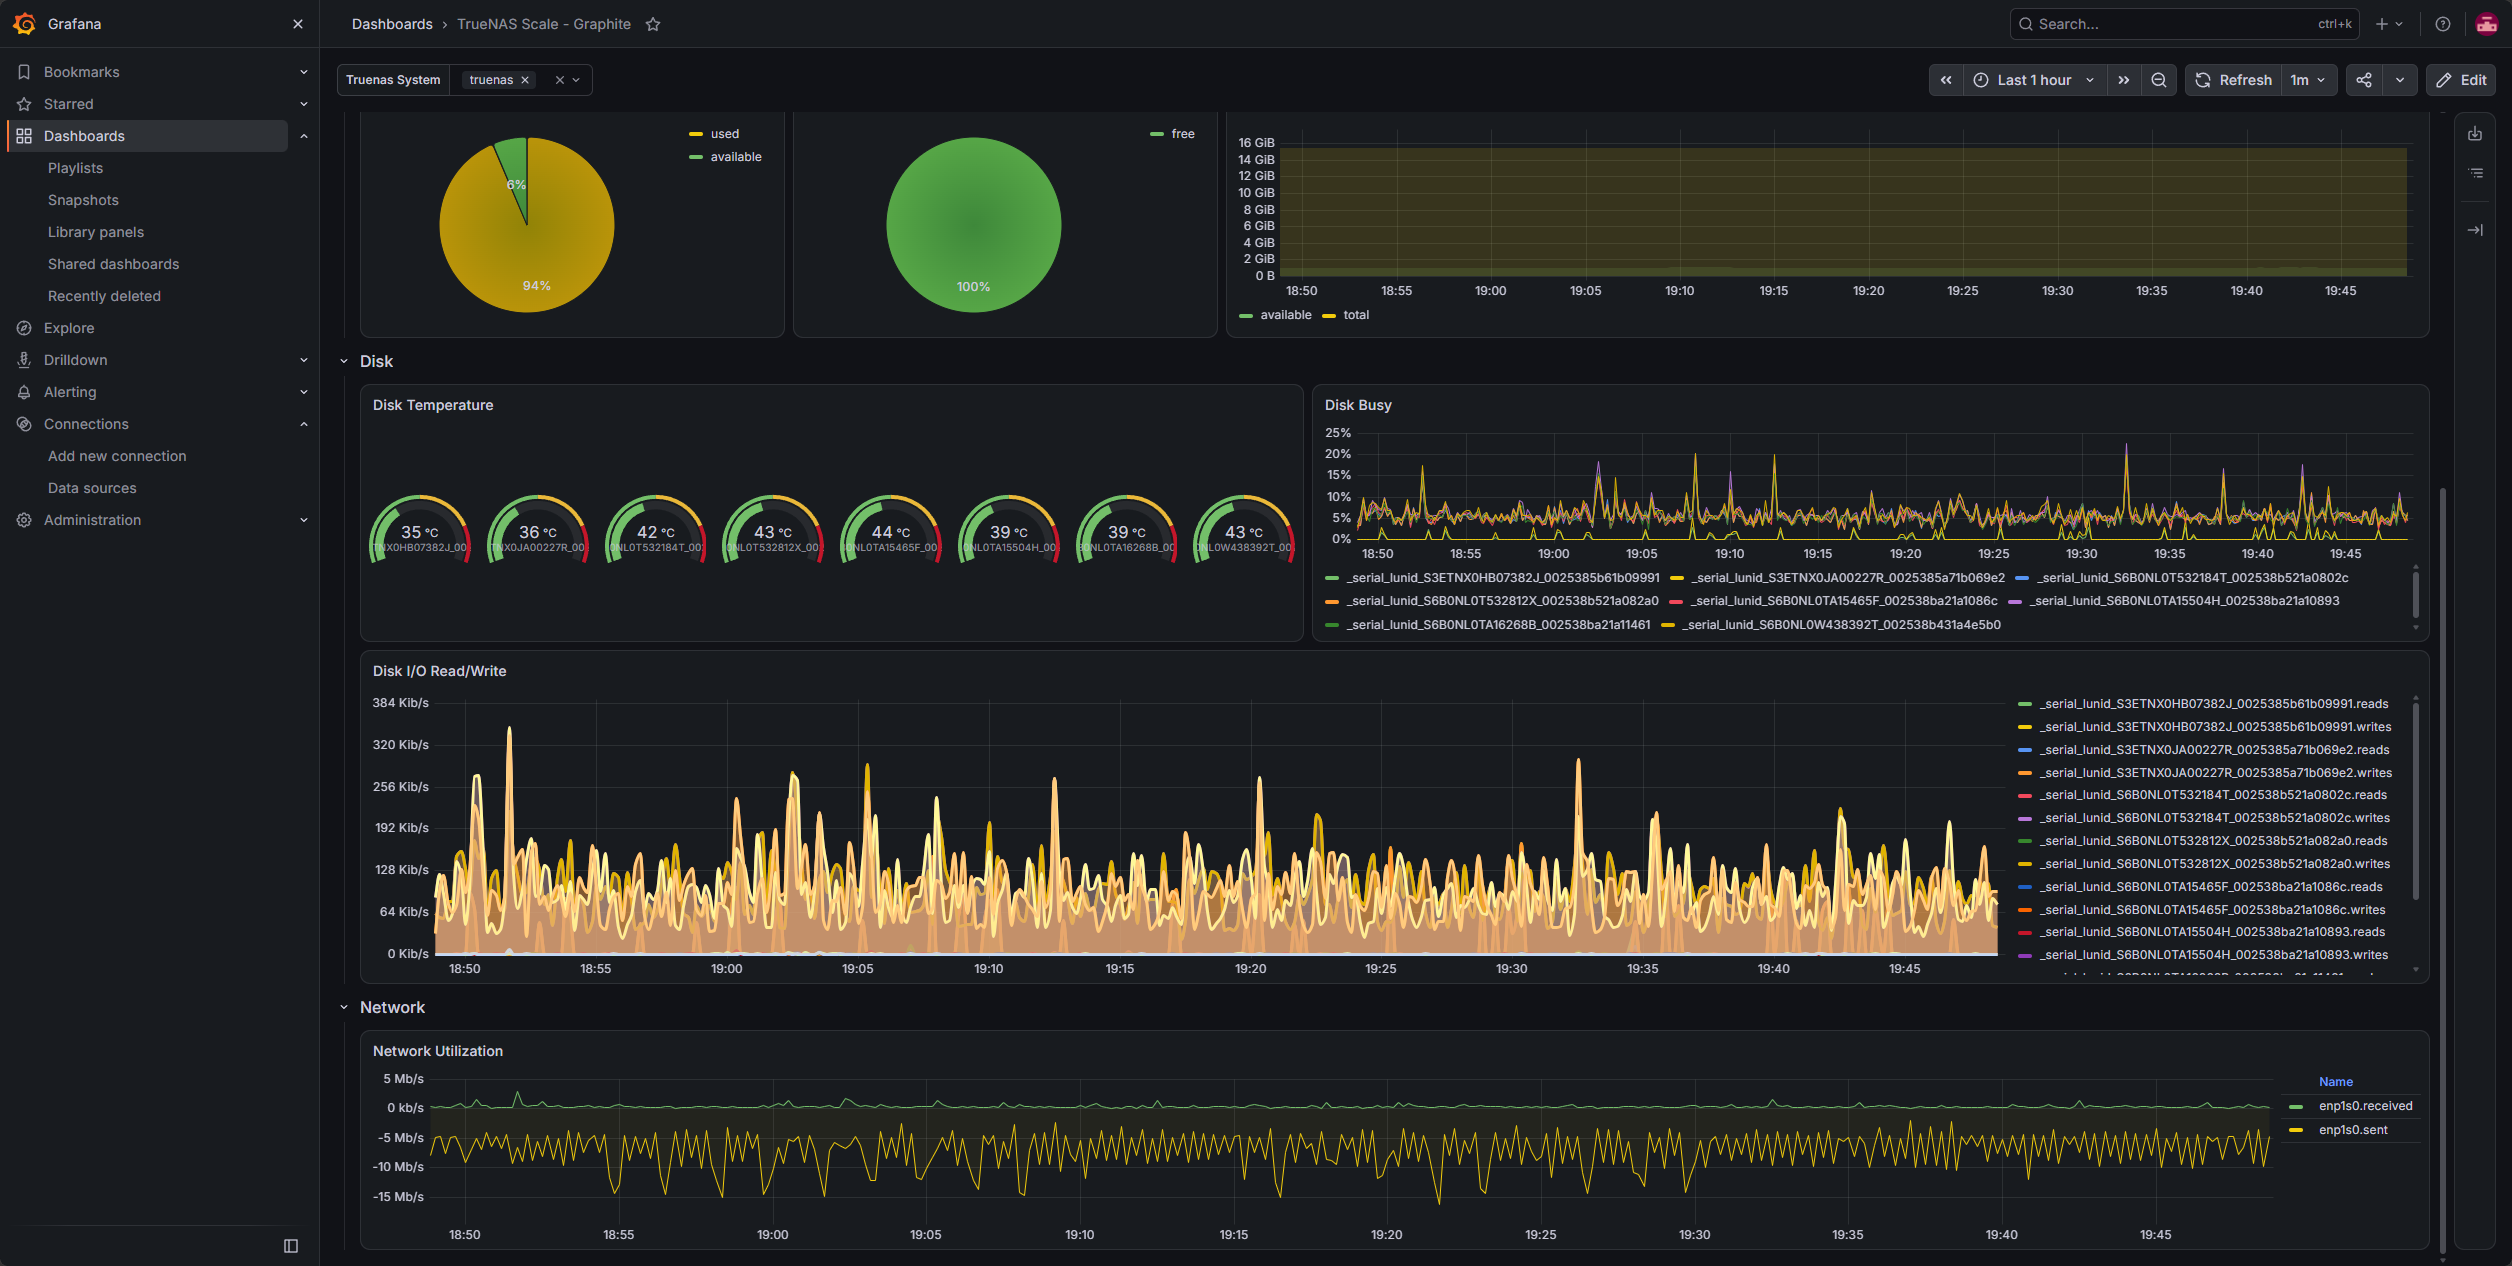
Below, I have scrolled down on the same dashboard and viewing the network statistics here.
What would I watch for Proxmox storage?
The best thing the graphs can do is explain what you are seeing with your VMs, if you are experiencing slowness or lagginess in performance. Metrics that I would watch are:
- Pool usage
- Disk reads and writes
- Busy time
- Temperatures
- ZFS ARC behavior and trends
Using this to monitor TrueNAS with Grafana I think is a great way to trend these types of values in a way that you might not spot by just looking sporadically in the TrueNAS dashboard. Having historical data is really a great way to keep a check on your storage running in TrueNAS.
Wrapping up
All in all, this was a good exercise to monitor TrueNAS with Grafana and getting data exporting from TrueNAS. I think if I repeated this setup, it would go more smoothly as I would be familiar with some of the gotchas up front. The next thing that I am going to do is put Prometheus in the middle for a more modern metrics export to Grafana solution. How about you? Are you monitoring your TrueNAS configuration inside of Grafana using the same type of setup I am using here? Do you know a better way that I am missing?
More in this topic




Google is updating how articles are shown. Don’t miss our leading home lab and tech content, written by humans, by setting Virtualization Howto as a preferred source.
About The Author