


I see so many tools listed and presented that are said to solve a problem in the Proxmox realm. I have tried many different tools over the past couple of years for Proxmox and only a few have impressed me. That said, I discovered a tool called PVEViewer that felt different to me. Let’s take a look at this inventory and audit tool that I think is super interesting for Proxmox VE Server home labs and production environments. Let’s see why.
What is PVEViewer?
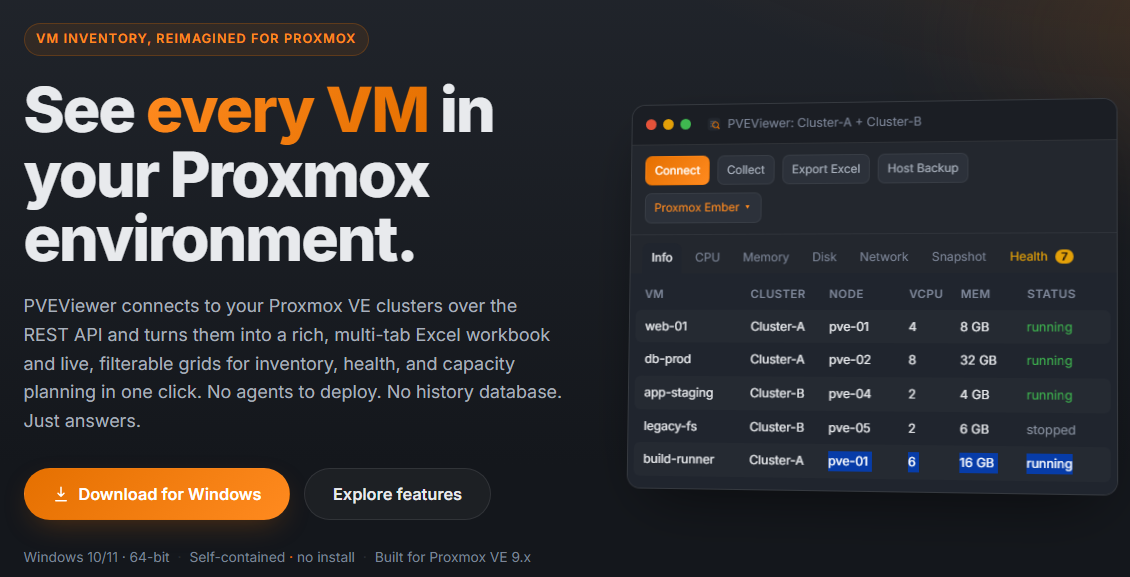
PVEViewer is a free Windows-based inventory tool for Proxmox VE Server that connects to your environment using the Proxmox REST API and it collects together detailed information about your environment. PVEViewer gives you a very detailed look at information from your PVE environment that includes VMs, hosts, storage, snapshots, guest agent status, capacity, and also VERY interesting cluster health and best practices recommendations.
According to the developer’s site, it is built for Proxmox VE 9.x. It supports current Windows operating systems, including Windows 10 and Windows 11. Also interesting is that it runs from a self-contained executable with no installer required which is nice.
That last part caught my attention right away. A lot of us who came from VMware environments have grown used to having simple inventory tools that can quickly show what is running, where it is running, what resources are assigned, and what might need attention. Proxmox has a great web interface, and it continues to get better, but there is still a difference between managing a cluster and creating a portable report or audit view of that cluster.
That is where PVEViewer helps to fill those gaps.
Installing and running PVEViewer
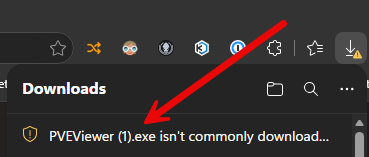
As mentioned, there isn’t an installation process. You just download the self-contained executable for PVEViewer which at the time of this writing is around 75MB in size. One thing to note is that my browser did flag it as a suspicious file
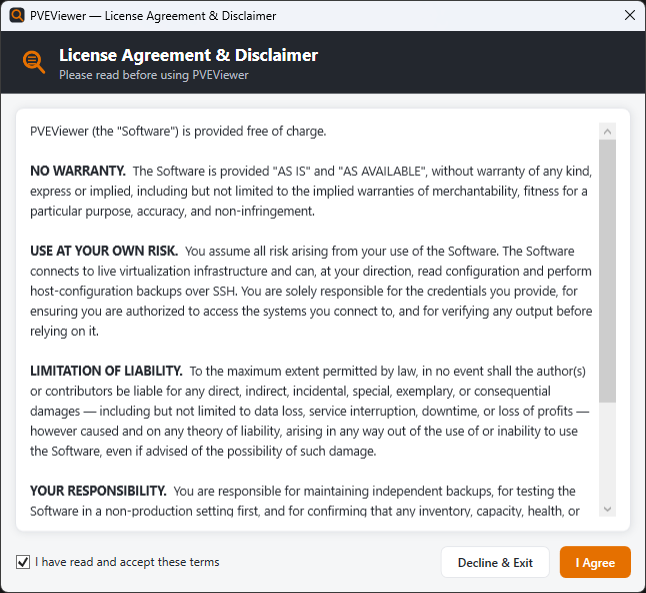
When you launch the self-contained executable, you will be presented with the EULA. Click the “I Agree” button to proceed using it.
Then, you will see the PVEViewer utility dashboard after accepting the EULA.
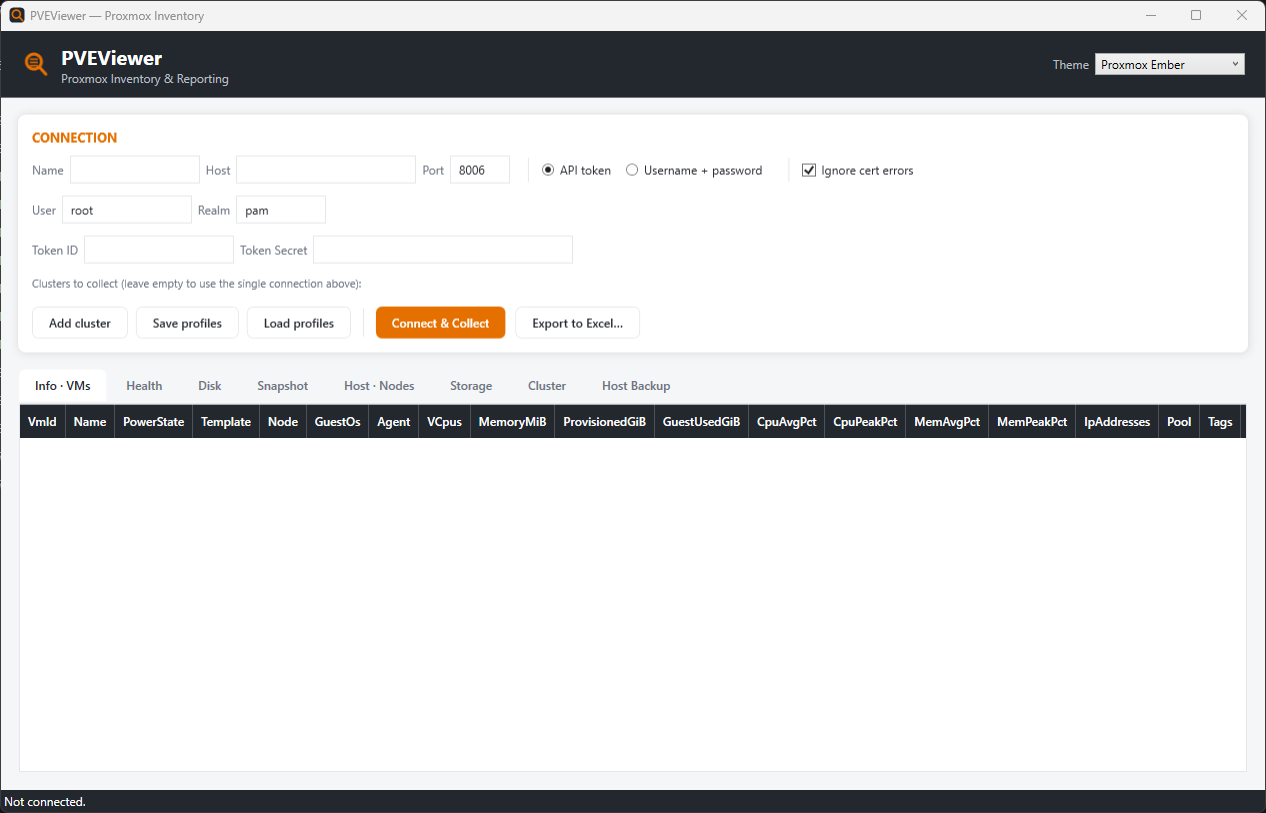
Changing the theme for dark mode
One of the nice features of PVEViewer is the ability to change the theme of the tool. It defaults to light mode like a lot of other tools. But, you can also change from the light mode over to the
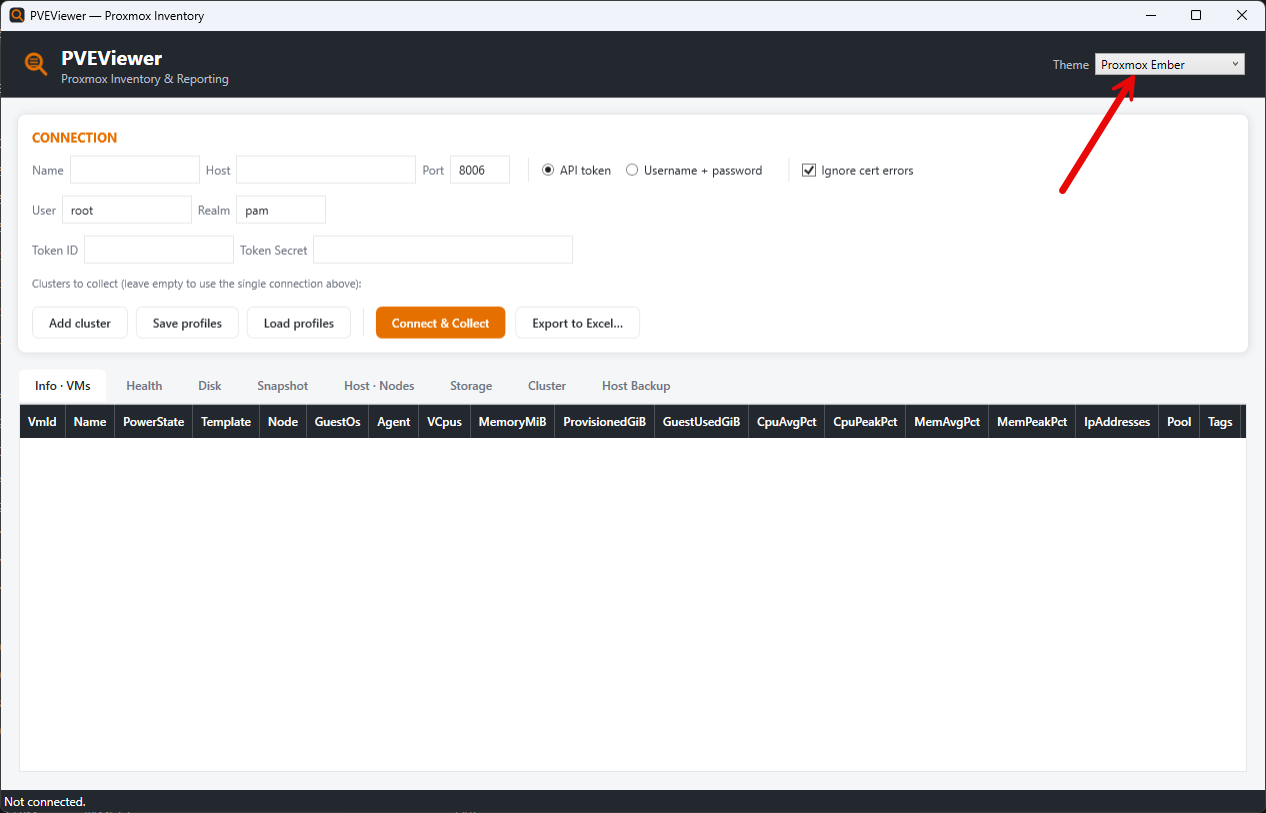
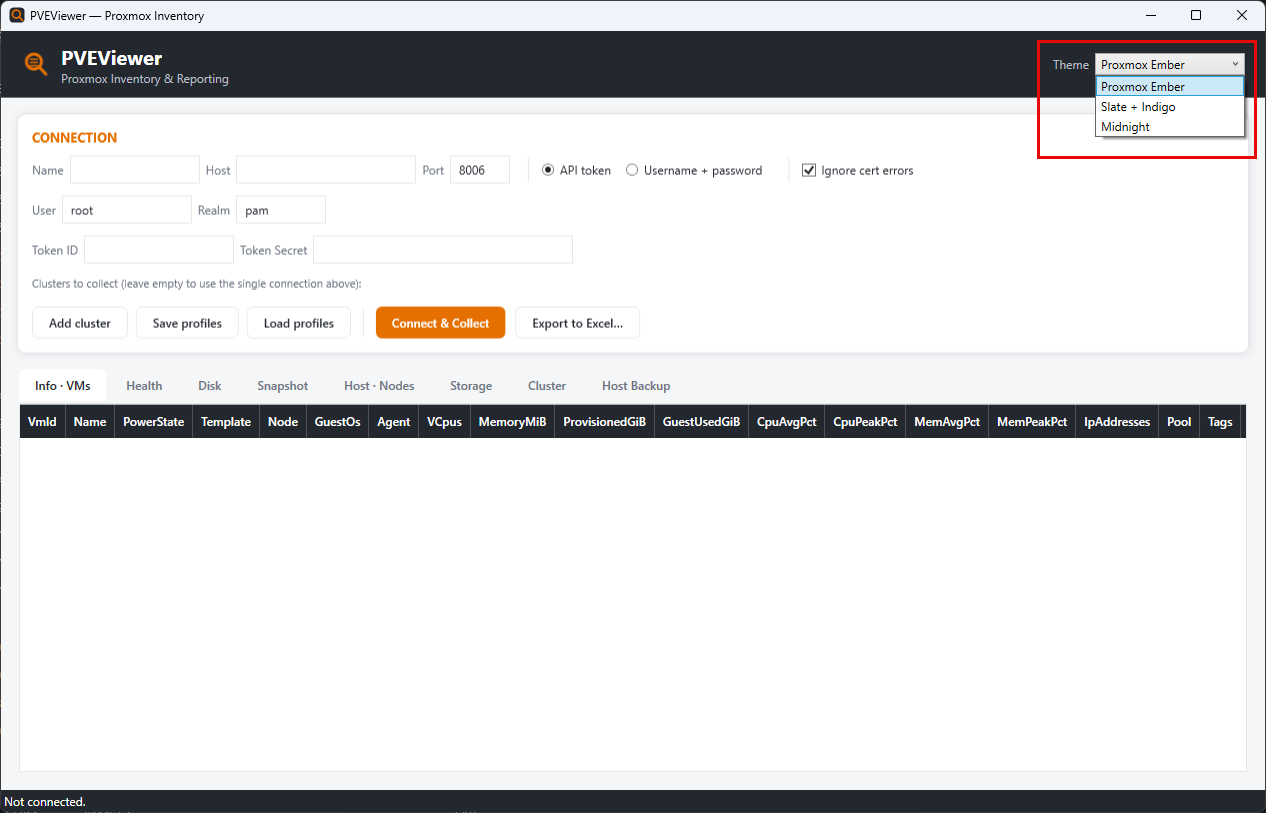
Below, you can see the three themes that are currently available in this release:
- Proxmox Ember
- Slate + Indigo
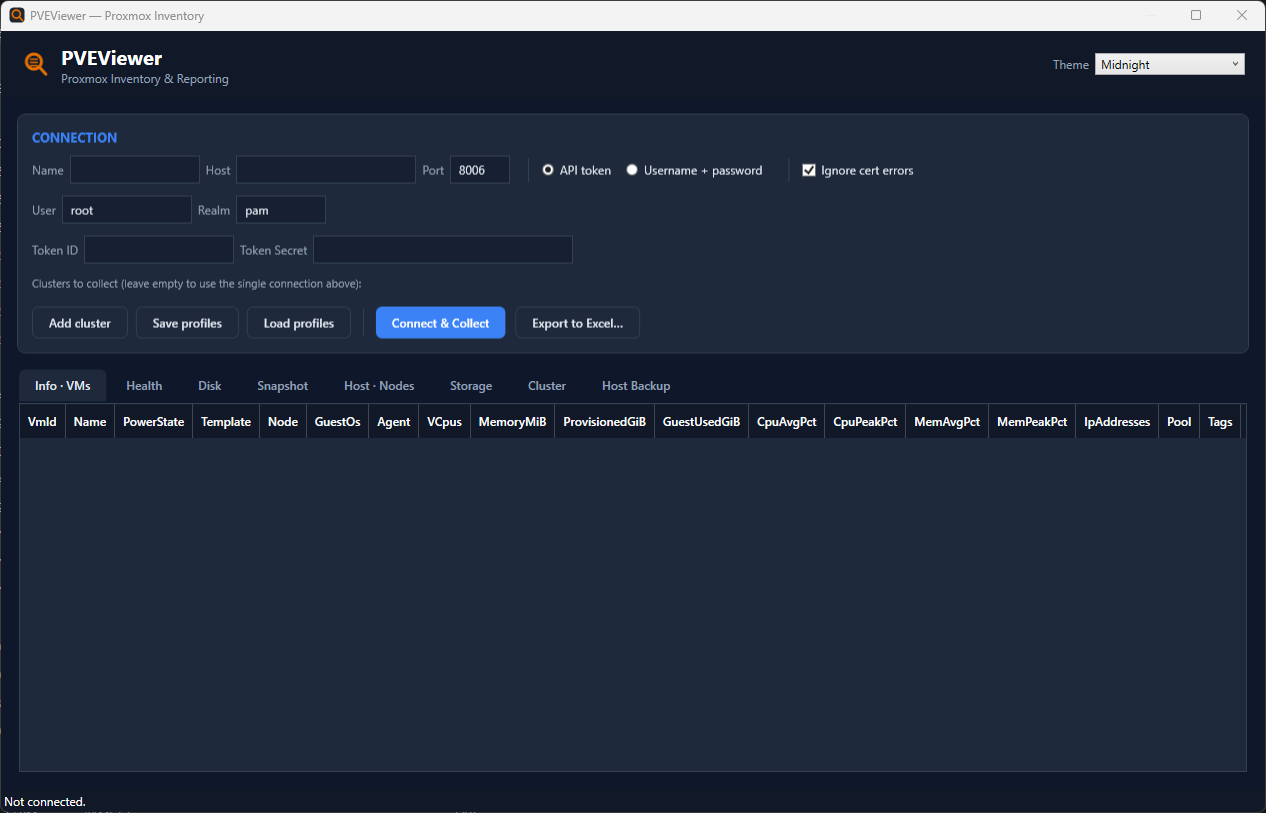
- Midnight (dark mode equivalent)
Here is a look at the Midnight theme which looks nice.
Connecting to your Proxmox VE Servers and Clusters
The next thing you will want to do to actually start using PVEViewer is connect to your Proxmox environment. To do this, click the Connect & Collect button.
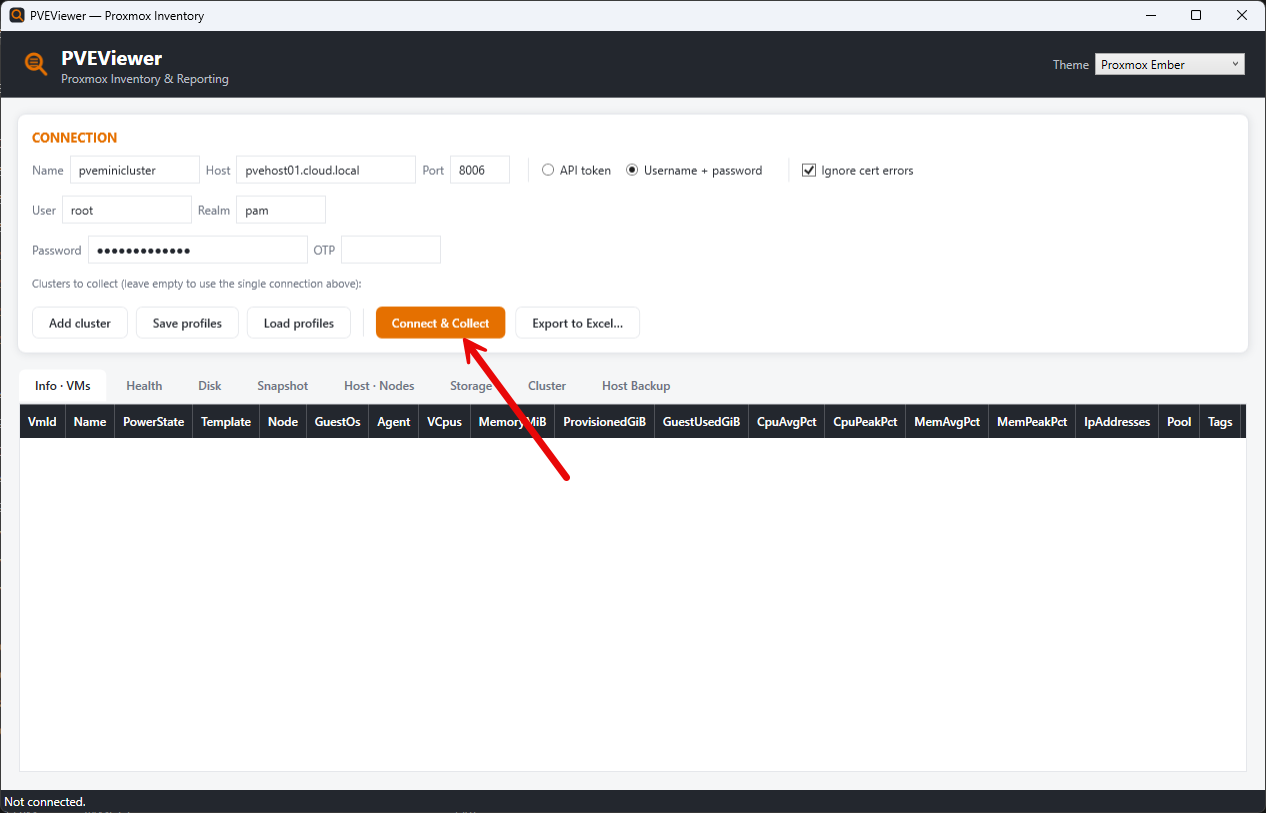
You have options here on how you want to authenticate to your cluster. I like that PVEViewer includes the options for both API token and Username + password. You can also ignore cert errors which you will need for the standard self-signed certificates out of the box.
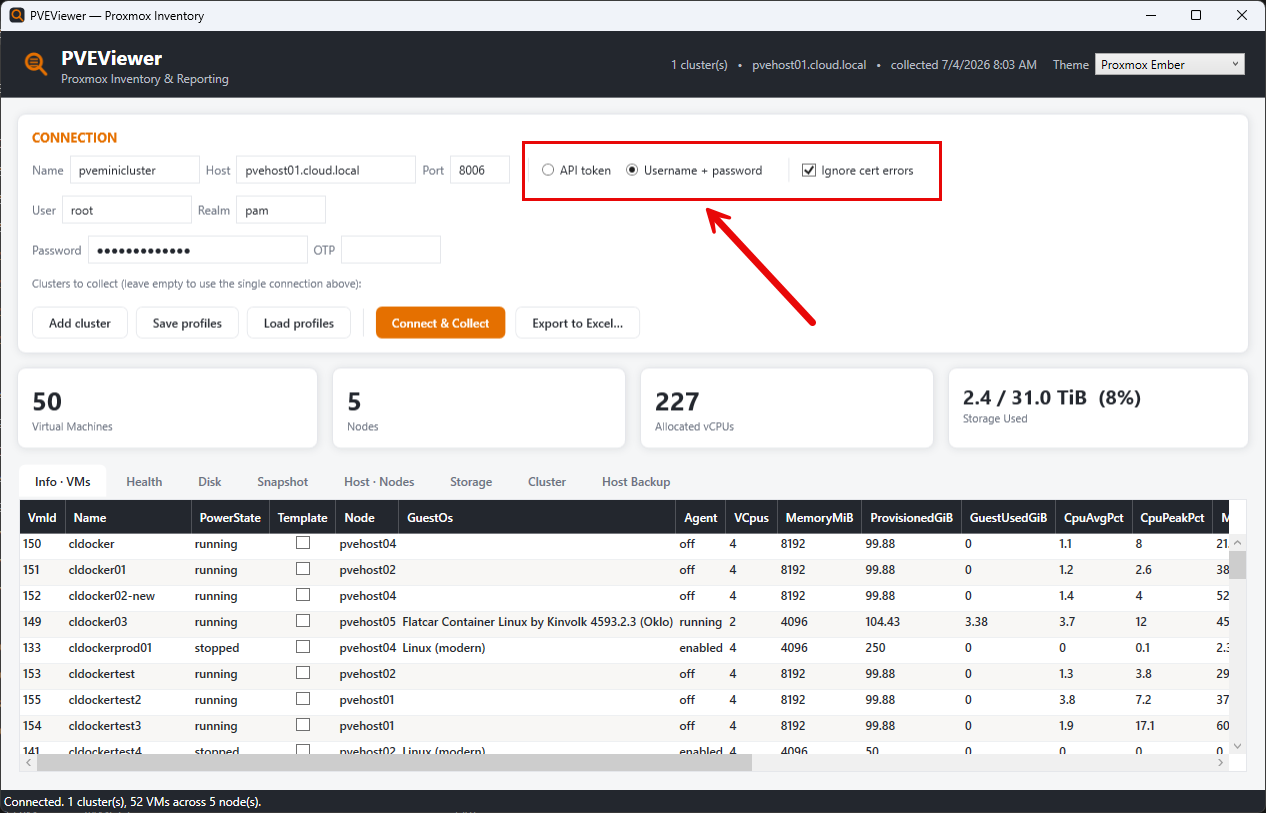
Below, I have connected and you see the output of virtual machines listed from my cluster. I have already clicked below to sort the returned VMs by name. Automatically, it gives you great information out of the box.
Information that PVEViewer gives you
There is lots of really great information you can get from PVEViewer with a simple collection against your PVE host or cluster. Let’s step through the columns you will see here:
Of course we get a sortable listing with all the columns, including the VM names. You get a powerstate colum for the current powered on state. You get a column for template. This shows a checkbox if the object is a template. The node column shows which node the VM is running on. The guestOS column shows you the guest OS that is noted in Proxmox. And a great view on the agent to show the state of the qemu agent and whether or not it is enabled and running.
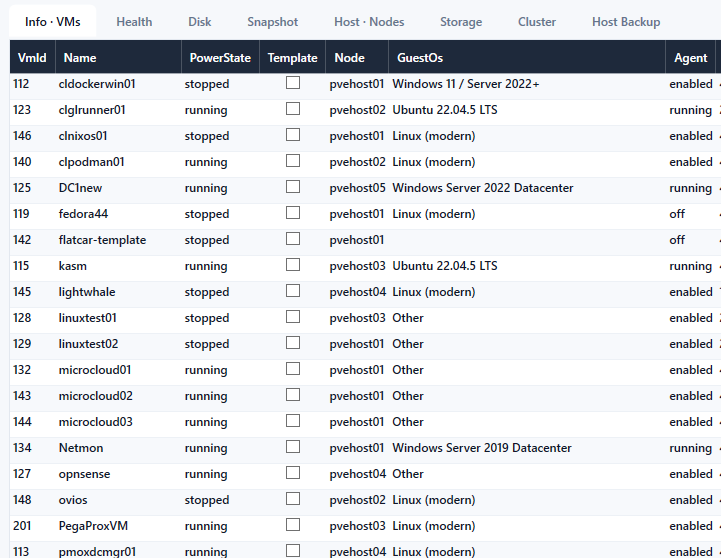
The next set of columns we get a great view of the resource configuration and information in the cluster for our virtual machines. Here we can see things like vCPUs, MemoryMiB, ProvisionedGiB, GuestUsedGiB, CPUAvgPct, CPUAvgPct, CPUPeakPct, MemAvgPct, MemPeakPct, and IPAddresses. This is a great way to see at a glance your resource configurations across the estate and things like IP addresses, etc. The ones where you don’t see IP addresses are VMs that are either off or the QEMU agent isn’t running.
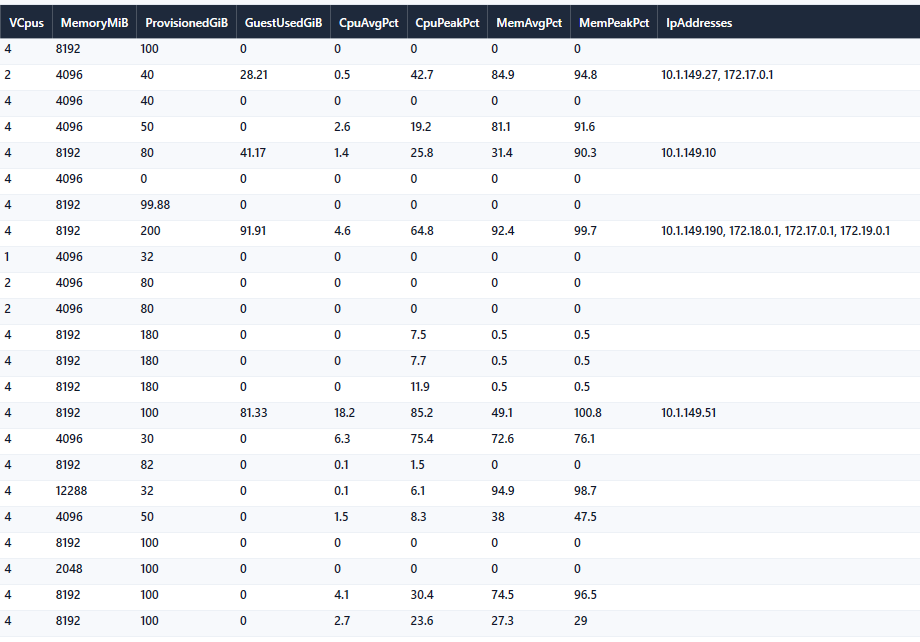
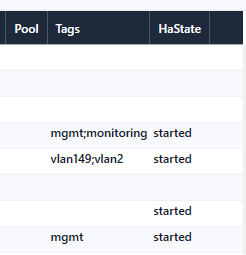
The last columns show you Pool information, tags, and HAstate. These are all great to quickly see which VMs are tagged with specific tags and also which VMs you have enabled for HA.
Health and best practices
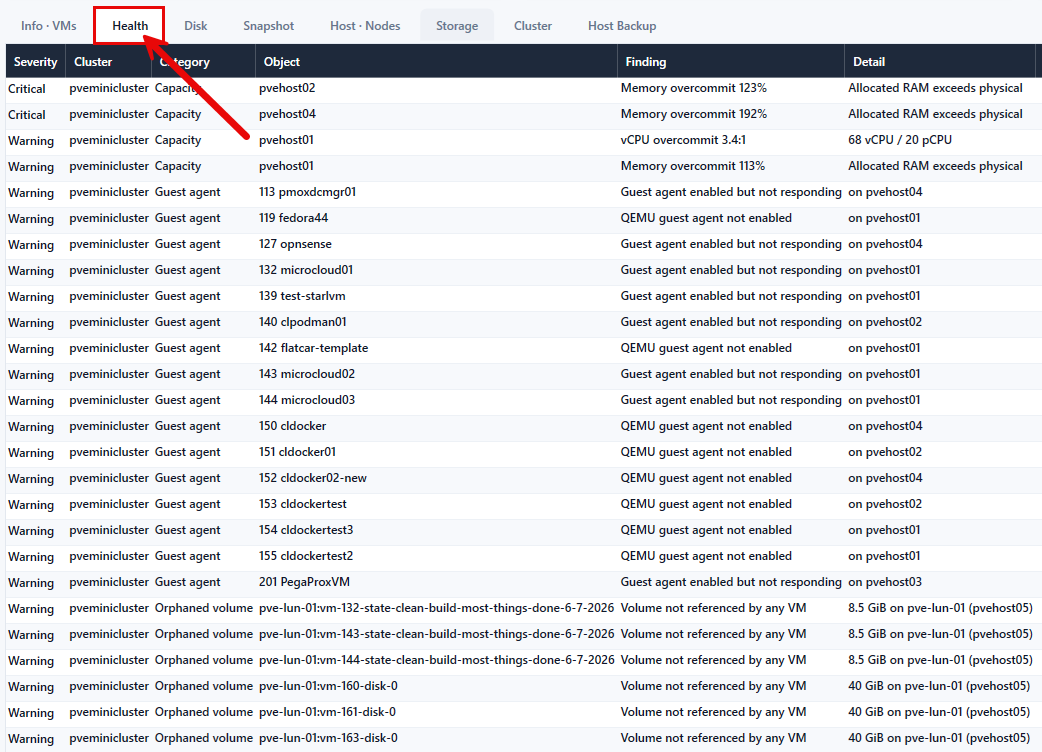
One of the great things that PVEViewer does is it gives you health and best practices recommendations to surface things that help you correct issues before these turn into problems. As you can see below, the Health tab is where you will find this information.
The Health items that it returns are sorted based on the Severity level. As you can see I have items listed as Critical and Warning, and a few at the bottom which you can’t see in this screenshot that are informational.
You get a great view of things like memory overcommit, vCPU overcommit, guest agent statuses whether these are enabled or not responding. And, also, you get great information on orphaned disks that are not referenced by any VM. This helps you to reclaim disk space that is silently being taken by unseen zombie disks.
Disk information
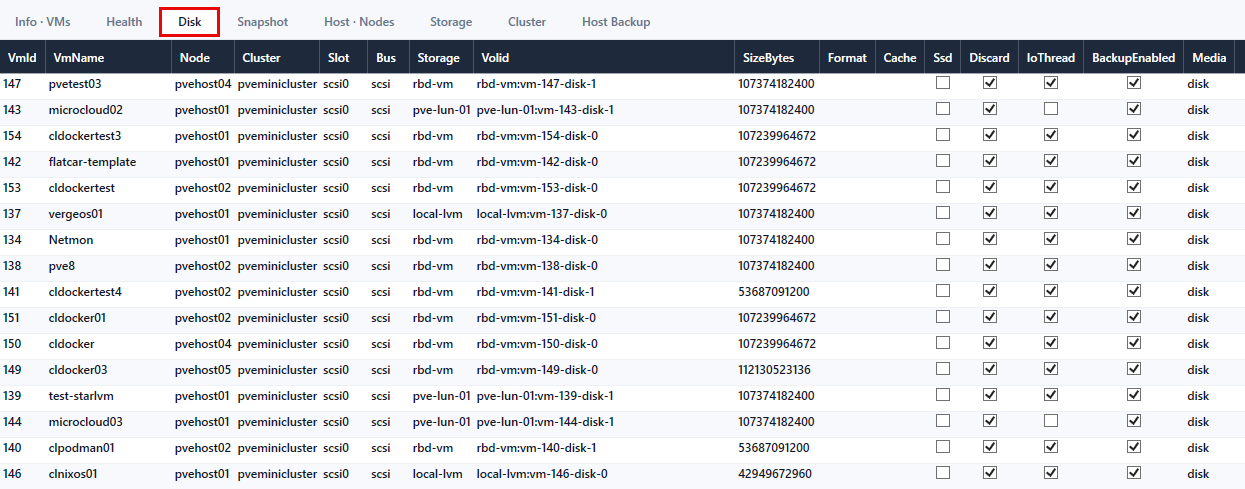
The Disk tab provides a great view of disk information for your virtual machines running in the environment. One of the things I really like about this is that you can easily see things like VMs that don’t have Discard or IOThread enabled.
Snapshots
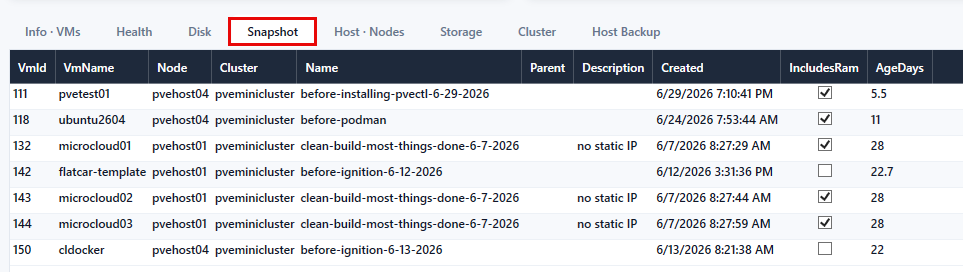
On the Snapshots tab, we can see snapshots that we have across the entire environment. This is super helpful to have visibility to snapshots that maybe you have forgotten are there and to be able to do housekeeping on that front.
Host nodes
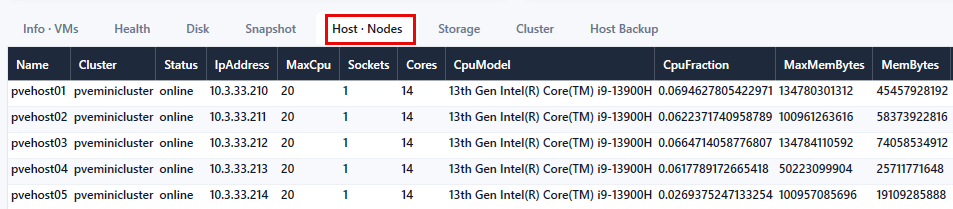
The Host nodes tab shows you information about all of your PVE hosts in the cluster, including status, IP addresses MaxCPU, sockets, cores CPU Models, etc.
Storage
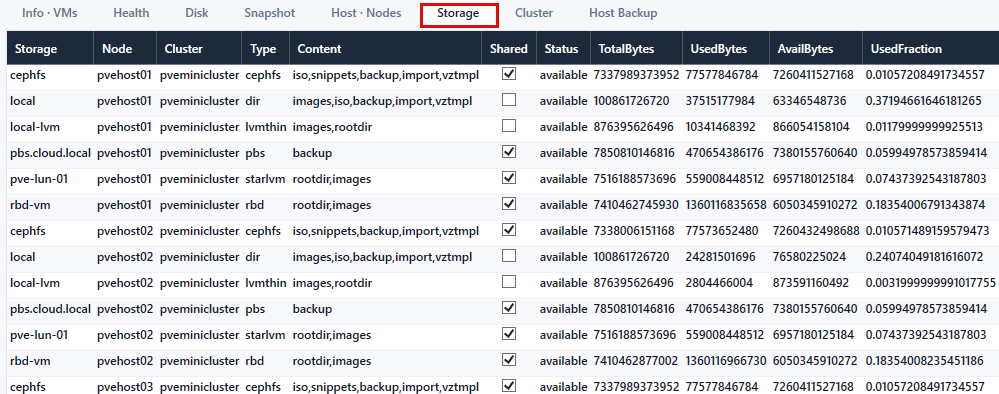
On the storage tab, we can see information about the storage allocated on the nodes in the cluster. You can see content the storage is enabled for, whether or not it is shared, status, sizes, etc.
Cluster information
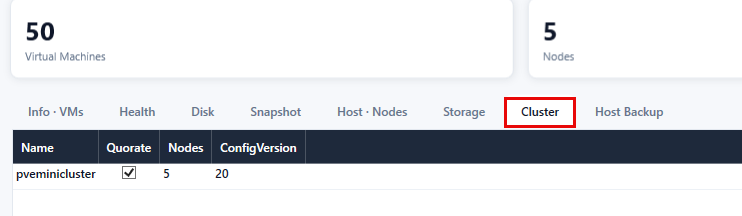
On the cluster tab, you see information about your PVE cluster, including quorate, nodes, config version, etc.
Host config backups
One of the cool and unexpected features that I found as part of the tool and that is also super interesting when you are thinking about your disaster recovery strategy is the Host backup feature. You also get the ability to encrypt using AES-256. This is a feature that allows you to backup each hosts’ config over SSH. What does it include?
- Network config
- Storage config
- /etc/pve
- VM/CT configs
- users
- SSH host keys
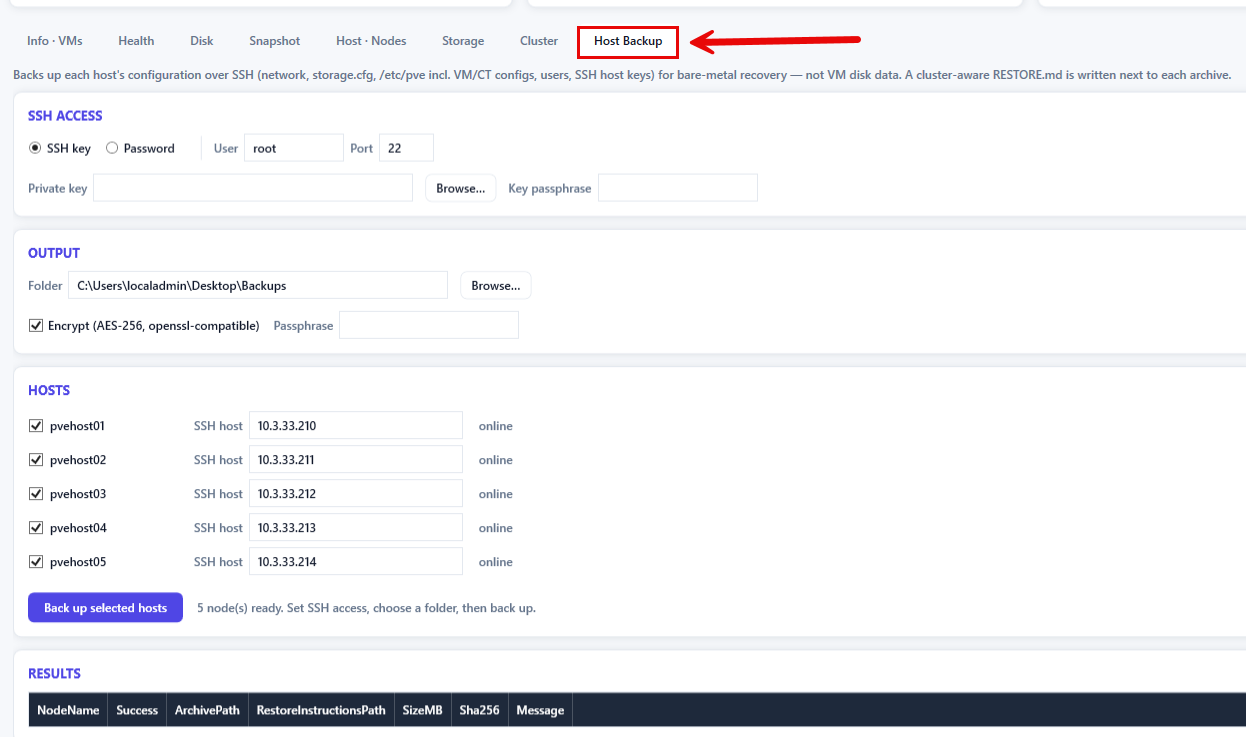
This is an area of DR that often gets missed and that is the ability to get your hosts configured back the way you had them before a disaster. It can be a huge time sink if you don’t have this information backed up.
Keep in mind. This is not a replacement for Proxmox Backup Server. It is not a replacement for vzdump. It is not a VM backup strategy. But, it is a bare-metal recovery helper for the Proxmox host configuration that can be very useful.
In my opinion, this is the kind of feature that fits well beside your normal backup strategy. I would still want proper VM backups. I would still want PBS for real backup and restore workflows. But having host configuration captured separately is a smart addition. Backups and recovery are like security. They work best in layers.
Multi-cluster visibility is a smart feature
Another feature that stands out is multi-cluster support. PVEViewer can add up to two clusters per site, save reusable connection profiles, and merge the data into a single workbook with a source-cluster column on every tab.
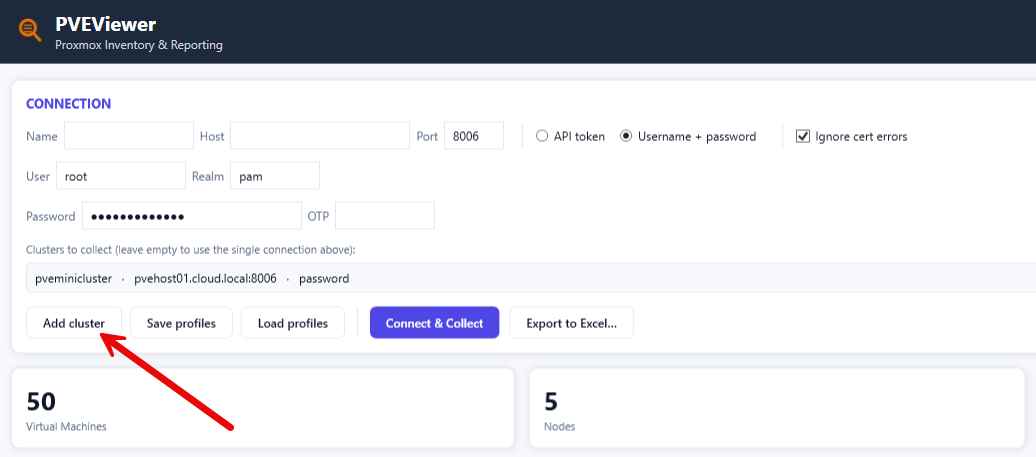
This “combined” look at your estate is extremely helpful since it allows you to view the results across your environment, including multiple hosts, clusters.
PVEViewer CLI
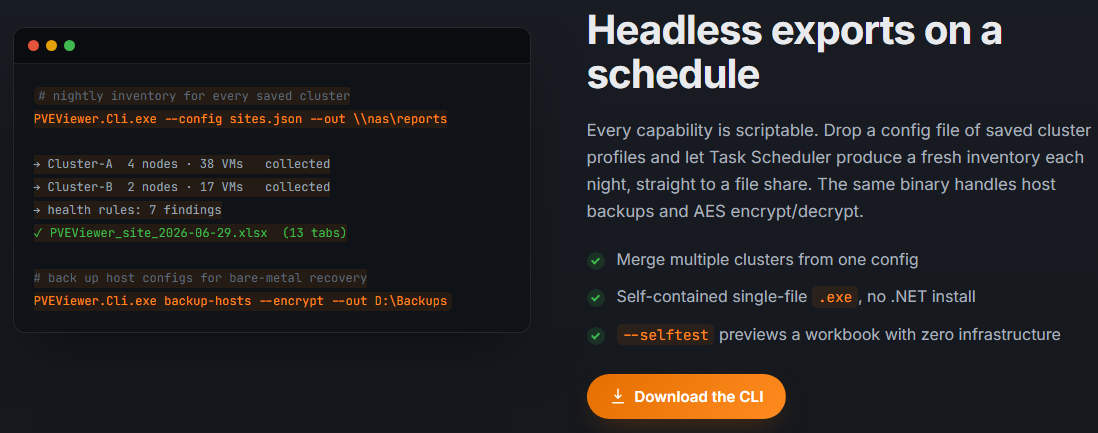
PVEViewer also has a CLI tool that gives you the ability to have headless exports of your environment on a schedule. This is a separate download, but if you were thinking in the section above, “it would be nice if I could schedule host config exports”, this is the tool that allows you to do that. Very cool.
One limitation to know about
The biggest limitation I saw is that PVEViewer does not support LXC containers in this version. The FAQ page says it focuses on QEMU/KVM virtual machines for capacity planning and inventory. Many in the home lab use a mix of VMs and containers, so keep this in mind.
I would imagine that this is on the roadmap of upcoming features for the tool though and once added, it will give you total visibility over your environments, including Linux containers.
Wrapping up
I definitely think there are a few tools that are worth having in the home lab when it comes to helping manage your Proxmox VE Server environment. I have to say that PVEViewer is one that has made my short list of tools and utilities that I keep around close. I think the developer has really checked all the right boxes with the tool. It doesn’t require you to install anything on your PVE hosts, it runs in Windows, it looks nice, easy to use, has a CLI mode, and it can help easily spot health issues in the environment. What about you? Is this a tool that you have tried out as of yet or are going to try out? Let me know in the comments.
More in this topic

Google is updating how articles are shown. Don’t miss our leading home lab and tech content, written by humans, by setting Virtualization Howto as a preferred source.
About The Author

I have tried some of the other tools you have showcased, but nothing like this. I think this looks like the most professional RVTools like tool for Proxmox from what I can tell. Still testing it though but definitely my pick.
Windows blocks the exe file as it’s not signed.
Developer needs to fix that.
Dave,
Yes good call out on that. Definitely hoping the dev gets this in place as it will make the app much more reputable.
Brandon