There are a lot of expensive VMware vSphere monitoring tools out there from enterprise vendors that work really well and have a lot of bells and whistles to monitor VMware ESXi hosts, virtual machines, vCenter Server, and vSphere monitoring in general. However, you can do VMware monitoring for free using free and open source tools that are readily available. Let’s look at VMware monitoring for free with Telegraf, InfluxDB, and Grafana and see how you can easily spin this up for VMware performance monitoring in your environment.
Spin up a TICK stack
I recently wrote about how you can easily stand up a TICK stack in your environment running on top of Docker containers which can be provisioned as a stack using docker compose code running on a Docker container host on a Linux operating system. You can read my blog post covering that topic here:
TICK stands for the components it contains, including Telegraf, InfluxDB, Chronograf, and Kapacitor. Spinning up the stack provides the monitoring side of the components. Then we can simply add Grafana on top of the TICK stack to have a way to visualize the data collected monitoring VMware vCenter, ESXi, virtual machines, datastores, and other components in the VMware environment.
Components of a VMware vSphere environment
Let’s get a high-level overview of the components of vSphere as we will need to understand the various points of contention to understand how we can best monitor the environment. Components that we want to monitor, include:
- vCenter Server
- ESXi hosts
- Virtual machine instances
- CPU, memory, networking
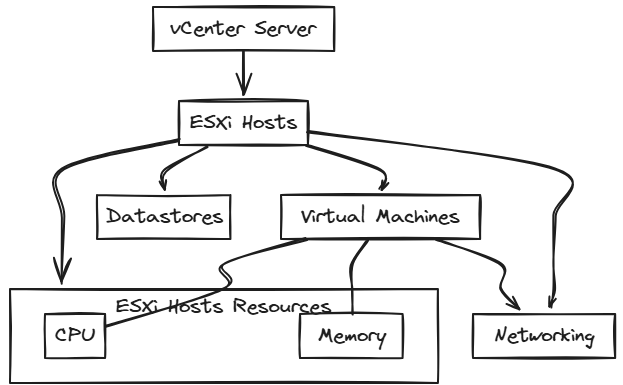
We want to be able to capture performance metrics from the various components in the environment, including system resources for hosts and the workloads they run. Also, vCenter datastores, vCenter hosts as part of vSphere clusters, but also standalone ESXi hosts in the virtual environment.
What do we need?
The following are things you will need to stand up your monitoring environment:
- A docker container host installed with Docker and Docker Compose
- Docker Compose code (Telegraf, InfluxDB, Chronograf, and Kapacitor, but also Grafana)
- The Telegraf plugin for vSphere
We will assume you already have a Docker Container host installed with Docker and Docker Compose for the rest of the tutorial. Once you have the Docker container host ready, we just simply need to spin up the required containers using Docker Compose code.
Docker compose code for TICK stack and Grafana
Below is example code to spin up the TICK stack along with Grafana. As a note, you must change the Docker network to match what you have in your environment. Again, reference my blog post on the TICK stack in general for additional configuration needed here: TICK Stack with Docker Compose Example.
version: '3.8'
services:
  grafana:
    image: grafana/grafana
    container_name: grafana
    user: "1001"
    restart: always
    ports:
      - 3000:3000
    networks:
      - nginxproxy
    volumes:
      - "~/homelabservices/grafana/grafana-volume:/var/lib/grafana"
    user: "1001"

  telegraf:
    image: "telegraf:latest"
    hostname: "telegraf"
    container_name: telegraf
    volumes:
        - "~/homelabservices/telegraf/etc/telegraf.conf:/etc/telegraf/telegraf.conf"
    networks:
        - nginxproxy

  influxdb:
    image: influxdb:latest
    container_name: influxdb
    restart: always
    ports:
      - 8086:8086
      - 8089:8089/udp
    networks:
      - nginxproxy
    volumes:
      - "~/homelabservices/influxdb/influxdb-volume:/var/lib/influxdb"

  chronograf:
    image: "chronograf:latest"
    hostname: "chronograf"
    container_name: chronograf
    user: "1001"
    ports:
        - "8888:8888"
    volumes:
        - "~/homelabservices/chronograf/chronograf-data:/var/lib/chronograf"
    networks:
        - nginxproxy

  kapacitor:
    image: "kapacitor:latest"
    hostname: "kapacitor"
    container_name: "kapacitor"
    user: "1000"
    volumes:
        - "~/homelabservices/kapacitor/kapacitor-data:/var/lib/kapacitor"
        - "~/homelabservices/kapacitor/kapacitor-data/etc/kapacitor.conf:/etc/kapacitor/kapacitor.conf"
    networks:
        - nginxproxy
Once you have the code in place, simply run the following:
docker-compose up -dThis will bring “up” the Docker container stack for monitoring and visualization of the VMware environment.
Telegraf plugin
Once you have your Docker host provisioned with the five containers we have mentioned above, we can provision the Telegraf plugin for vSphere monitoring. It allows pointing to a vCenter instance and pulling the metrics about VMware resources in the environment.
It supports the following vSphere environment versions: Version 6.5, 6.7, 7.0 and 8.0. It may work with versions 5.1, 5.5 and 6.0, but are not supported, as such.
You can read more about the Telegraf plugin here: VMware vSphere Monitoring | InfluxData.
What does it monitor?
It allows you to monitor various metrics in the VMware environment, including:
- vCenter clusters
- Cluster services: CPU, memory, failover
- CPU: total, usage
- Memory: consumed, total, vmmemctl
- VM operations: # changes, clone, create, deploy, destroy, power, reboot, reconfigure, register, reset, shutdown, standby, vmotion
- Host Stats:
- CPU: total, usage, cost, mhz
- Datastore: iops, latency, read/write bytes, # reads/writes
- Disk: commands, latency, kernel reads/writes, # reads/writes, queues
- Memory: total, usage, active, latency, swap, shared, vmmemctl
- Network: broadcast, bytes, dropped, errors, multicast, packets, usage
- Power: energy, usage, capacity
- Res CPU: active, max, running
- Storage Adapter: commands, latency, # reads/writes
- Storage Path: commands, latency, # reads/writes
- System Resources: cpu active, cpu max, cpu running, cpu usage, mem allocated, mem consumed, mem shared, swap
- System: uptime
- Flash Module: active VMDKs
- Virtual Machine Stats:
- CPU: demand, usage, readiness, cost, mhz
- Datastore: latency, # reads/writes
- Disk: commands, latency, # reads/writes, provisioned, usage
- Memory: granted, usage, active, swap, vmmemctl
- Network: broadcast, bytes, dropped, multicast, packets, usage
- Power: energy, usage
- Res CPU: active, max, running
- System: operating system uptime, uptime
- Virtual Disk: seeks, # reads/writes, latency, load
- Datastore stats:
- Disk: Storage Capacity, provisioned, used
The Github project URL is located here: telegraf/plugins/inputs/vsphere/README.md at master · influxdata/telegraf.
How do you install the vSphere Monitoring plugin for Telegraf?
This part is quite easy. Unlike some other apps where we are used to copying down files into some type of plugin directory, the plugin functionality is already built into Telegraf. We just need to enable it in the telegraf.conf file. \
Below is a telegraf.conf file running in my home lab environment. It is using InfluxDB v2 authentication using the token, which I have left in so you can see the format and where things go.
Outside of the general telegraf specific config, you will see the plugin code starts with the section [[inputs.vsphere]]. The vCenter server connection is placed at the top with the username and password.
As a note, the plugin has the functionality to use secret stores for the username and password so you don’t have to code this in plain text (definitely what you want to do for production). But, for the purposes of showing the functionality, I am just placing it in the file directly. You can read more about how to use secret stores with the project here: telegraf/docs/CONFIGURATION.md at master · influxdata/telegraf.
# Global tags can be specified here in key="value" format.
[global_tags]
  # Example: environment="dev"

# Configuration for telegraf agent
[agent]
  interval = "10s"
  round_interval = true
  metric_batch_size = 1000
  metric_buffer_limit = 10000
  collection_jitter = "0s"
  flush_interval = "10s"
  flush_jitter = "0s"
  precision = ""
  debug = false
  quiet = false
  logfile = ""

# Input Plugins
[[inputs.cpu]]
  percpu = true
  totalcpu = true
  collect_cpu_time = false
  report_active = false

[[inputs.mem]]
  # no configuration

[[inputs.swap]]
  # no configuration

[[inputs.system]]
  # no configuration

[[inputs.disk]]
  ignore_fs = ["tmpfs", "devtmpfs", "devfs"]

[[inputs.net]]
  # no configuration

[[inputs.vsphere]]
  vcenters = ["https://vcsa.cloud.local/sdk"]
  username = "[email protected]"
  password = "password"

  vm_metric_include = [
    "cpu.demand.average",
    "cpu.idle.summation",
    "cpu.latency.average",
    "cpu.readiness.average",
    "cpu.ready.summation",
    "cpu.run.summation",
    "cpu.usagemhz.average",
    "cpu.used.summation",
    "cpu.wait.summation",
    "mem.active.average",
    "mem.granted.average",
    "mem.latency.average",
    "mem.swapin.average",
    "mem.swapinRate.average",
    "mem.swapout.average",
    "mem.swapoutRate.average",
    "mem.usage.average",
    "mem.vmmemctl.average",
    "net.bytesRx.average",
    "net.bytesTx.average",
    "net.droppedRx.summation",
    "net.droppedTx.summation",
    "net.usage.average",
    "power.power.average",
    "virtualDisk.numberReadAveraged.average",
    "virtualDisk.numberWriteAveraged.average",
    "virtualDisk.read.average",
    "virtualDisk.readOIO.latest",
    "virtualDisk.throughput.usage.average",
    "virtualDisk.totalReadLatency.average",
    "virtualDisk.totalWriteLatency.average",
    "virtualDisk.write.average",
    "virtualDisk.writeOIO.latest",
    "sys.uptime.latest",
  ]

  host_metric_include = ["*"]
  cluster_metric_include = ["*"]
  collect_concurrency = 3
  force_discover_on_init = true
  insecure_skip_verify = true

# Output Plugin InfluxDB
[[outputs.influxdb_v2]]
  urls = ["http://influxdb:8086"]
  token = "9pXZk5K9YkZuIAgWWqaOdOdoFpw03XWsZdSVS1N6lvw0D1q5ifUJgLrJZ_qVxu5itDrTrSrQ3Sg=="
  organization = "CloudLocal"
  bucket = "tickstack"
Pointing Grafana to InfluxDB
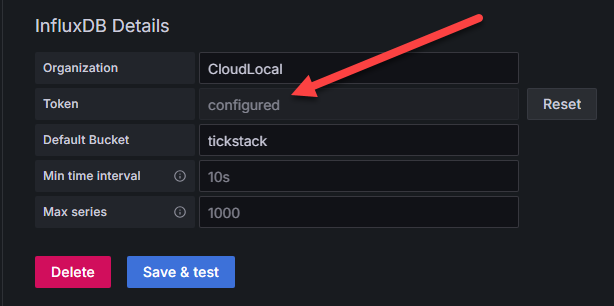
As we saw in the configuration file telegraf.conf, we are pointing Telegraf to InfluxDB to store the time series data. So, we just need to point Grafana at our InfluxDB instance to create dashboards. Under the Connections menu.
Since the containers are on the same host and isolated network in Docker, we can just point the connection to the short HTTP://influxdb:8086 URL string. Note how we are using Flux as the query language. We need to change to Flux as this will allow us to use V2 authentication.

Also, with V2 authentication, we need to enter the Organization, Token, and the Default Bucket.
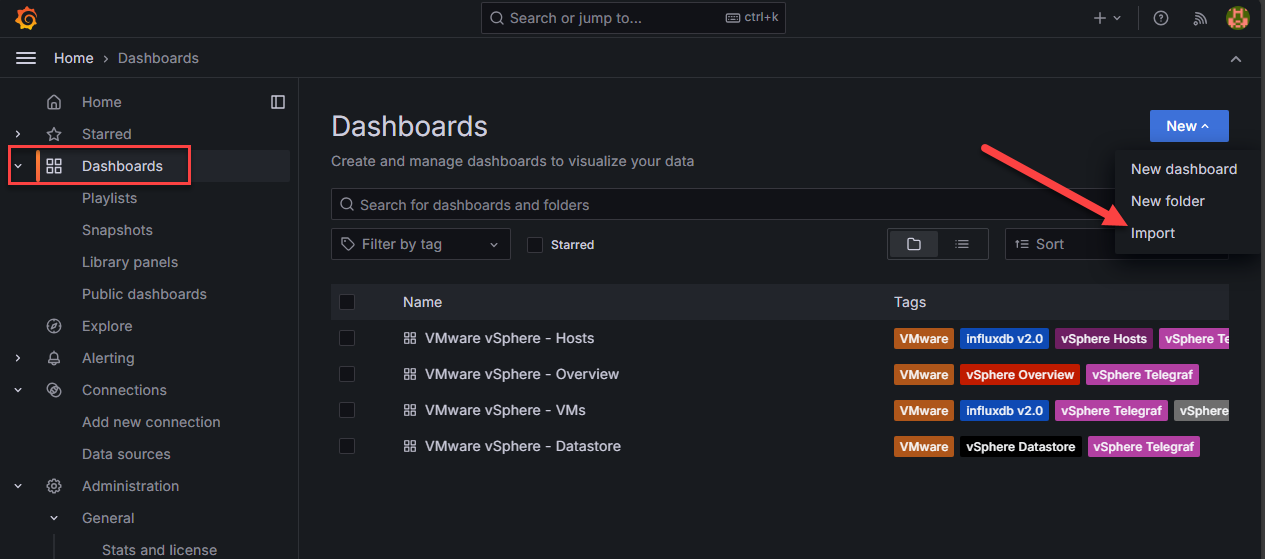
Grafana Dashboards
Jorge de la Cruz has done a lot of great work in creating VMware vSphere specific Grafana dashboards for the community. This takes all the heavy lifting out of creating dashboards manually using the InfluxDB data.
You can check out his Grafana dashboards here: Jorge de la Cruz Overview | Grafana Labs. The numbers of the dashboards we are interested in are the following: 8159, 8165, 8168, 8162
Importing the dashboards
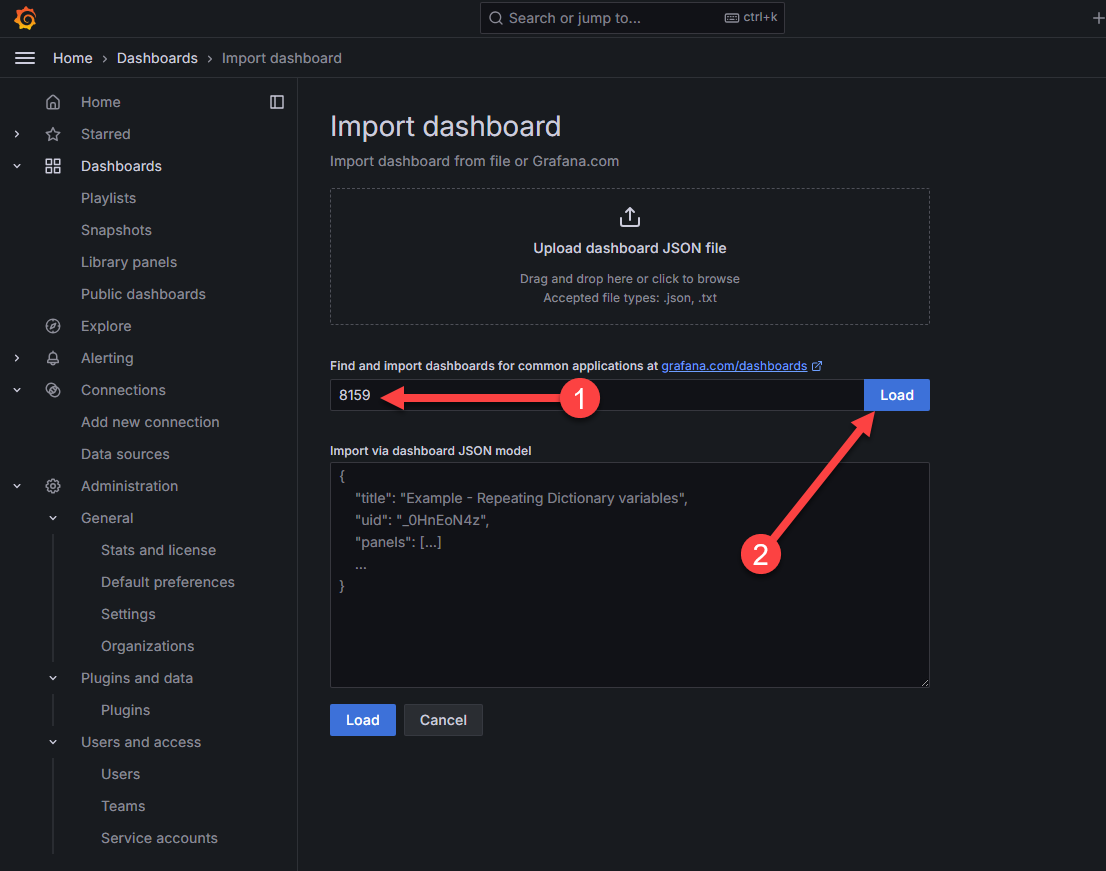
Now, let’s look at the process of importing the dashboards. Click on Dashboards > New > Import.
Now, we enter the numbers of the publicly available Grafana dashboards. Click Load.
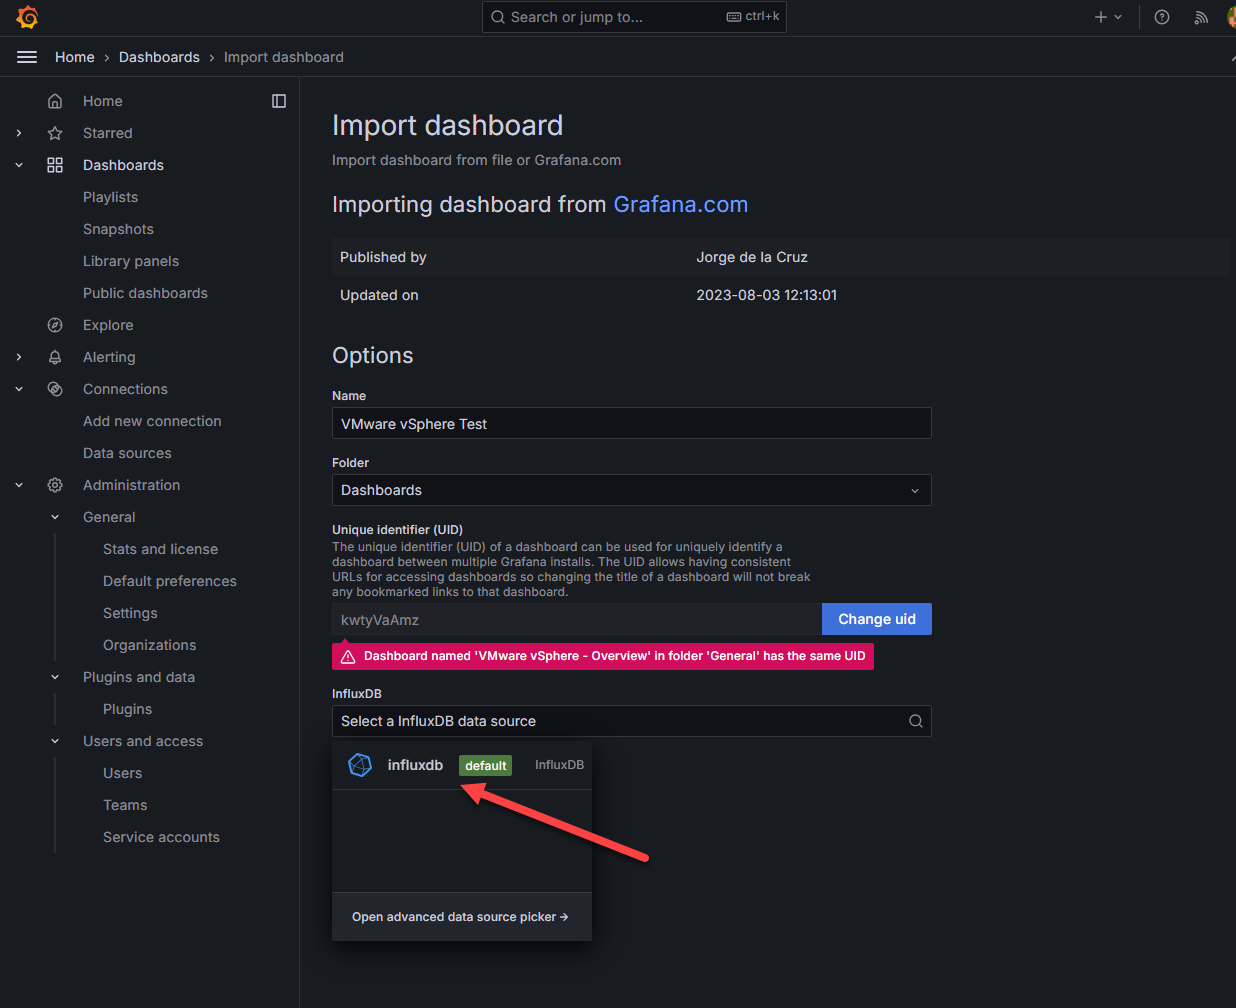
Below, I have already added the dashboard, so it is telling me it has one with the same UID. However, name the dashboard, and then select the source InfluxDB data source that we created in the Connections menu earlier.
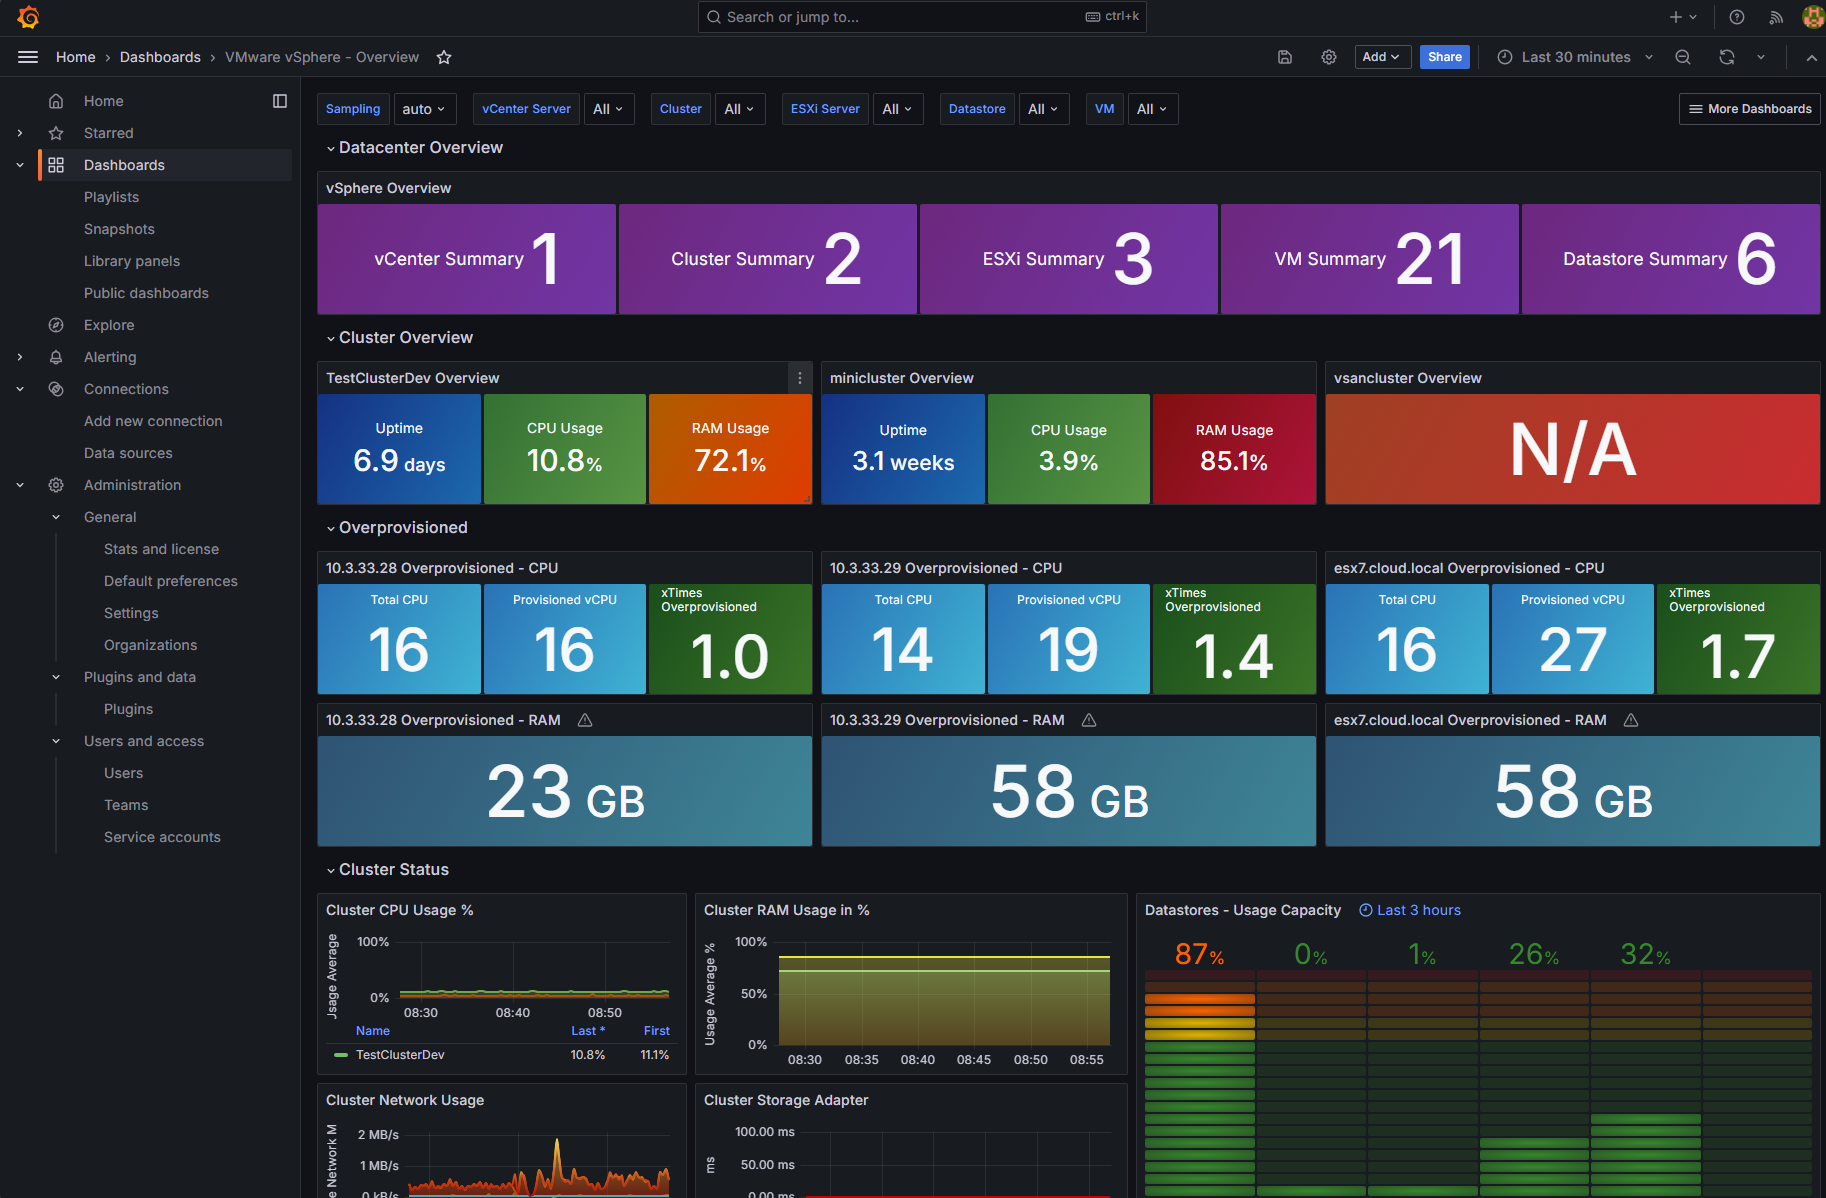
After importing the dashboard, we see beautiful Grafana visualizations of the InfluxDB data.
Troubleshooting
You may run into issues with the TICK stack to begin with. Check out my blog post linked above for troubleshooting specific to that aspect of the project. However, in general, look at the Docker logs to see any error messages you need to address, such as configuration file or permissions errors, as these two are very common.
If you don’t see any data coming into InfluxDB, you need to troubleshoot the connection from Telegraf to InfluxDB.
Grafana can also have its quirks. If you will notice in the Docker Compose code above, I have specified a user ID for running the container. Grafana is very picky about the user context the container is run under. So, if you run into permission issues with the container, play around with the user under which the container runs.
You can easily find the user ID in Linux using the command:
id -uWrapping up
While there are many great paid solutions for VMware vSphere monitoring, you can use a TICK stack and Grafana to have a great monitoring solution to help find problem areas in the environment and view performance metrics for various components, including vCenter Server, ESXi hosts, virtual machines, CPU, RAM, and network. Let me know if you are using a similar approach to VMware monitoring in your home lab or even production.
More in this topic


Discuss this in the Community
Google is updating how articles are shown. Don’t miss our leading home lab and tech content, written by humans, by setting Virtualization Howto as a preferred source.
About The Author

I’ve had a look here https://github.com/influxdata/telegraf/blob/master/docs/CONFIGURATION.md so see if there are any metrics related to the state or properties of virtual machines. For instance, if the virtual machine is powered off or whether the virtual machine contains snapshots (number of snapshots, for example), but it doesn’t seem to support that. Do you happen to know if telegraf offers such metrics?
Cretin,
Thank you for the comment! I will have a look into this. There is probably other ways to grab this with telgraf most likely.
Brandon