vRealize Operations Manager Dashboards Adding and Customizing
If you have access to vRealize Operations Suite, it is an awesome product to have running in your vSphere environment. With vRealize Operations Manager, you have a tremendously powerful tool to keep an eye on your vSphere environment. With vRealize Operations manager, it displays information about your environment based on dashboards. There are many great dashboards that are included by default with vROPs. However, in this post, we will take a look at vRealize Operations Manager dashboards adding and customizing to see how you add your own custom dashboards as well as customize the ones you have already.
What is vRealize Operations Management?
In case you are not familiar with vRealize Operations Management or the vROPs suite, it is a operations management platform for private, hybrid, and multi-cloud environments in a very powerful, AI-driven platform. It provides full visbility into your entire stack. This includes physical, virtual, and cloud infrastructure. New with vROPs 8.2, this includes full visibility not only into virtual machines, but also containers.
With vROPs you can get the entire picture of your infrastructure so you can have a full view of performance, capacity, and all the tools and visibility you need to troubleshoot an issue in your environment. It is available in either an on-premises variant or a SaaS offering.
Having the right information is absolutely crucial. I have worked in many different vSphere environments over my career. Having vROPs in play always makes the job of managing and troubleshooting a vSphere environment much easier.
The vROPs dashboards display all kinds of information such as performance metrics and other relevant KPIs.
You can define super metrics. What are super metrics? According to VMware: “The super metric is a mathematical formula that contains one or more metrics or properties. It is a custom metric that you design to help track combinations of metrics or properties, either from a single object or from multiple objects. If a single metric does not inform you about the behavior of your environment, you can define a super metric.”
Dashboards can contain information about:
- ESXi hosts
- vSphere clusters
- Datastores
- Networking
- Performance
- Public cloud environments
Dashboards generally provide information for the selected object based on a refresh interval of time where information is presented near real-time.
VMware vRealize Operations Manager can help you with all kinds of other objectives in your environment such as:
- Security
- Compliance
- Multi-cloud
Adding Built-in Predefined Dashboards to vRealize Operations Manager
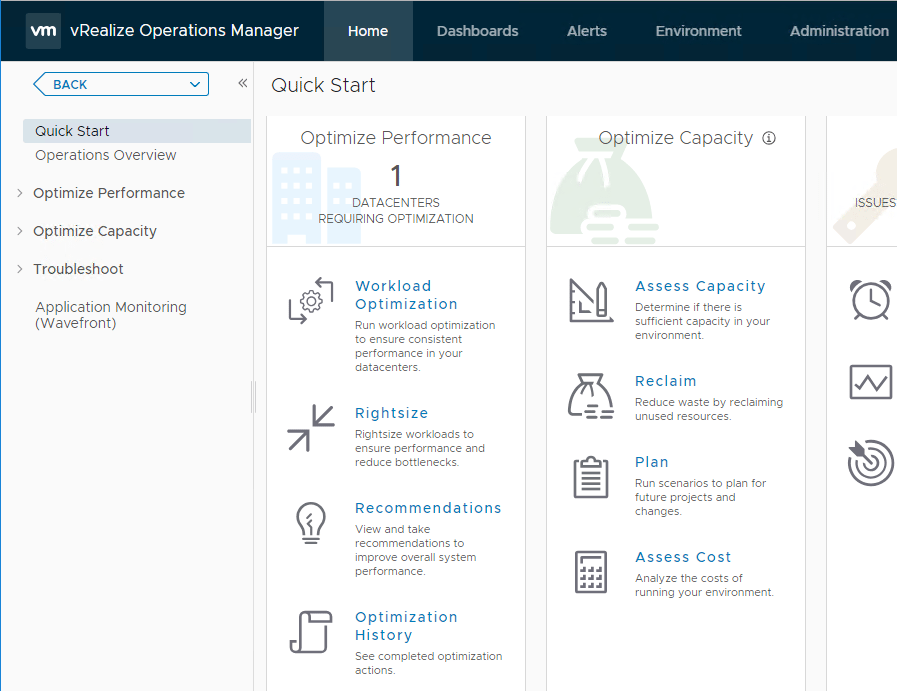
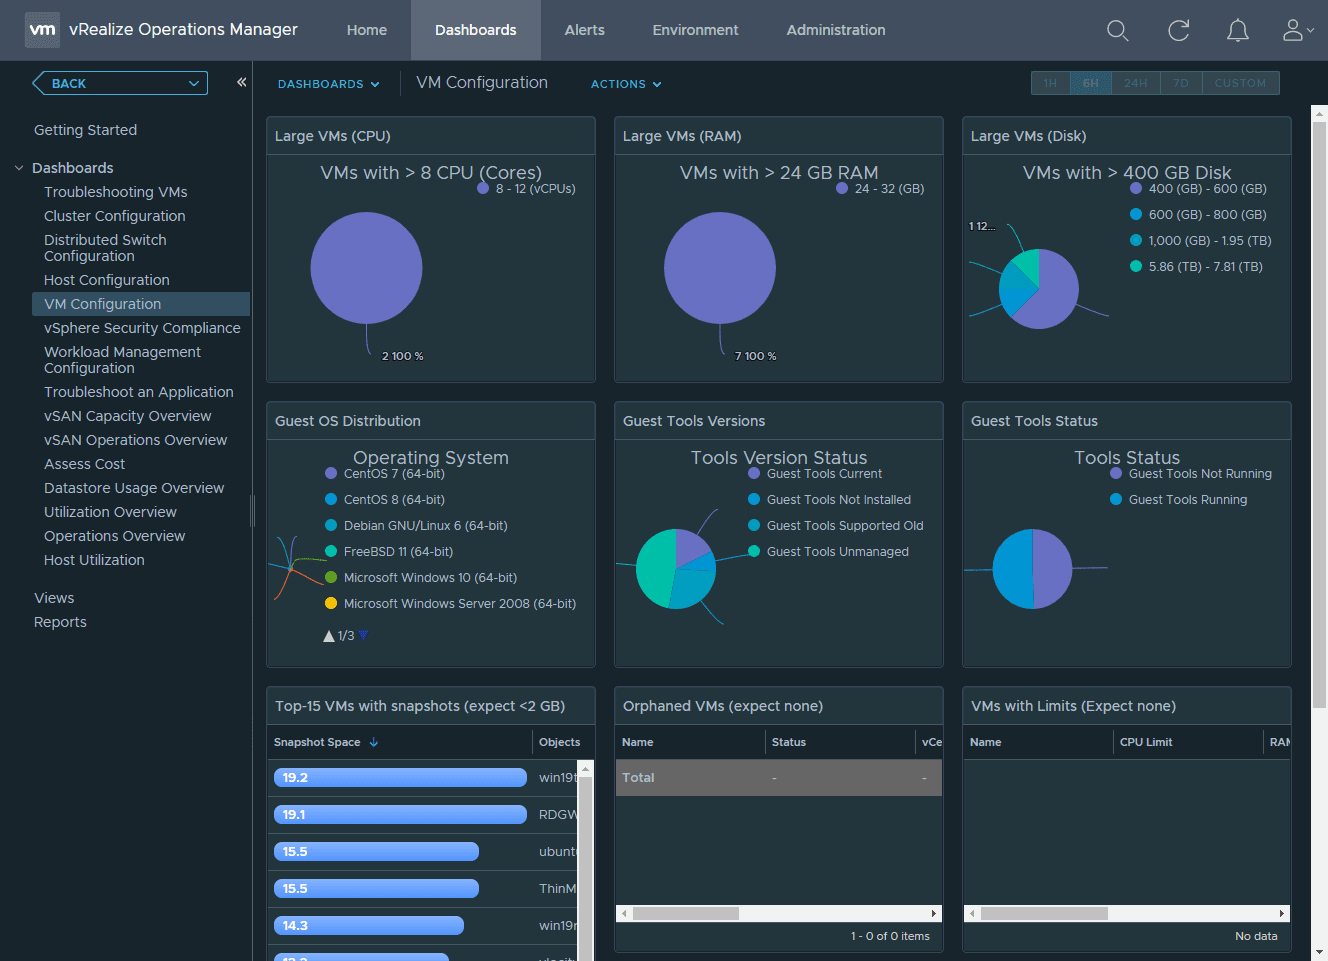
Let’s first take a look at how easy it is to add a built-in, predefined dashboard to your vROPs installation. By default, out of the box, vROPs will present you with a few default dashboards. If you are running vSAN, you will see the vSAN Capacity Overview and vSAN Operations Overview as an example.
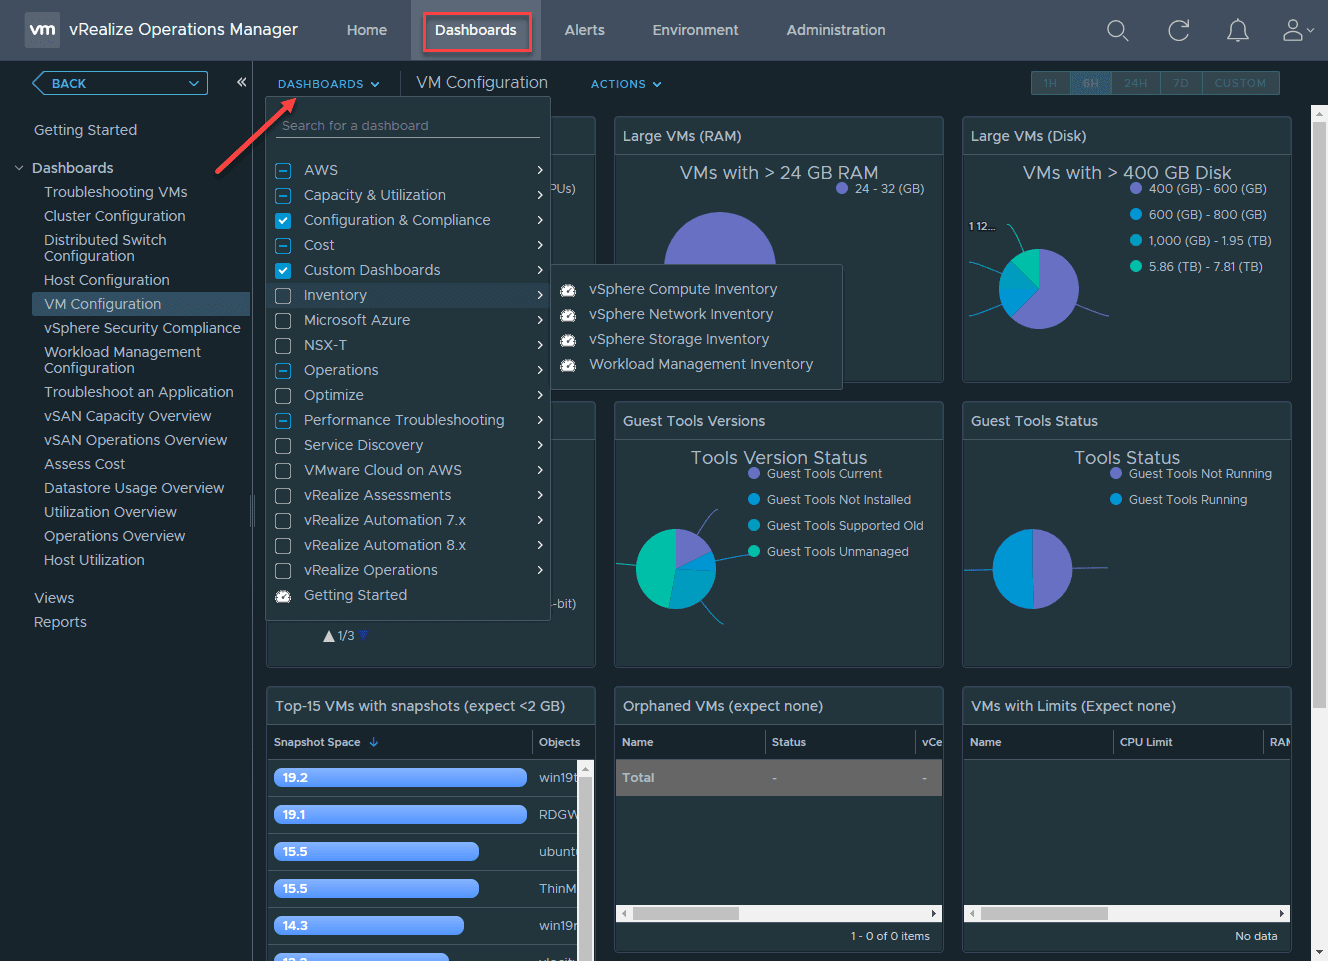
However, there are many more dashboards that can be added right out of the box to your installation. Simply click the Dashboards menu and then select Dashboards dropdown and you will see the full list in a cascading menu format. You can add many other additional dashboards. This includes other cloud environments and technologies such as:
- AWS
- Inventory
- Microsoft Azure
- NSX-T
- VMware Cloud on AWS
Where to find custom vRealize Operations Manager Dashboards
You may wonder where you can easily find good vRealize Operations Manager dashboards. Actually, there is a readily available repository of great vROPs dashboards that others have already created and tweaked for download.
This is the VMware Code Sample Exchange. Here you will find many different types of code snippets available for download. If you search for vROPs, you will see an entire listing of downloadable dashboards that you can import into your vROPs environment.
The custom dashboard that I am adding below is the Troubleshooting VMs dashboard by @bpatvmware – Brock Peterson. It is awesome (hats off to you Brock). There are many other great vROPs dashboards that can be highly useful in your environment. Again, these are freely available dashboards you can download to extend the functionality of your vROPs environment.
Adding Custom vRealize Operations Manager Dashboards
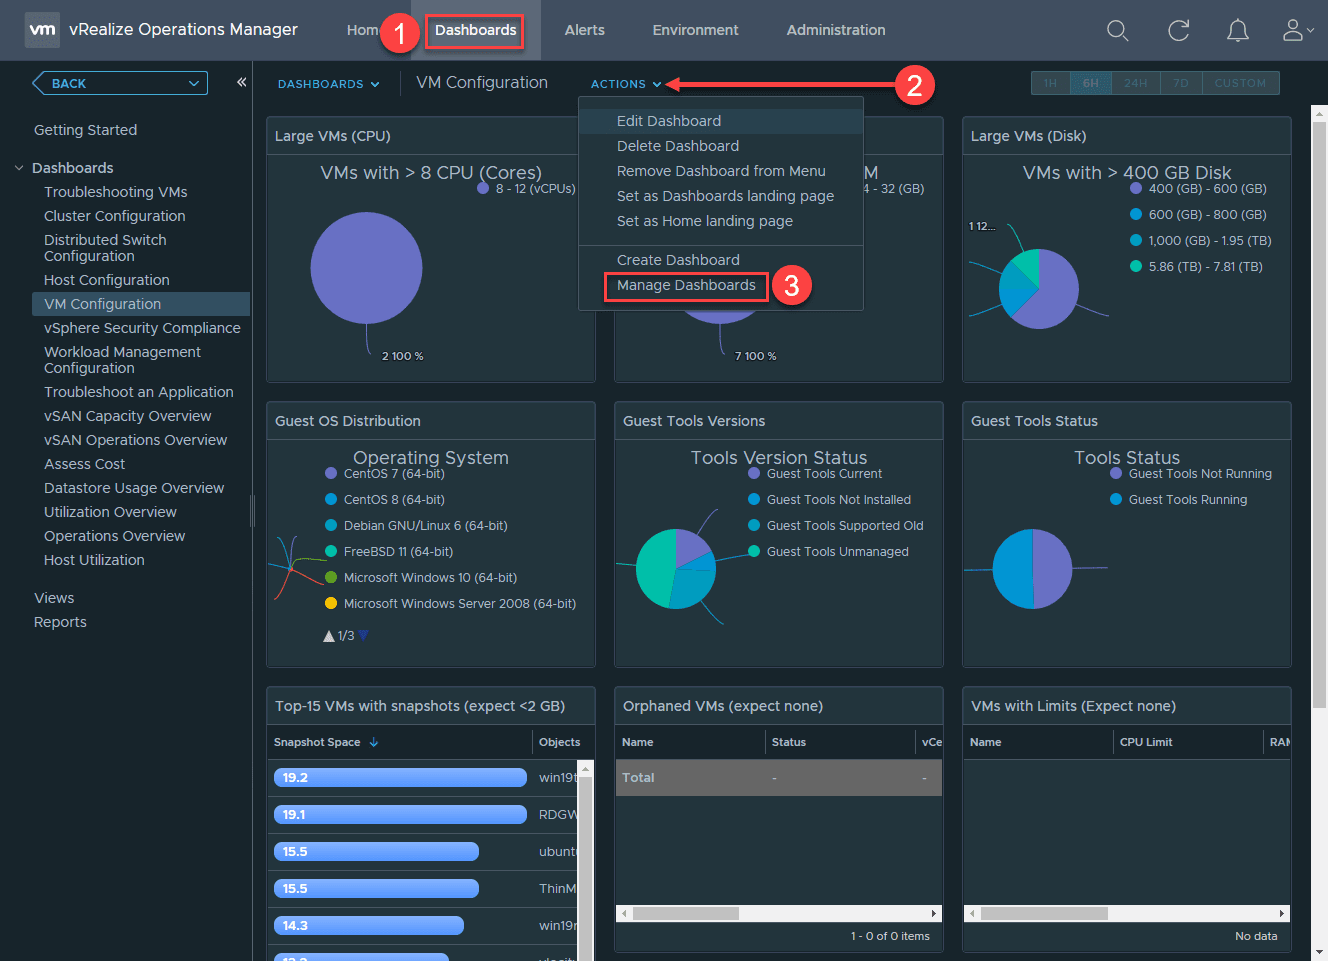
To add a new dashboard to vROPs, click the Dashboards menu > Actions > Manage Dashboards.
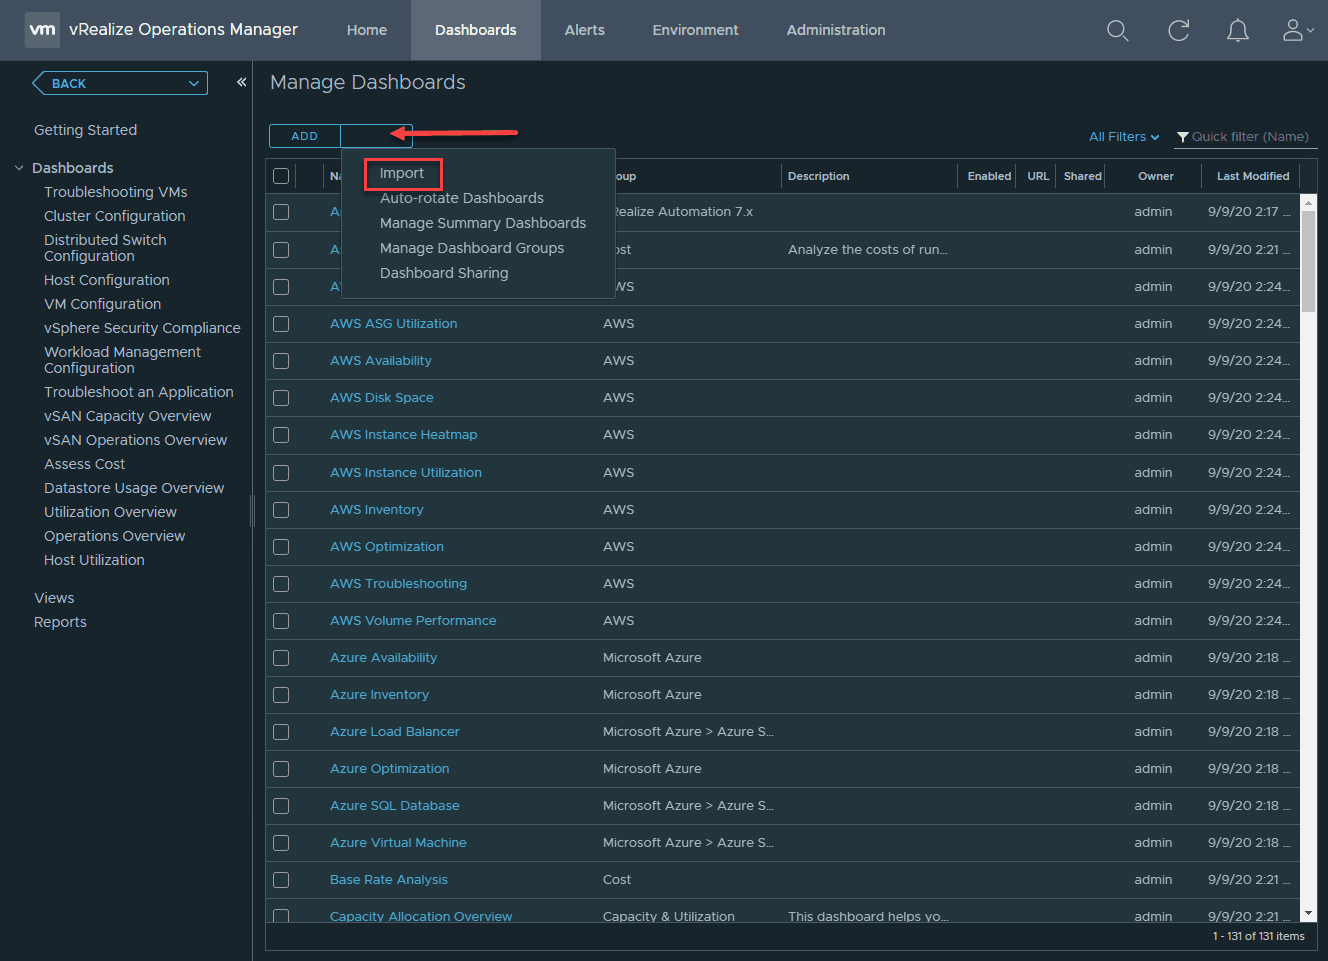
This will open the Manage Dashboards screen. Click the button next to Add. Select Import.
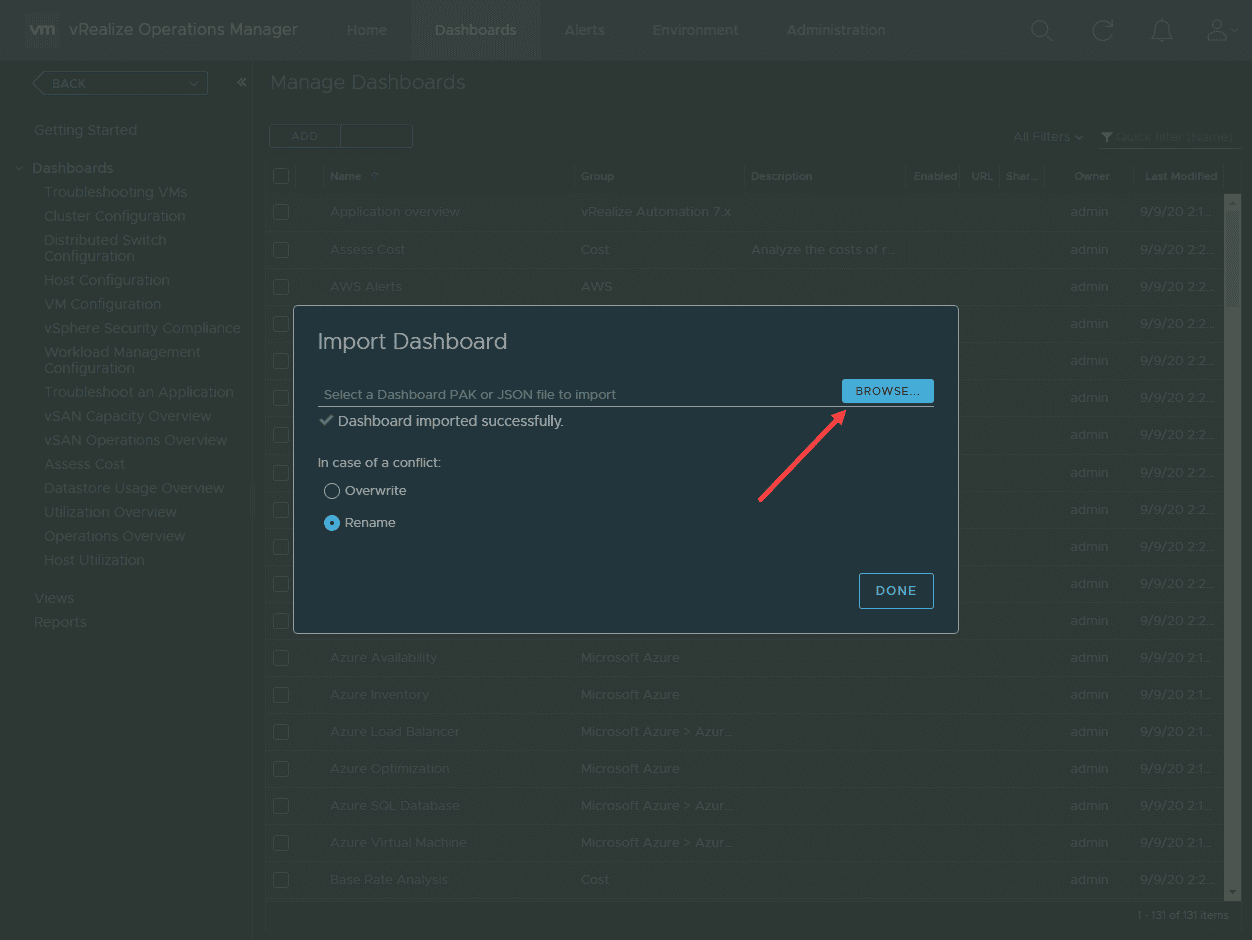
This will open a dialog box that allows you to browse your computer, select the JSON or PAK file to import. You can also choose the overwrite behavior if the dashboard already exists. Click Done when you have configured your desired options.
Customizing vRealize Operations Manager Dashboards
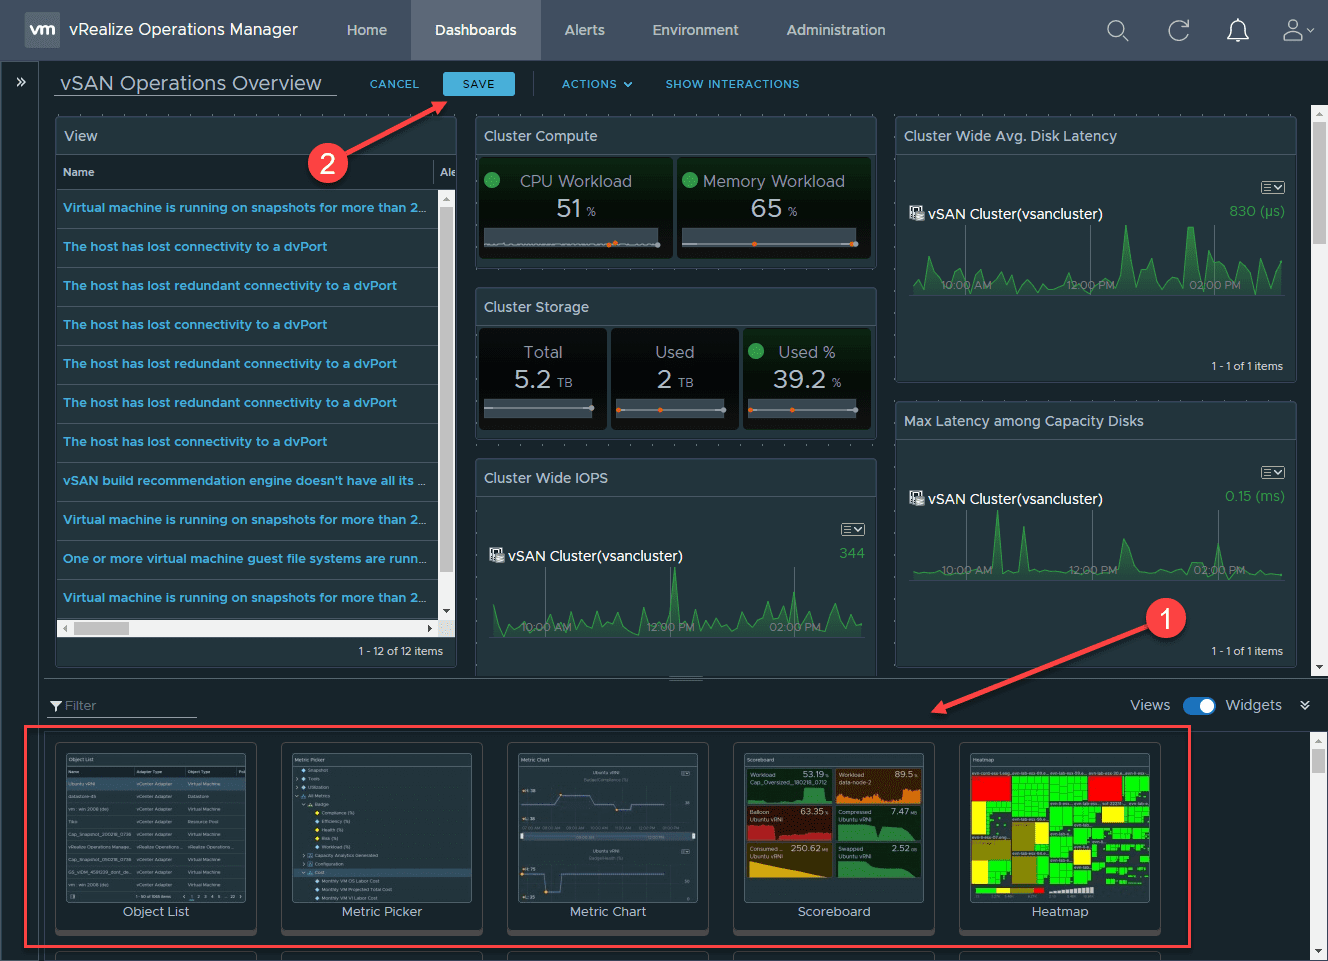
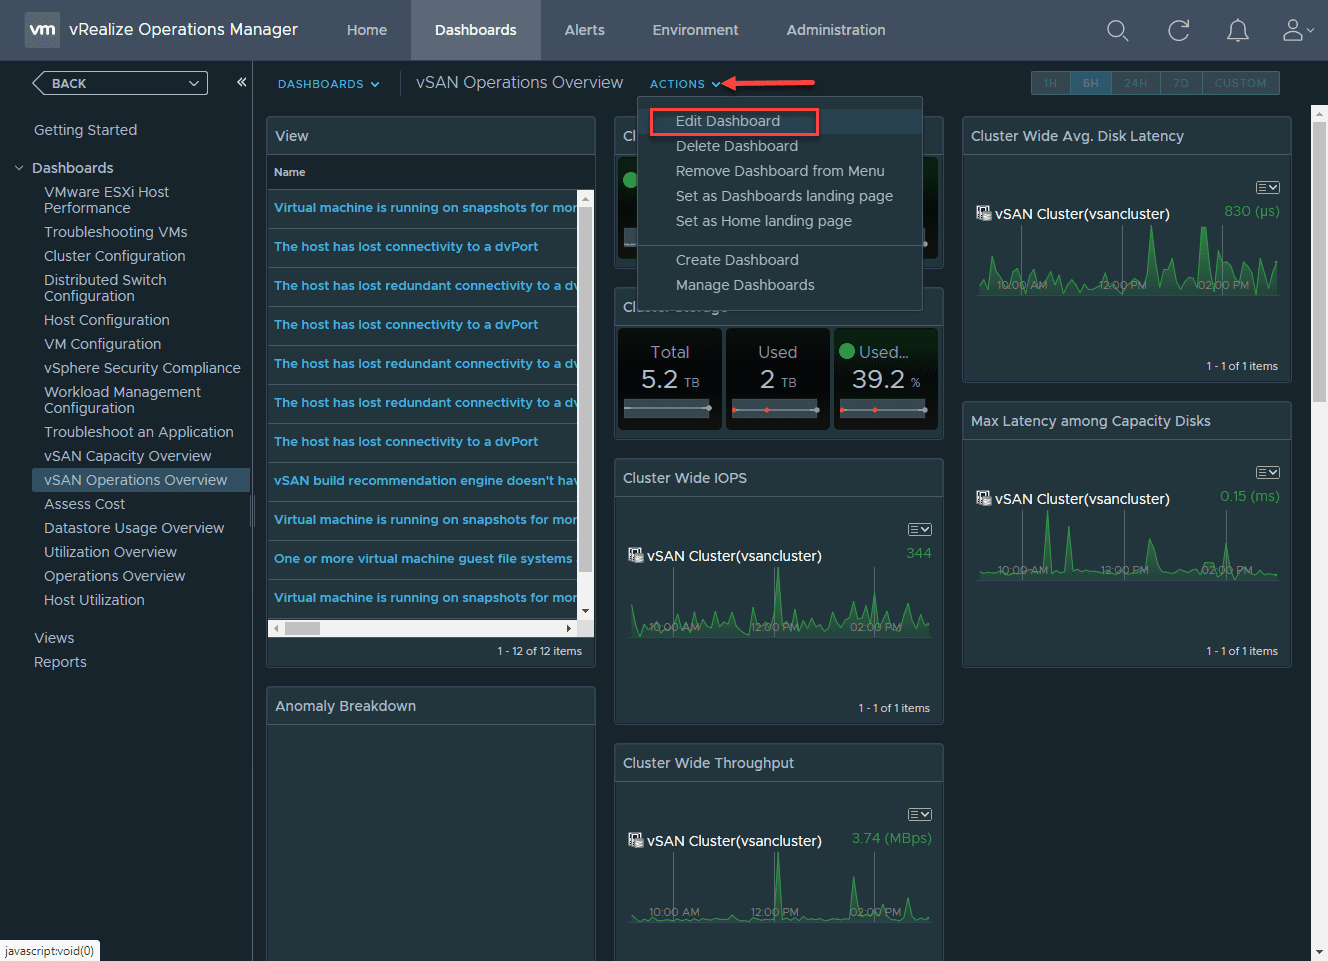
What if you want to take a dashboard that already exists and simply add a widget or view to the dashboard? You can do that too. When you have an existing dashboard pulled up, simply click the Actions drop down and select Edit Dashboard.
This will bring up the widgets and views popup at the bottom of your screen. At this point, simply double-click on the widget or view you want to add. Once added, click the Save button at the top of the dashboard.
Wrapping Up
I am a huge fan of vRealize Operations Manager. If you have it and haven’t really explored the ability to add and customize dashboards as of yet, vRealize Operations Manager Dashboards Adding and Customizing adds a tremendous amount of functionality and capabilities to your vROPs platform, especially for vSphere.
With the freely available dashboards that are found on the VMware Code Samples Exchange, you can find literally hundreds of dashboards that can be added. Why reinvent the wheel? Most likely if you find that you have a need for a certain view or type of information, someone else may have already had the same thought. It is worth looking at least before creating your own dashboard from scratch.