NetCrunch Network Monitoring Service Review
As your IT infrastructure grows more complex and spans across various networks, devices, and applications, monitoring is a critical aspect of managing your environment. There is simply no way to effectively monitor and manage today’s complex topologies and hybrid infrastructure using only manual efforts.
Using an effective monitoring solution is key to being able to monitor complex IT infrastructure in a capable and effective manner. There are many monitoring solutions on the market that do many different things. However, I would like to introduce you to an extremely powerful monitoring solution that, if you have not heard of, you need to know about. It is called NetCrunch by Adremsoft.
In this post, we will take a look at the NetCrunch Network Monitoring Service Review and see how it can be used to effectively monitor your environment.
What is NetCrunch?
NetCrunch network monitoring service is built on the concepts of two basic principles – performance metrics and events. It makes use of what NetCrunch calls Monitoring packs and policies. A monitoring pack is applied to a specific type of device such as a Windows Server.
Recommended best practice metrics are automatically included in the specific monitoring pack being used so that you can easily apply those recommended monitoring metrics across all similar devices in the environment. This helps to rapidly get monitoring stood up across your devices.
NetCrunch monitoring is agentless so you don’t have to worry about deploying and managing agents as well as lifecycle management of those agents.
What types of monitoring can NetCrunch do? The following types of monitoring can be performed by NetCrunch:
- SNMP
- Switch and routers
- Operating systems and servers
- Network services & applications
- Network traffic
- Logs
- Hardware and software inventory
- Custom, advanced, and multi-vendor monitoring
NetCrunch Console – Monitoring and Alerting
NetCrunch makes use of a server install as well as the NetCrunch Console. The NetCrunch Console is where you interface with the NetCrunch server. These can be installed on the same server or can be separated between the server and management workstations.
The information displayed in the NetCrunch console is presented in an easily consumable and intuitive way. The dashboards are beautiful and provide all the relevant information you may need at your fingertips in a way that is easily consumable.
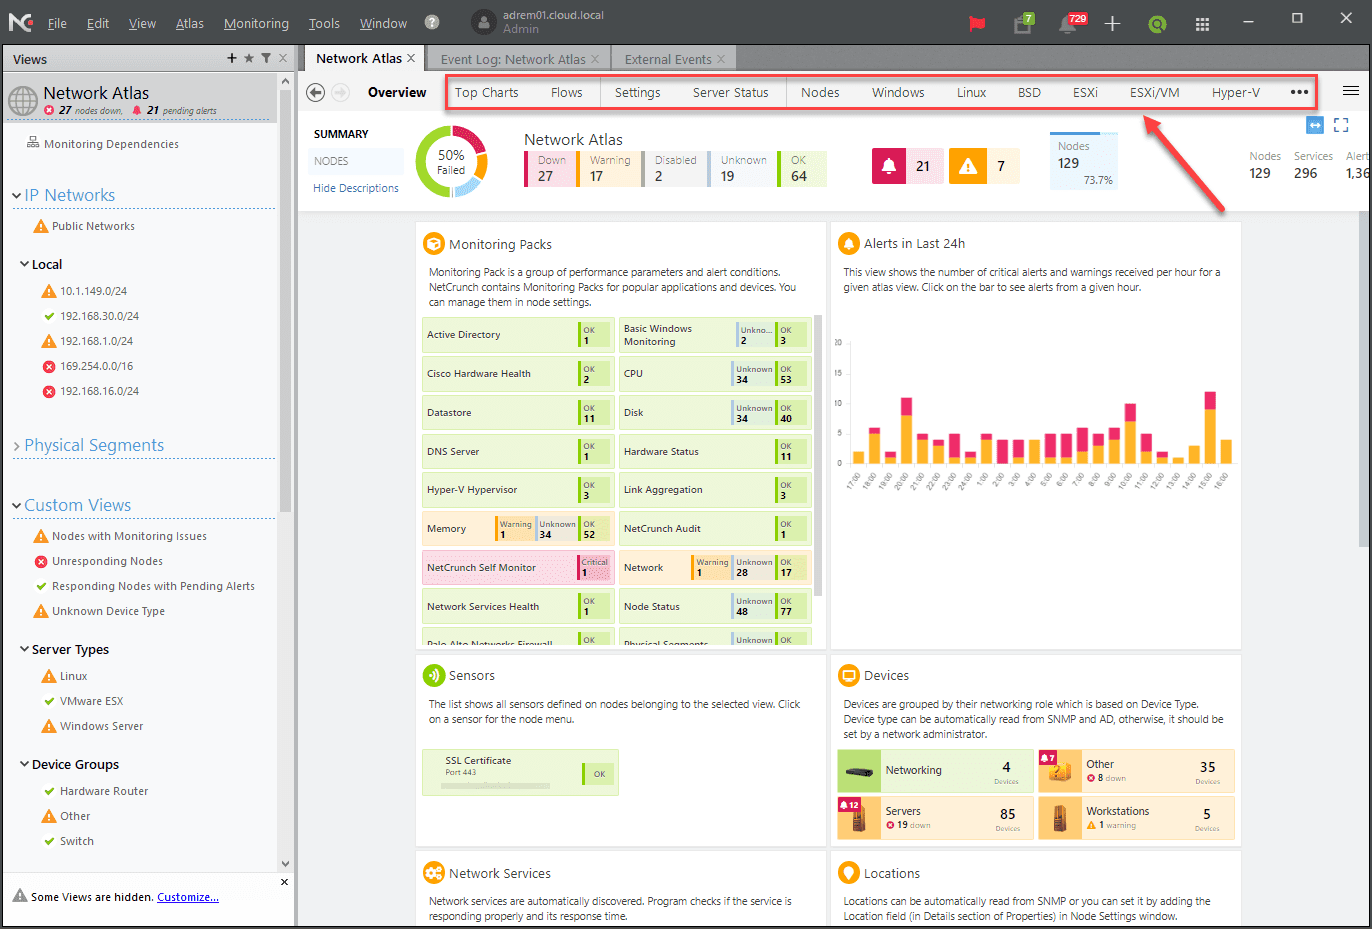
The Network Atlas is the overall dashboard displaying key performance indicators and any problems you may have in your environment. The NetCrunch Console uses a combination of graphs and colors to help make problem areas stand out.
The NetCrunch console provides a nice “tabbed” experience along with relevant menus at the top that allow quickly keying in on particular types of devices, networks, and resources in the environment.
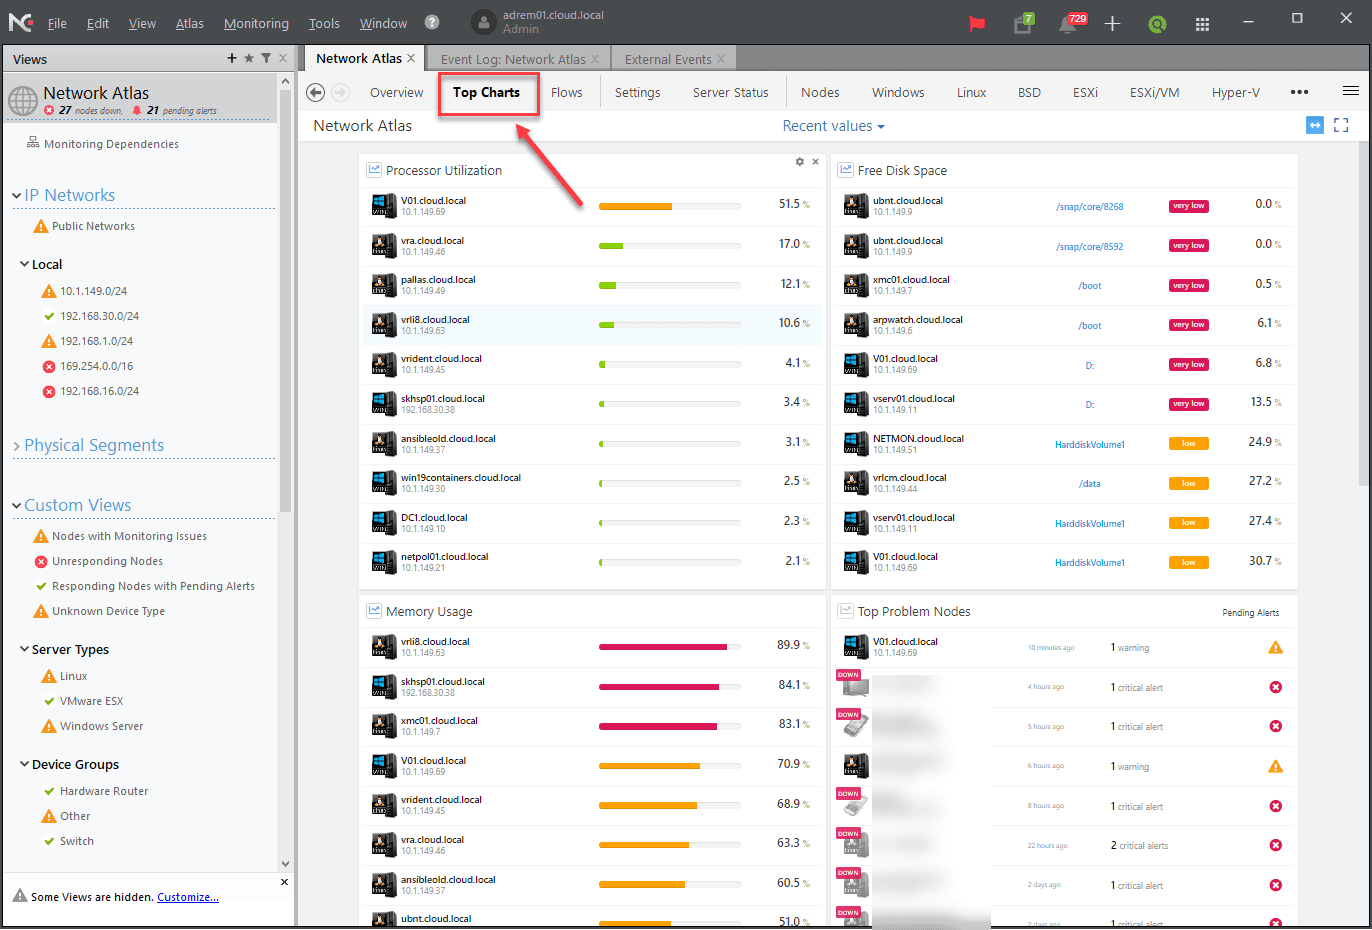
A really helpful view in the Network Atlas is the Top Charts view. Top Charts allows easily seeing problem nodes in the environment based on consumed resources. It creates views of Processor utilization, Free Disk Space, Memory Usage, and Top Problem Nodes (by downs detected). They are arranged in descending order with the nodes with the fewest resources at the top of each list. This is a great way to quickly see potential problems and makes prioritizing troubleshooting much easier.
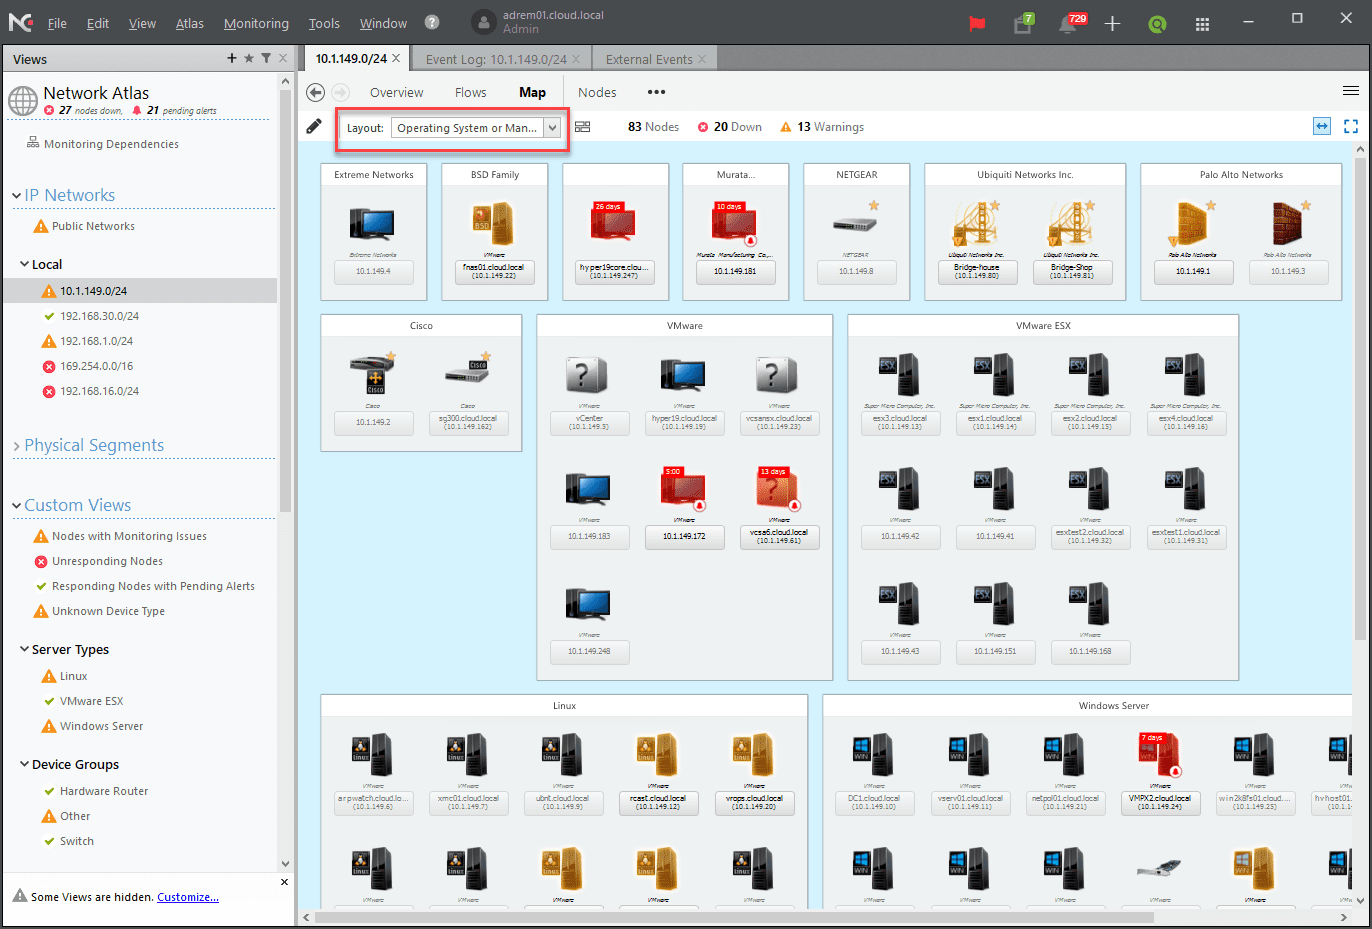
Another view of the NetCrunch Console that makes seeing “like” devices very easy is the Operating System or Manufacturer view in the Map tab. This view groups similar devices such as Windows Servers, VMware hosts, Linux servers, etc.

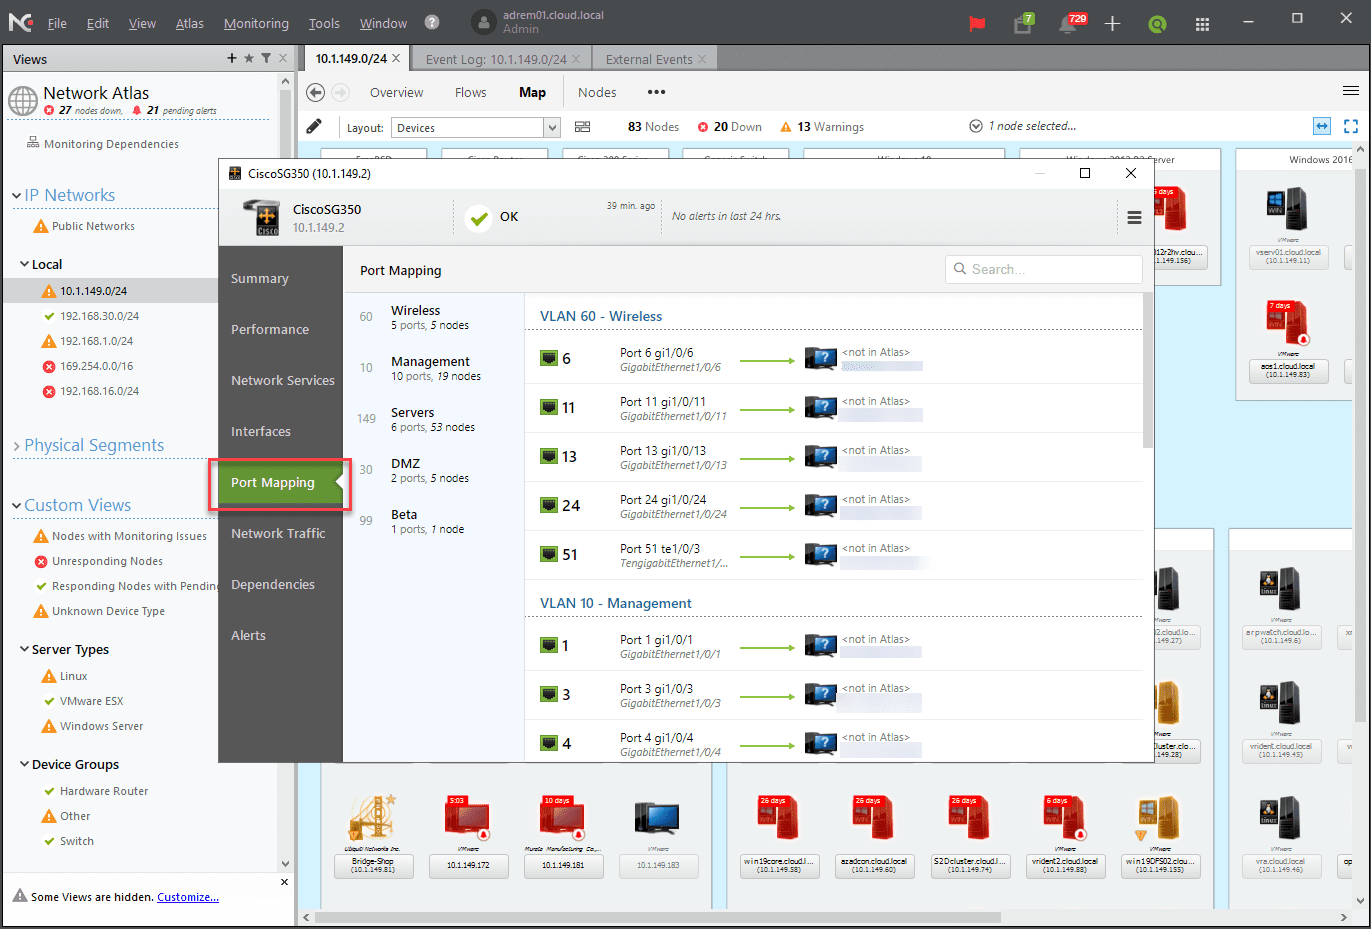
An extremely cool feature that can come in handy when troubleshooting network issues or simply trying to map out which devices are uplinked where is the Port Mapping feature. With port mapping, it shows which MAC addresses are mapped on which interfaces.
NetCrunch then correlates whether or not it these MACs match a discovered node that is already being monitored by the system. This is a powerful feature that makes visually mapping out the network and understanding uplinks, connections, and packet flow, much easier.
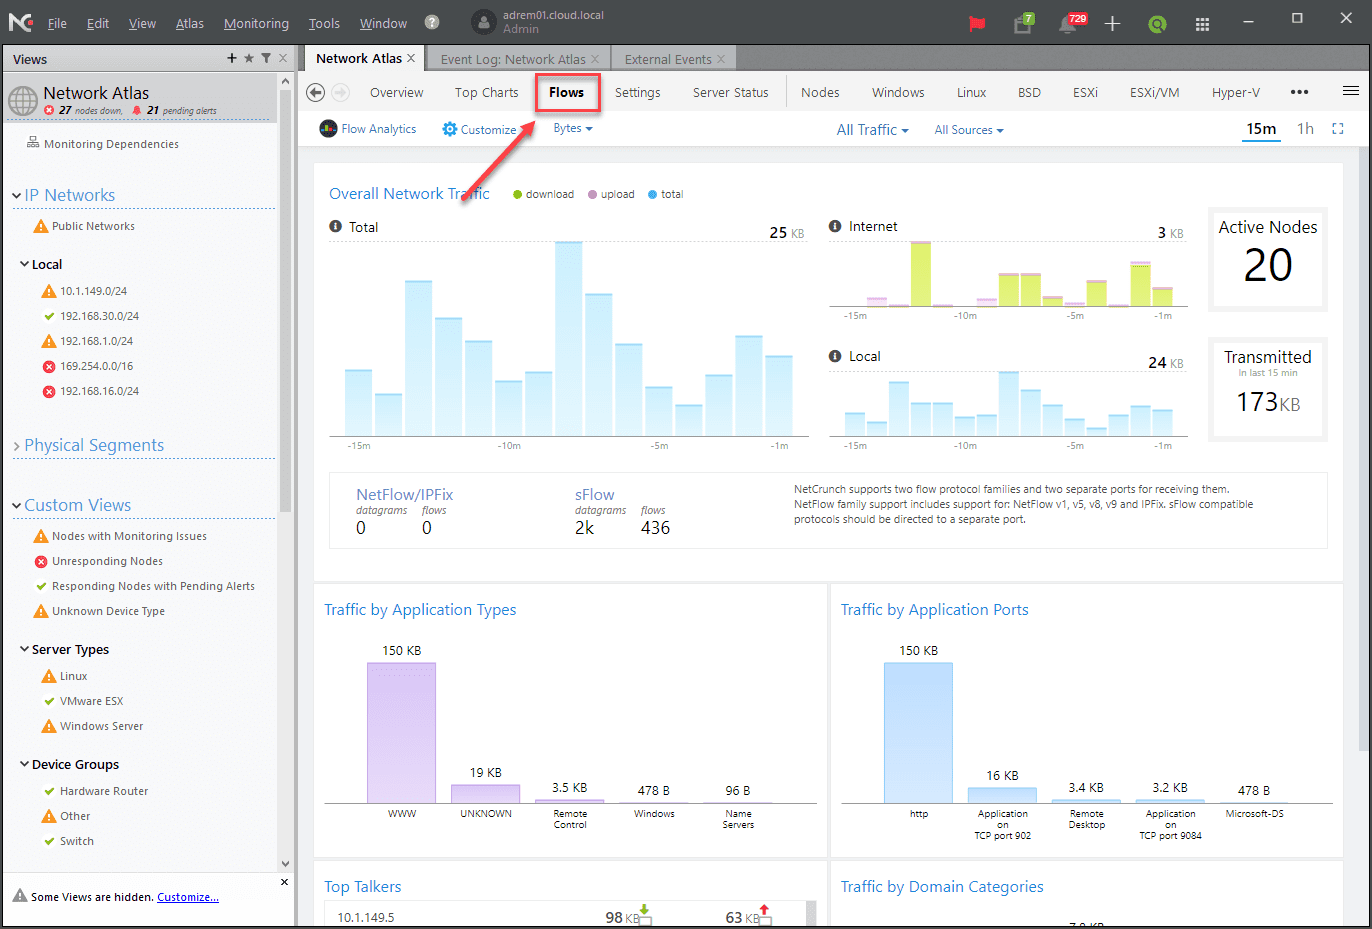
The Flows tab under the Network Atlas view shows real-time traffic flows based on SNMP data polled from network switches. This allows you to see applications, ports, top talkers, and overall network traffic.
Simplified Alerting
Using both the Monitoring packs and policies as well as alerting scripts, NetCrunch can easily be deployed quickly and easily to monitor environments with even hundreds of nodes. One of NetCrunch’s strong suits is accurate alerting. By default, NetCrunch alerts are setup by default to help prevent false positives.
NetCrunch has a concept they refer to as alert correlation. When the condition that was causing the alert clears, the event is correlated and the alert is automatically closed. This helps you to know which alerts need your attention. Alerts that are in the open state are truly items that may need your attention. This prevents you from having to filter through a multitude of alerts to determine whether or not the alert is still valid.
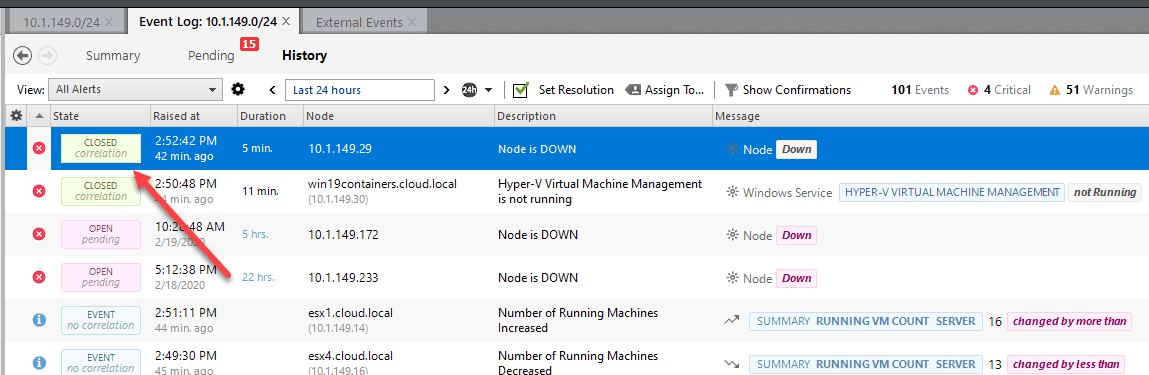
Advanced Correlation allows you to correlate alerts that happen on a predetermined group of devices. When a specified number of alerts happen on a particular group of monitored nodes, you can alert on this condition specifically.
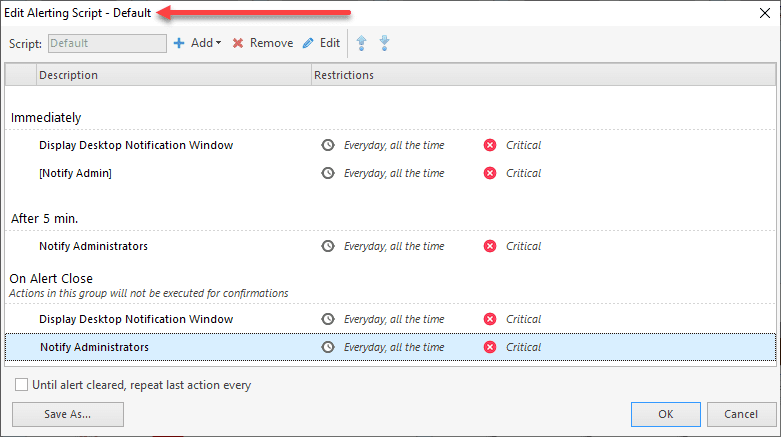
Alerting Scripts allow creating a “playbook” of sorts of how your alerts will fire off. This includes the order of alerting, which alerts, and the criticality of the alerts. You can also determine whether or not you want NetCrunch to keep repeating the alerts until they are cleared. This may be desirable for extremely business-critical systems that you want to receive a lot of noise from if there are any failures.
Impressions of Using NetCrunch
In this NetCrunch Network Monitoring Service Review – NetCrunch is a great monitoring solution that provides many powerful features for monitoring, visibility, and alerting in your environment. The NetCrunch Console presents alert information in a way that makes spotting issues extremely easy. Compared to other monitoring solutions, with NetCrunch, you do not have to search through lists of alerts to see the current issues. With alert correlation, you can easily see which issues still need attention and those that have already been resolved.
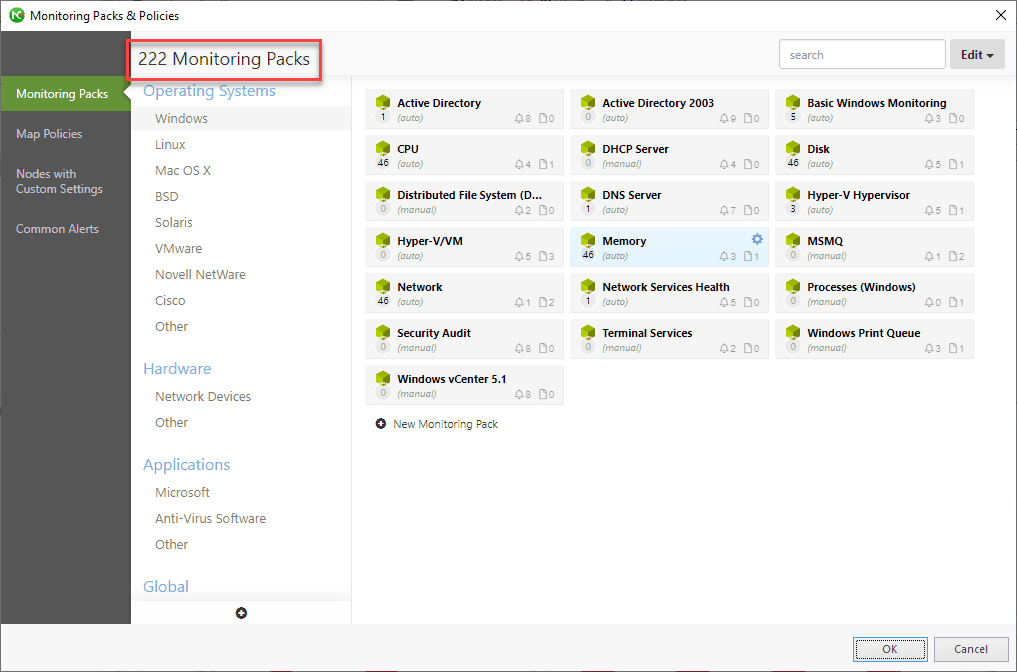
With the monitoring packs and policies, setting up monitoring on even large environments is easy. NetCrunch has hundreds of prebuilt monitoring packs for most of the common devices found in the enterprise. These packs already include best practice values to use in monitoring.
You can download a fully-featured 30-day trial version here.