One of the words that we typically hear a lot in the IT industry especially when thinking about configurations of hardware and software is “best practices”. It is certainly important to make sure we configure our software and hardware according to vendor best practices. After all, they know their hardware and software better than anyone. The challenge with that is that best practices are really a moving target. When vendors discover new issues, security holes, or things that impact performance in certain environment configurations, those best practices can change. Recommended configurations can change. Recommended software patches and updates can all change. Staying on top of all of those moving changes can keep an administrator busy to say the least. When thinking about our VMware environments, there are certainly best practices that need to be considered. In case you have not heard of Runecast Analyzer, this product completely automates and alleviates the challenges with staying up with VMware best practices and security compliance. It is a very impressive product that is a game changer in this space. We automate everything else – why not automate our best practices analysis? Let’s take a look at how to Automate VMware Best Practices with Runecast Analyzer
Automate VMware Best Practices with Runecast Analyzer
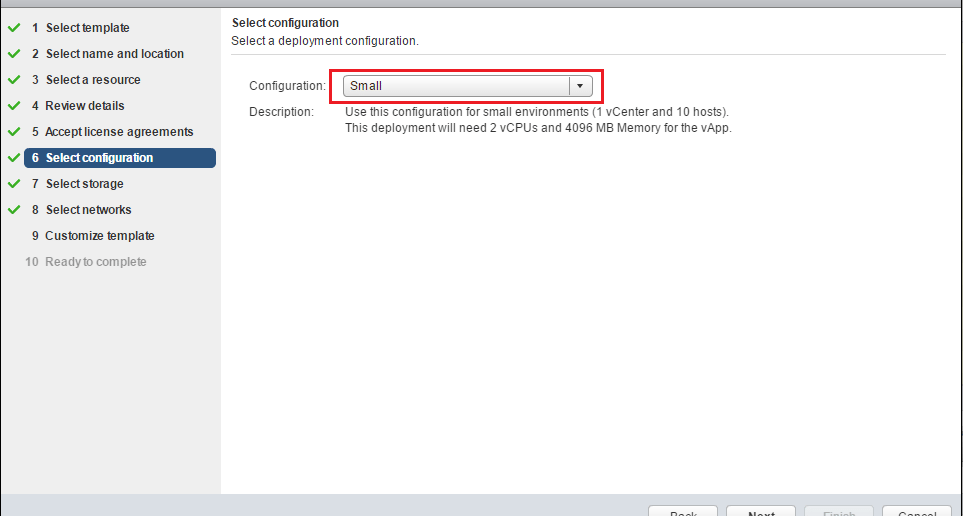
The deployment of the product is super easy and intuitive. The relatively small Runecast OVA appliance makes it super easy and intuitive to import and spin up the virtual appliance that runs Runecast Analyzer. Below the Deploy OVF Template wizard is the standard process that you would expect. However, I wanted to highlight an area below. In the select configuration you can size the OVA template according to the size of your environment. The description details supplied by Runecast during the install are as follows:
Small – 1 vCenter and 10 hosts
Medium – 5 vCenters and 100 hosts
Large – lots of vCenters and throng of hosts
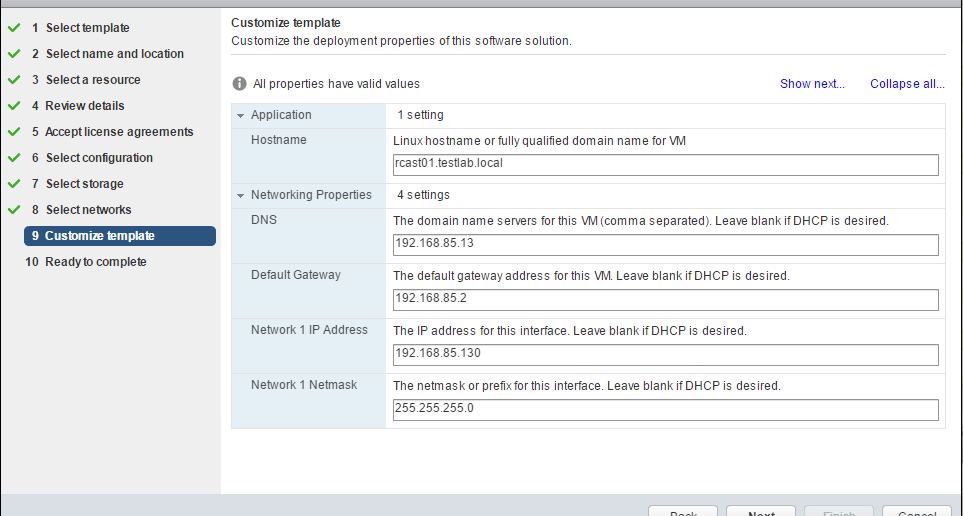
Of course, important is our network configuration. During the wizard, we can customize the hostname, DNS, network address, etc.

Initial Configuration
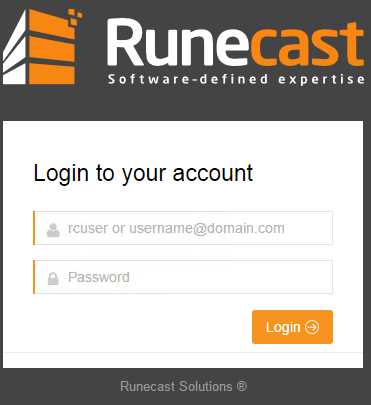
Once the OVA template is deployed and powered on, the Runecast Analyzer is quick to boot and is accessible via IP/hostname via a regular port SSL connection. When you navigate to the web URL, we are presented with the Runecast login dialog box. The default username and password here are:
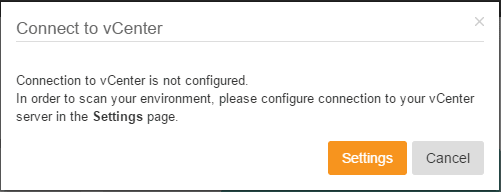
The first thing that we are prompted to do is to integrate our Runcast Analyzer installation with vCenter Server. Click the Settings button to get started.
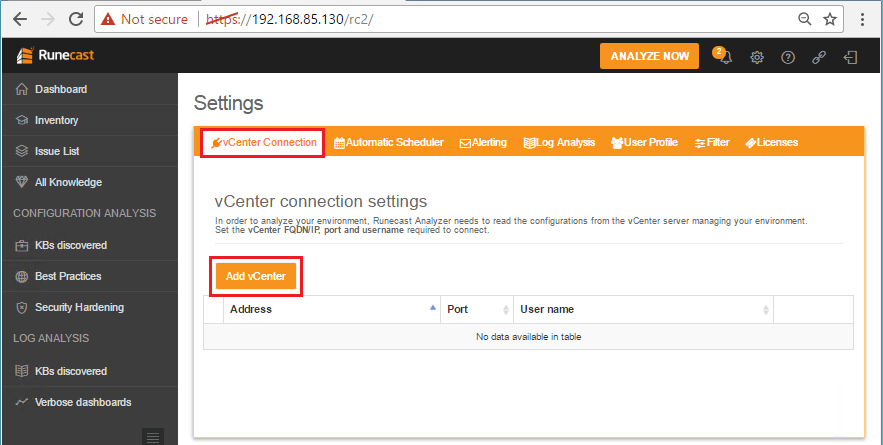
Under the Settings section vCenter Connections we can click the Add vCenter button to add the IP/DNS name of our vCenter Server.
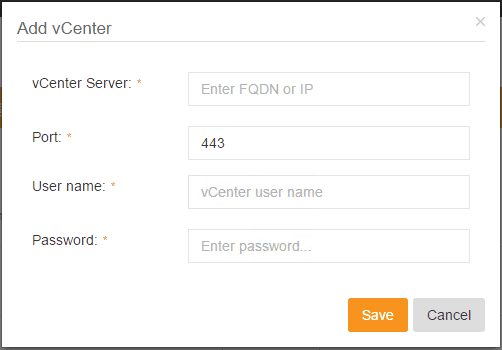
Under the Add vCenter configuration we add the address of our vCenter Server as well as the username and password to authenticate.
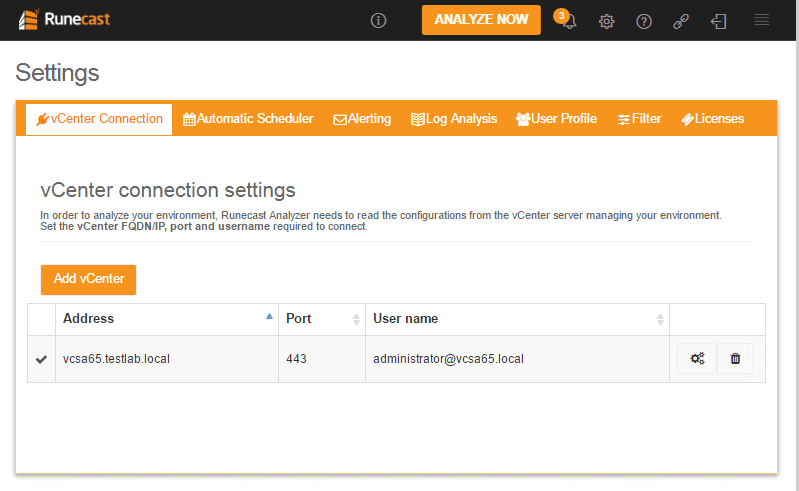
Below, we have added our vCenter Server connection.
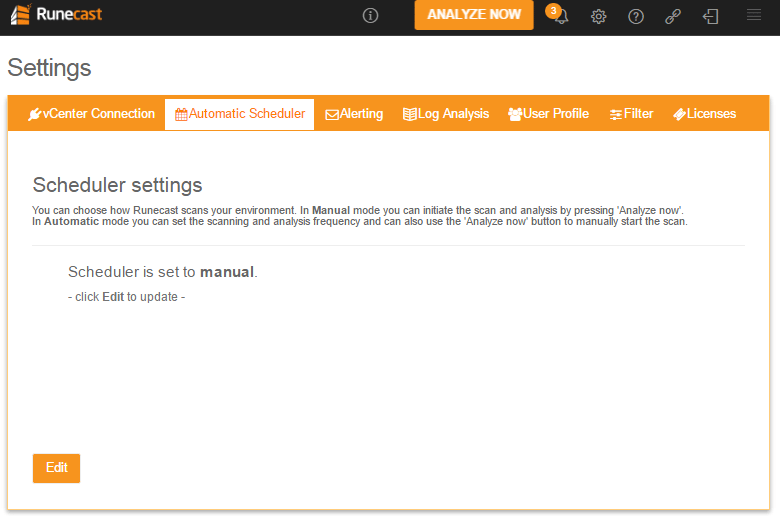
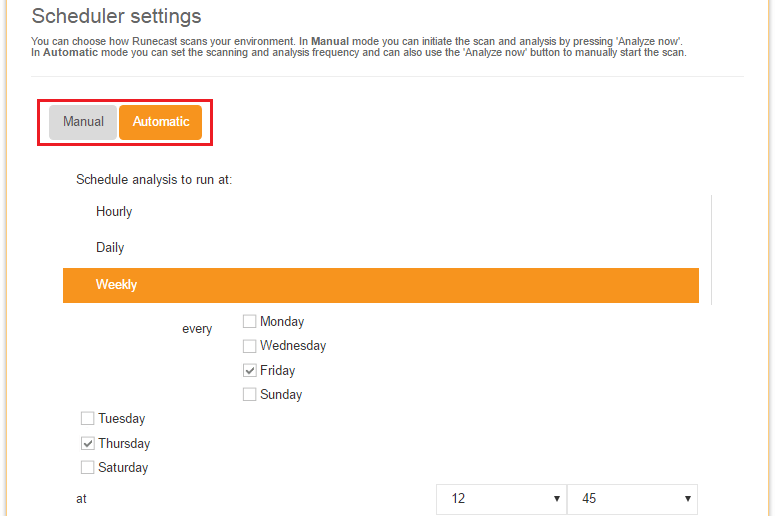
The next tab, Automatic Scheduler, allows us to choose whether we want the Analysis scans to run automatically or manually. We can click Edit here to set the configuration. If we choose to run it automatically, we can schedule the time of the analysis runs.
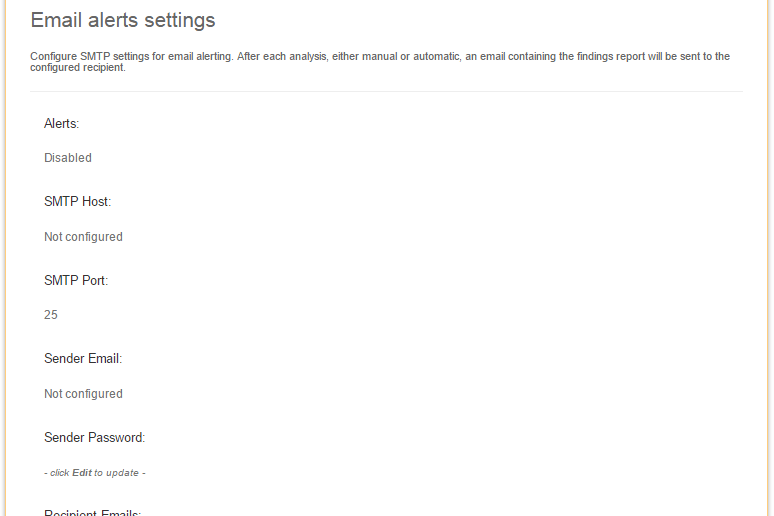
On the Alerting configuration tab, we can configure our SMTP server to receive emails after the analysis runs and the findings report to be sent via email as well.
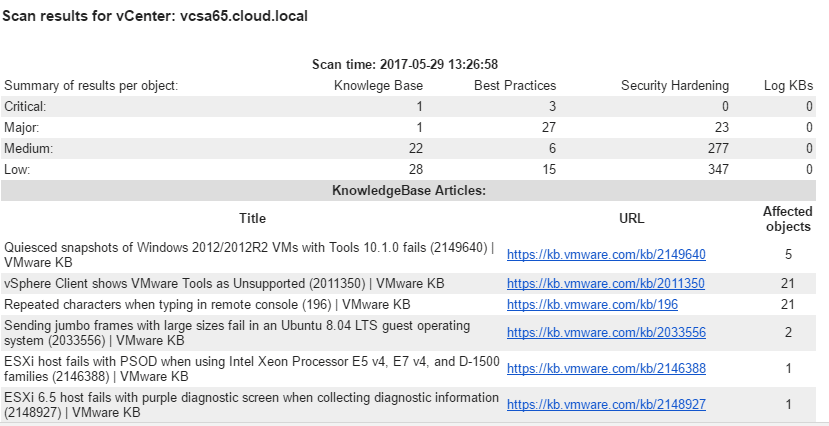
Below is an excerpt from an email I received from the appliance after an analysis run. The results are sent in a very easy to read table with links to all the VMware KB articles that apply!
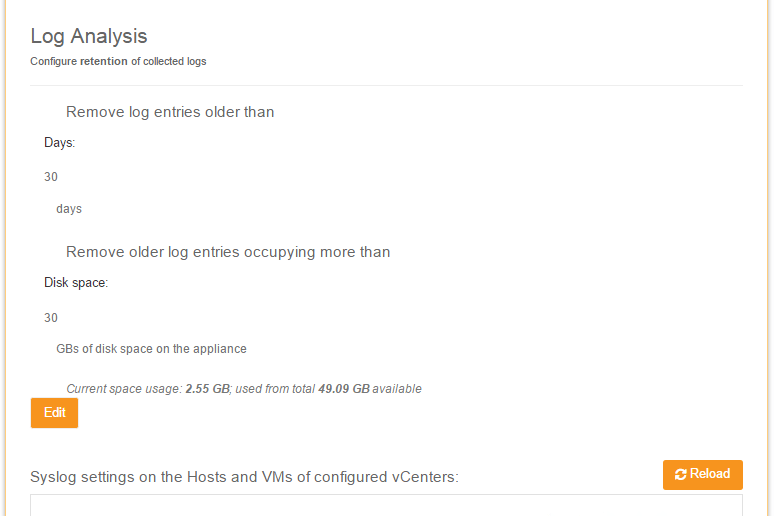
On the Log Analysis tab, we can configure retention of the syslog logs that are kept from the environment. Also, we will talk more about this below, but we can also automatically configure our ESXi servers in the environment to send their syslogs over to our Runecast Analyzer.
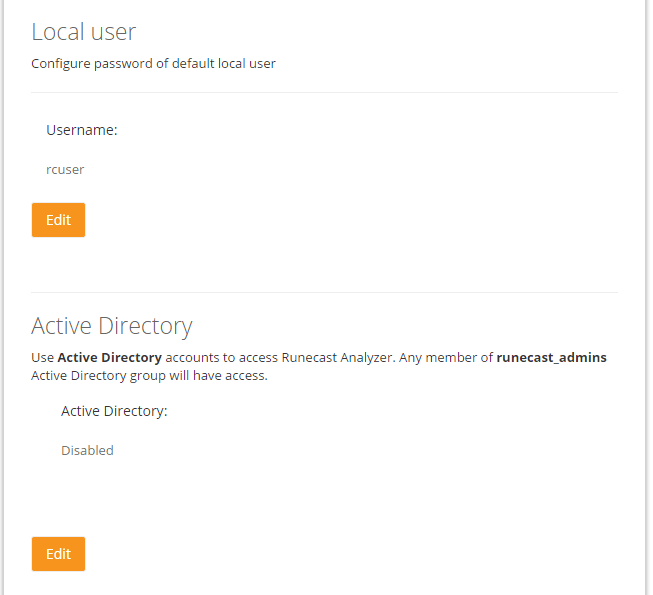
The User Profile tab is where we can set the password to our rcuser account. Also, here we can configure Active Directory integration. We can enable the use of Active Directory accounts to access Runecast Analyzer. Any member of runecast_admins Active Directory group will have access. This is the default group that is configured to be the scope of Active Directory access, however, we can set any group we want to be the scope of Active Directory access.
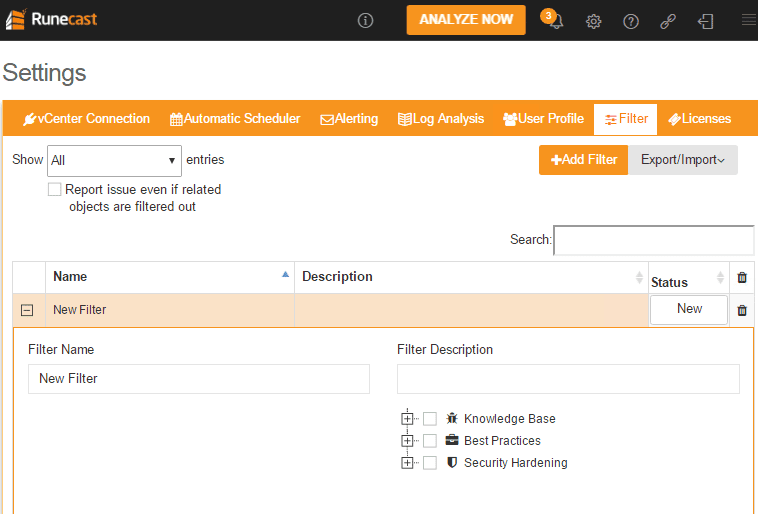
With the Filter configuration tab we can filter the results of our Analysis runs based on certain criteria including Best practices, KB articles, security, etc.
Running the Analyze Now Process
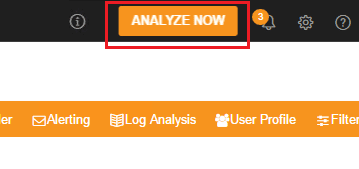
After we have the settings configured as we would like in our environment, we can click the Analyze Now button in the upper right hand corner of the dashboard.
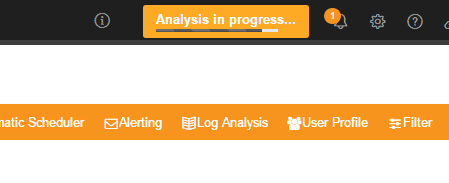
The analysis will run fairly quickly and complete. Again, if you have Alerting setup, you will also receive an email once the Analysis is complete.
Runecast Web Interface
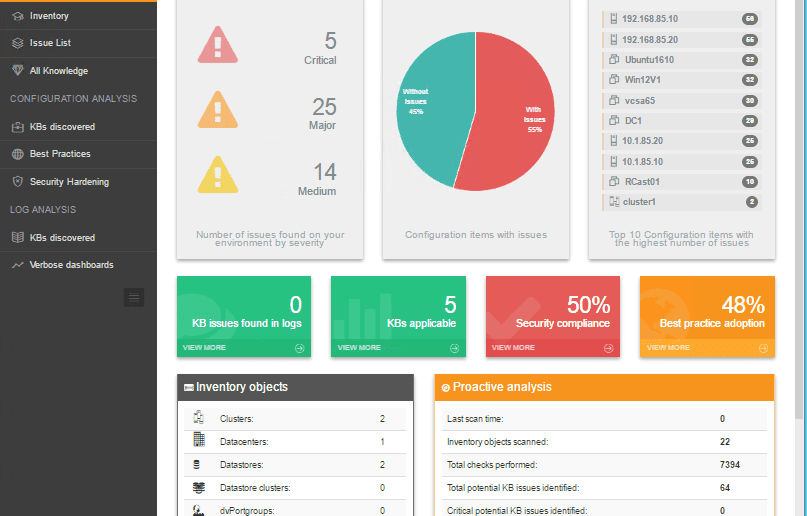
Let’s take a look at the interface. In the Dashboard view we have a very intuitive overview of our VMware environment with easy to read issues detected, KB articles that apply, etc. Also, I might add, the interface is very responsive and performs extremely well since it is HTML 5 based.
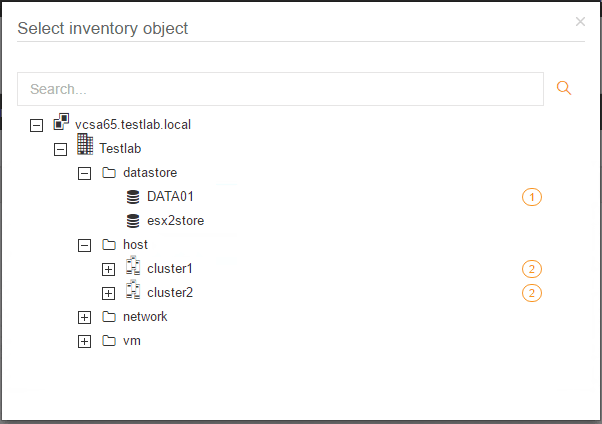
If you click Inventory you have a very hierarchical view of your vCenter enviroment and you can easily see the issues listed by each object that need attention. These are clickable. Once you click them, you have the details brought up for the detected issues.
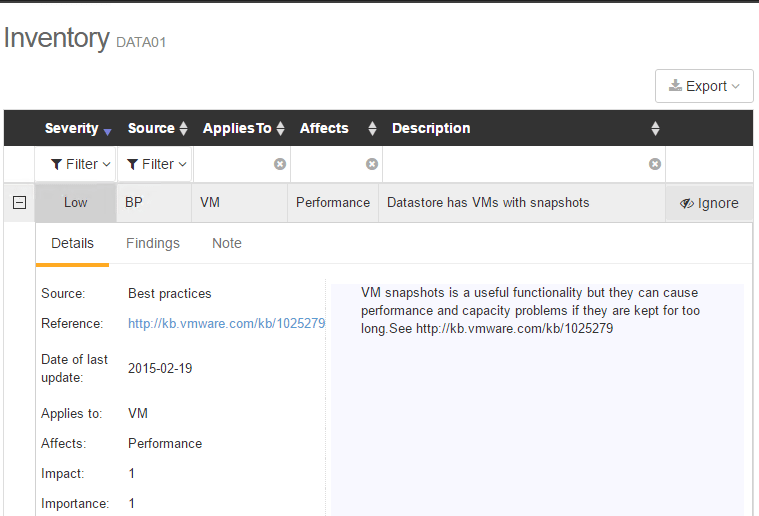
Below, the results for the Data01 datastore are brought up in an easy to read table format that can be expanded to see the relative KB article, etc.
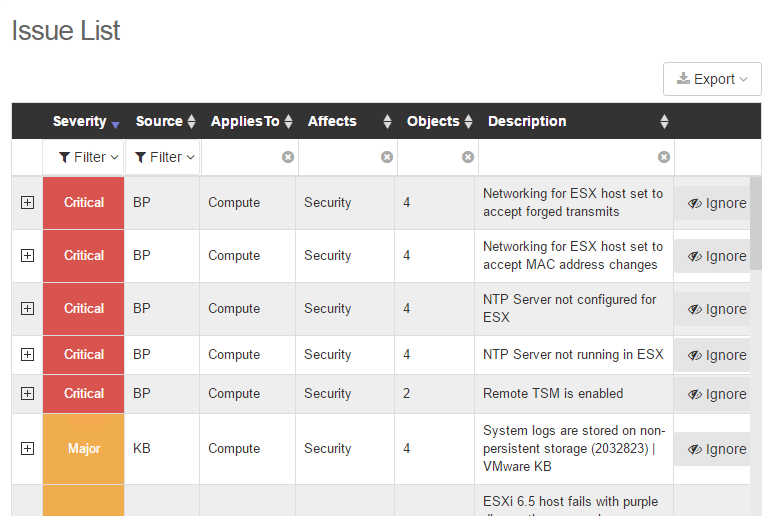
the Issue List is an extremely easy to read expandable table format that is listed from the most Critical issues down to the least critical. Exceptional information all available at our fingertips. A point to think about – How many hours would it take to have come up with this information manually? It would take most of us with our other day to day tasks many hours on top of the normal workload to compile this information. And, how would we do this on a regular basis? The value add of Runecast Analyzer from this aspect is huge!
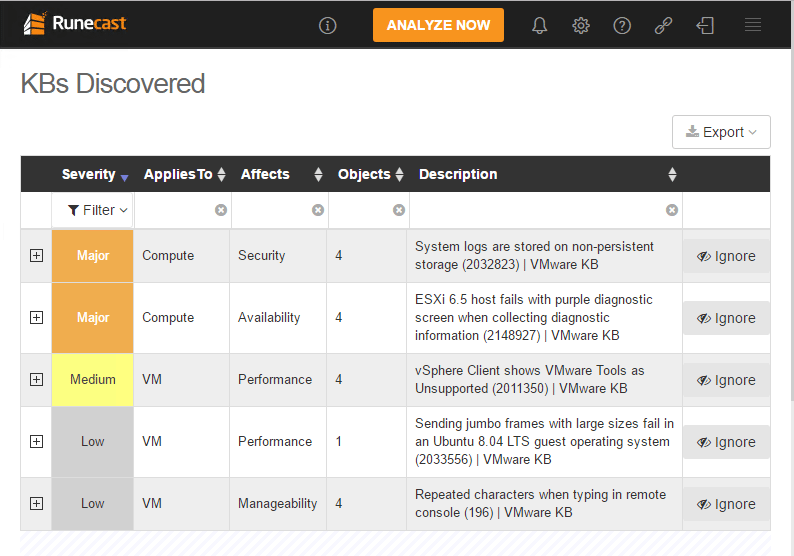
The KBs Discovered provides the listing of issues that are sorted by the applicable KB articles from Critical to Low. Very useful information organized accordingly.
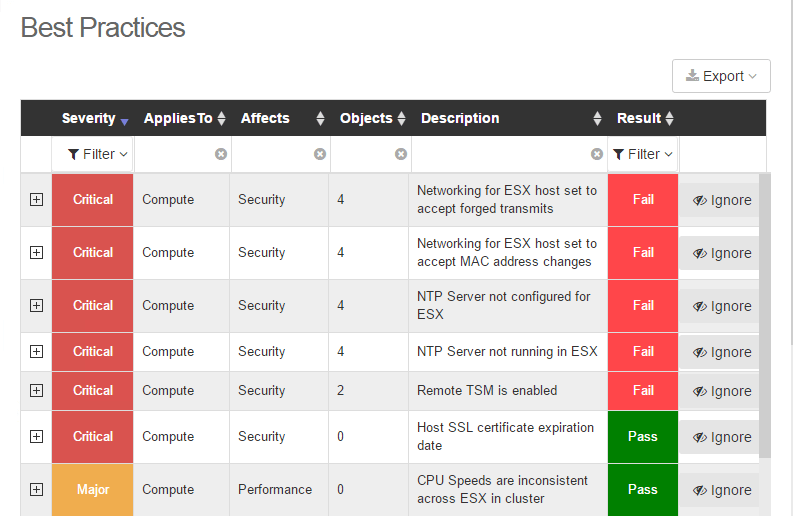
The Best Practices view compiles a listing of best practices that are not met. These again are listed from the most critical down to the lowest priority. Again, if we think of the time it would take to compile this information, the benefits of this information are enormous.
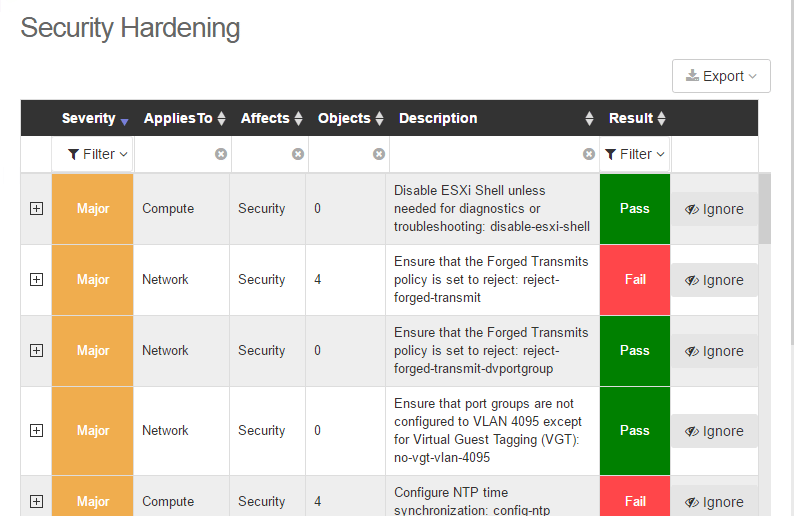
What if we need to meeting compliance regulations such as PCI or others? The Security Hardening view is security focused and helps us to easily see the security related issues in our environment along with the KB articles that apply.
Above each table view you can Export data to either CSV or PDF format allowing you to manipulate or save off the data for reporting purposes – very useful.
Log Analysis
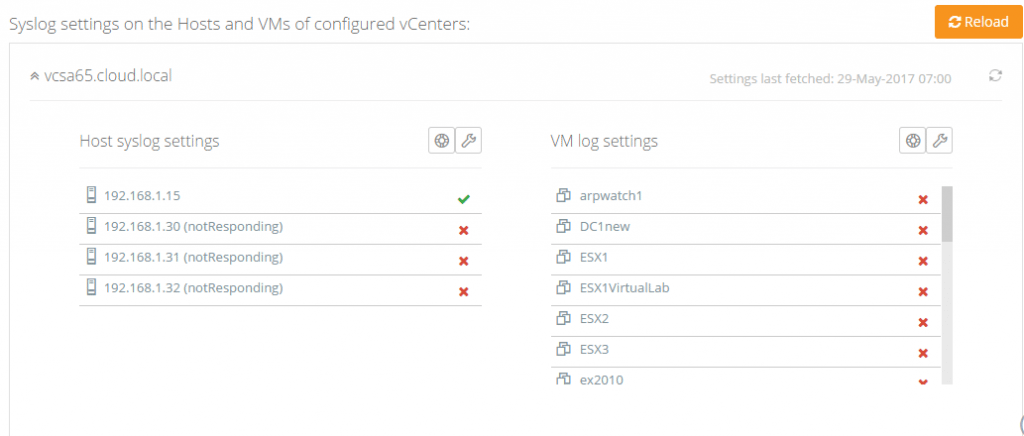
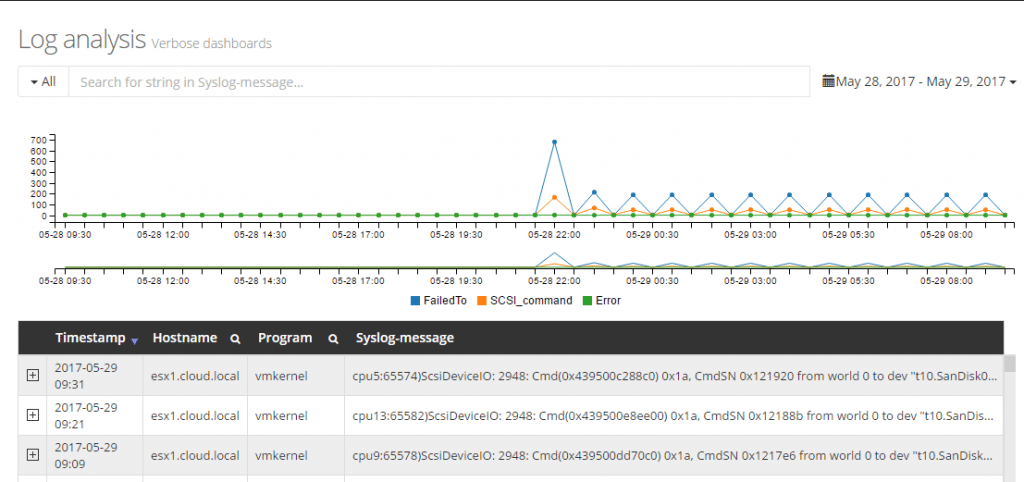
Additionally, Runecast Analyzer can analyze logs from your VMware environment. A nice feature as well is that it can automatically configure your servers to send syslogs to your Runecast Analyzer. Under the Log Analysis tab under the settings screen, we can setup our ESXi servers for access.
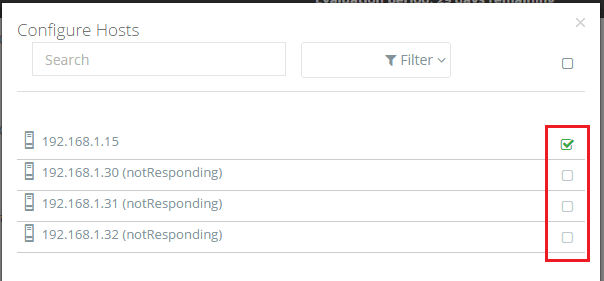
As you can see below, one of the hosts has been configured and the others have not. We can click the wrench icon
After configuring, the Runecast Analyzer will begin gathering information from the logs AND it will determine if there are any errors in your environment related to VMware KB articles that are known. This makes troubleshooting and being Proactive in a VMware environment from an administrator side, much much easier.
Appliance Admin Interface
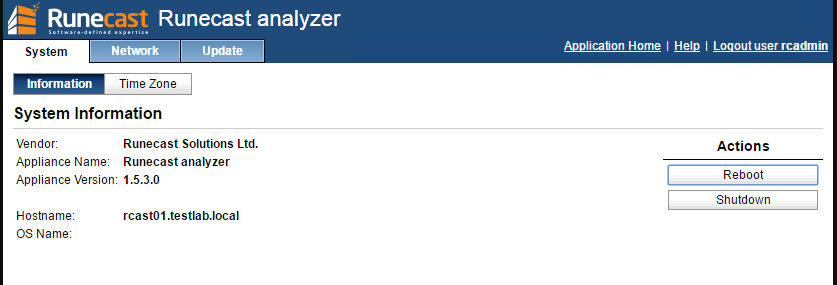
The Runecast Analyzer provides a very intuitive interface for anyone familiar with VMware administrative appliance access. In fact, the Analyzer appliance URL is accessed by a familiar port – https://<your runcast IP:5480.
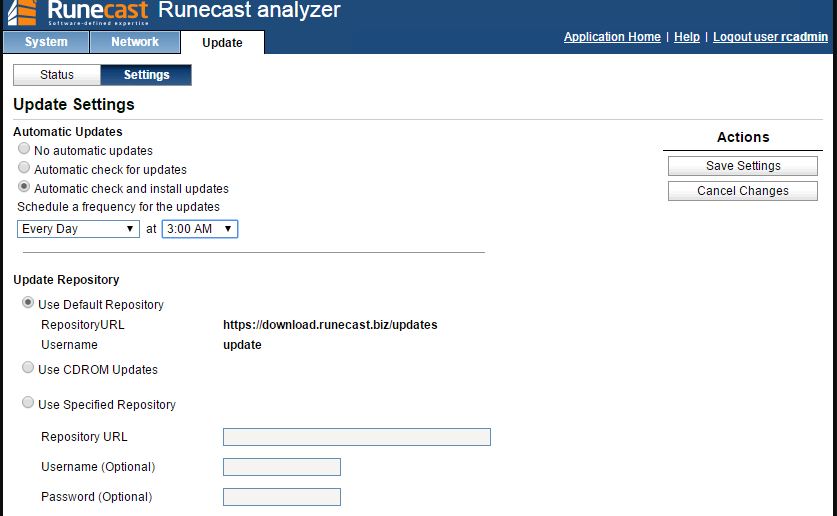
There are a couple of tabs here Network and Update to take note of. The Network tab allows us to manipulate network settings after the deployment of the appliance if need be. The Update tab allows us to setup the appliance automatic updates for the system and application. We can also choose different repository settings if we need.
Runecast Analyzer Benefits
Just a quick rundown of the benefits of the appliance:
- Extremely easy deployment – The OVA deployment as well as the administrative backend interface are easy and intuitive.
- Informative Dashboard and other views – The interface is very well written in HTML 5 and provides intuitive information views that anyone will quickly be able to navigate. You can easily see KB articles, best practices, security, and log information that provides very useful information
- Realtime Log Analysis – Your ESXi server logs are examined and relative KB articles are displayed for review.
- Built in alerting – The easily configured alerting allows email notifications and reporting on a number of events.
- Easily exportable result set – The results in all views are exportable to a CSV or PDF for manipulation and viewing.
- Saves hours if not days of information gathering!
Thoughts
Runecast Analyzer is an innovative product that provides a tremendous value add for VMware environments. The product puts the automation inside of best practices and VMware expertise by doing the heavy lifting of gathering all the pertinent information from VMware and comparing this information to the configuration of your VMware environment. Hopefully our post on how to Automate VMware Best Practices with Runecast Analyzer has shed light on a great product that adds value and saves VMware administrators valuable time in making sure their environments line up with best configuration or security best practices. It will be great to see the continued development of the product. I for one would not see running a VMware environment without Runecast Analyzer giving valuable insights in both best practices for configuration and security. Check out Runecast Analyzer here and download the free trial version.
Google is updating how articles are shown. Don’t miss our leading home lab and tech content, written by humans, by setting Virtualization Howto as a preferred source.


