



There are definitely certain things to watch when it comes to monitoring your home lab for helping to know if there are things that need your attention. For a long time, my idea of monitoring probably looked like everyone else’s. Like most I watched things like CPU and memory and then also disk capacity. If those numbers looked good and the dashboard was green, I generally felt like the environment was healthy. However, I have found there are other important metrics that need to be watched closely. These are the 8 home lab metrics and health indicators I pay close attention to. Check it out.
1. Disk latency and I/O wait
This is a huge one. Most of the time, disk latency and I/O wait are things that we usually don’t keep visibility on until we start having issues with something in the home lab. If there is one metric to monitor beyond monitoring the normal things like CPU and memory, storage latency is THAT thing.
Storage problems are so hard sometimes to flesh out, as they can hide as other problems that you are seeing in the environment. For instance, if you have a VM that is sluggish, it is easy to assume it is just the VM itself. Maybe it needs more CPU or it is having issues with an applications. Or another might be that Proxmox feels slow during backup windows. The job might get blamed or the network. Keep in mind this is also important on bare metal hosts as well.
But, a lot of times, the problem is actually the underlying storage in the Proxmox host. This is why I like to pay close attention to disk latency and I/O wait instead of looking only at storage space when it comes to the storage subsystem.
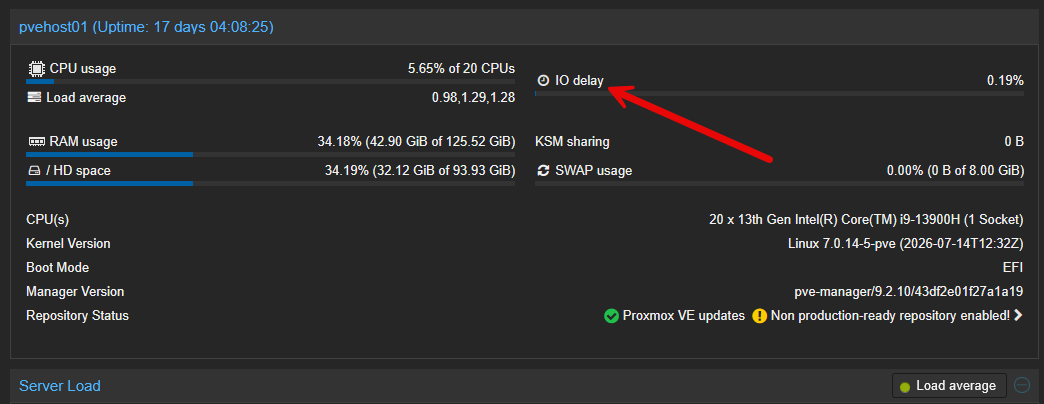
Proxmox has some nice built-in monitors to take a look at when it comes to storage. Right from the web UI you have visibility to the I/O delay meter on your Proxmox host. This will tell you pretty quickly if you are seeing issues with storage as you will see a lot of I/O delay in the console. It is sometimes normal to see this spike up from time to time when large I/O operations are underway. But if you have this stay elevated for long periods of time, that is likely some type of storage issue.
On Linux, I often start with tools such as:
iostat -xz 1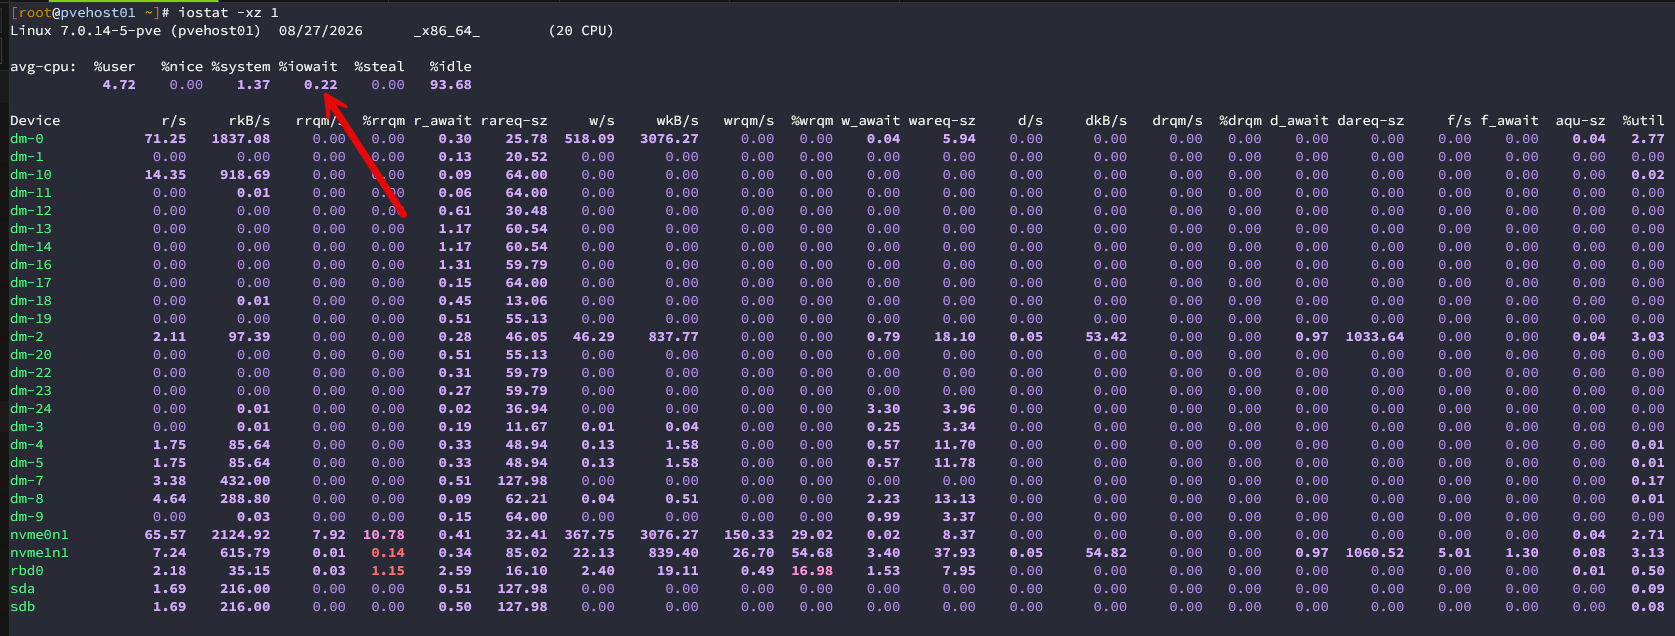
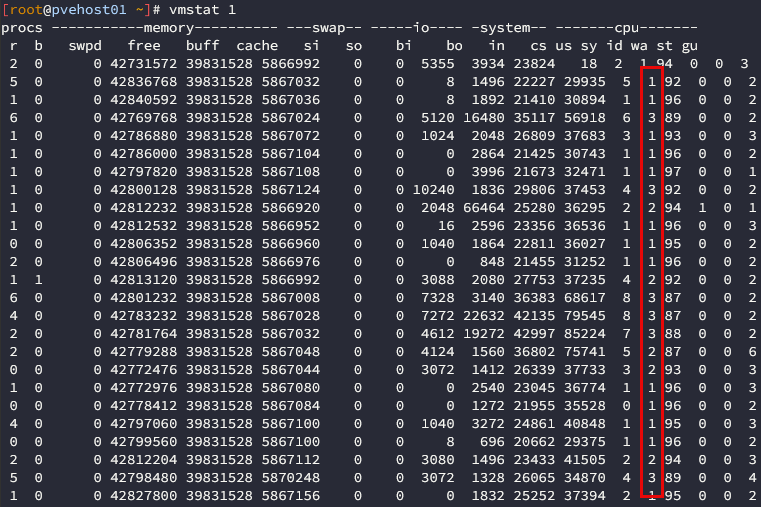
This will give you a really good idea if something is going on with your storage. Another command I also like is:
vmstat 1The wa column is a good one to keep an eye on as it will show you if your CPU is having to wait on your storage:
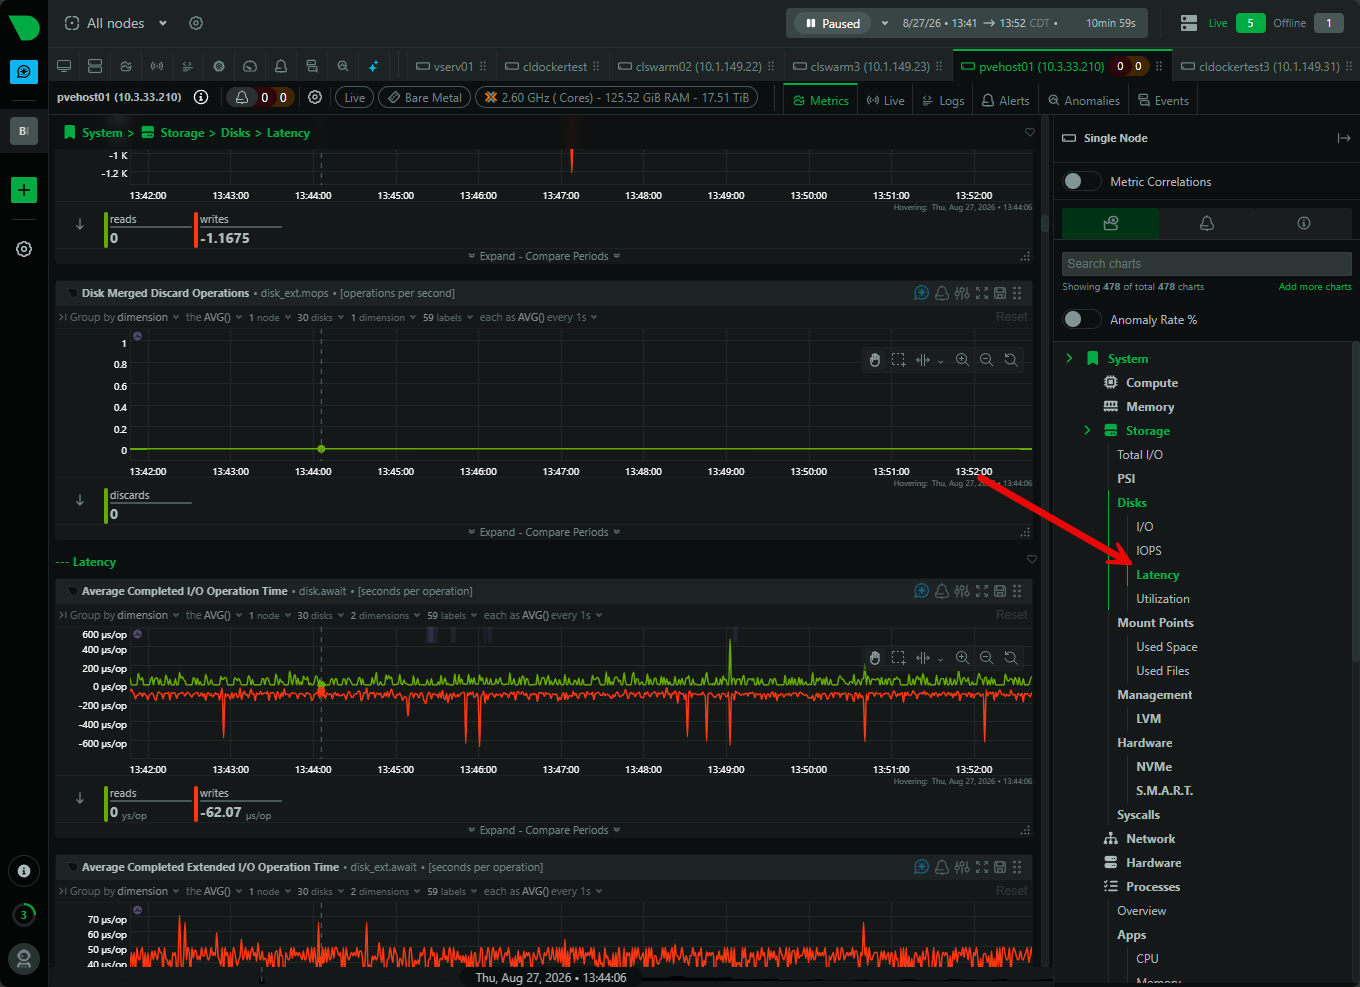
Obviously, it is a really good thing to monitor your storage capacity. But, I think keeping an eye on your latency and wait times with storage is one of the most important things you want to monitor. For proactive alerting, I have Netdata spun up and have my Proxmox servers added:
2. SMART and NVMe health
So another metric and monitoring that I think is super important that goes along very nicely with measuring latency is monitoring your SMART data and NVMe health. SAS and SATA drives expose a lot of really good SMART data that can proactively warn you if something is going out. With NVMe I also look at some of the health information that is shown by the controller.
With Linux, you can use commands like:
smartctl -a /dev/sda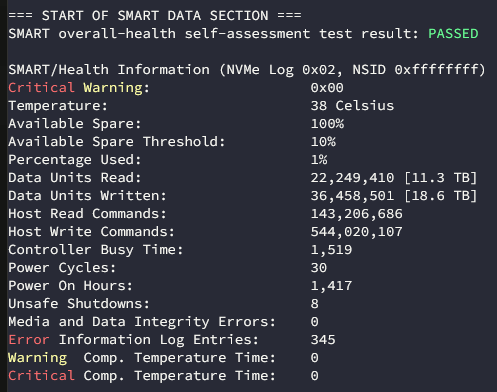
or:
nvme smart-log /dev/nvme0Here is where keeping up with trends is important here. If you see a drive that continues to increment errors or retries or any of the other metrics that show the disk is struggling, you have a pretty good idea that something may be going on with your storage.
3. Network errors, drops, and retransmissions
Along with storage, networking in the home lab is super important for things to run smoothly and efficiently. Like storage, when you have network issues, you will see weird things happen. And, like storage, it can masquerade as something else going on like application errors.
In Linux, there is a quick command that you can run just to see the overall health of your connections. it allows you to see whether or not your interface is dropping traffic. The command is:
ip -s link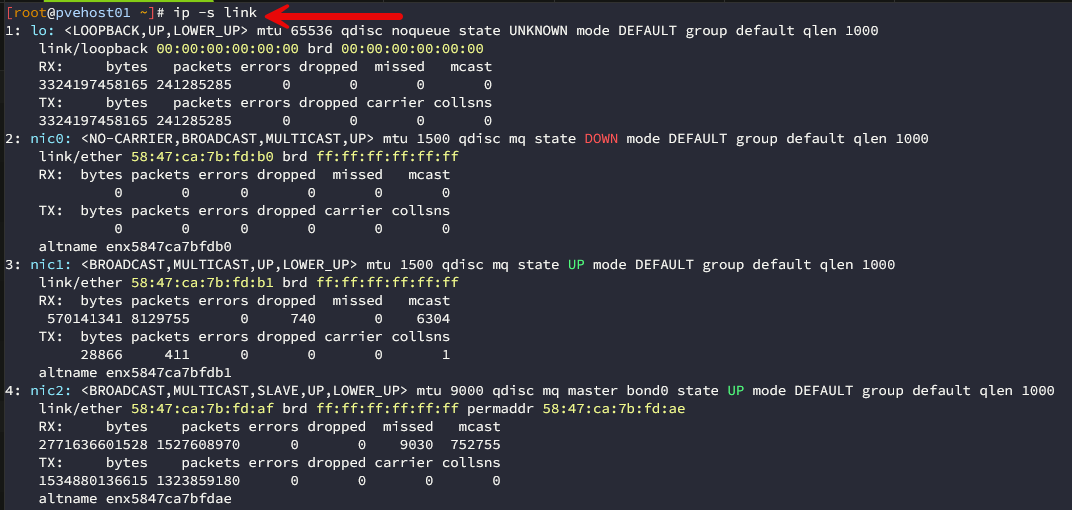
On this output, I would look for things like receive, transmit errors, dropped packets, and counters that continue to rapidly increase over a short time. If you suspect that something with the network is going on, this is a great command to remember. It is also a good idea to look on the switch side port statistics on the ports where the connections are uplinked to see if the data coincides.
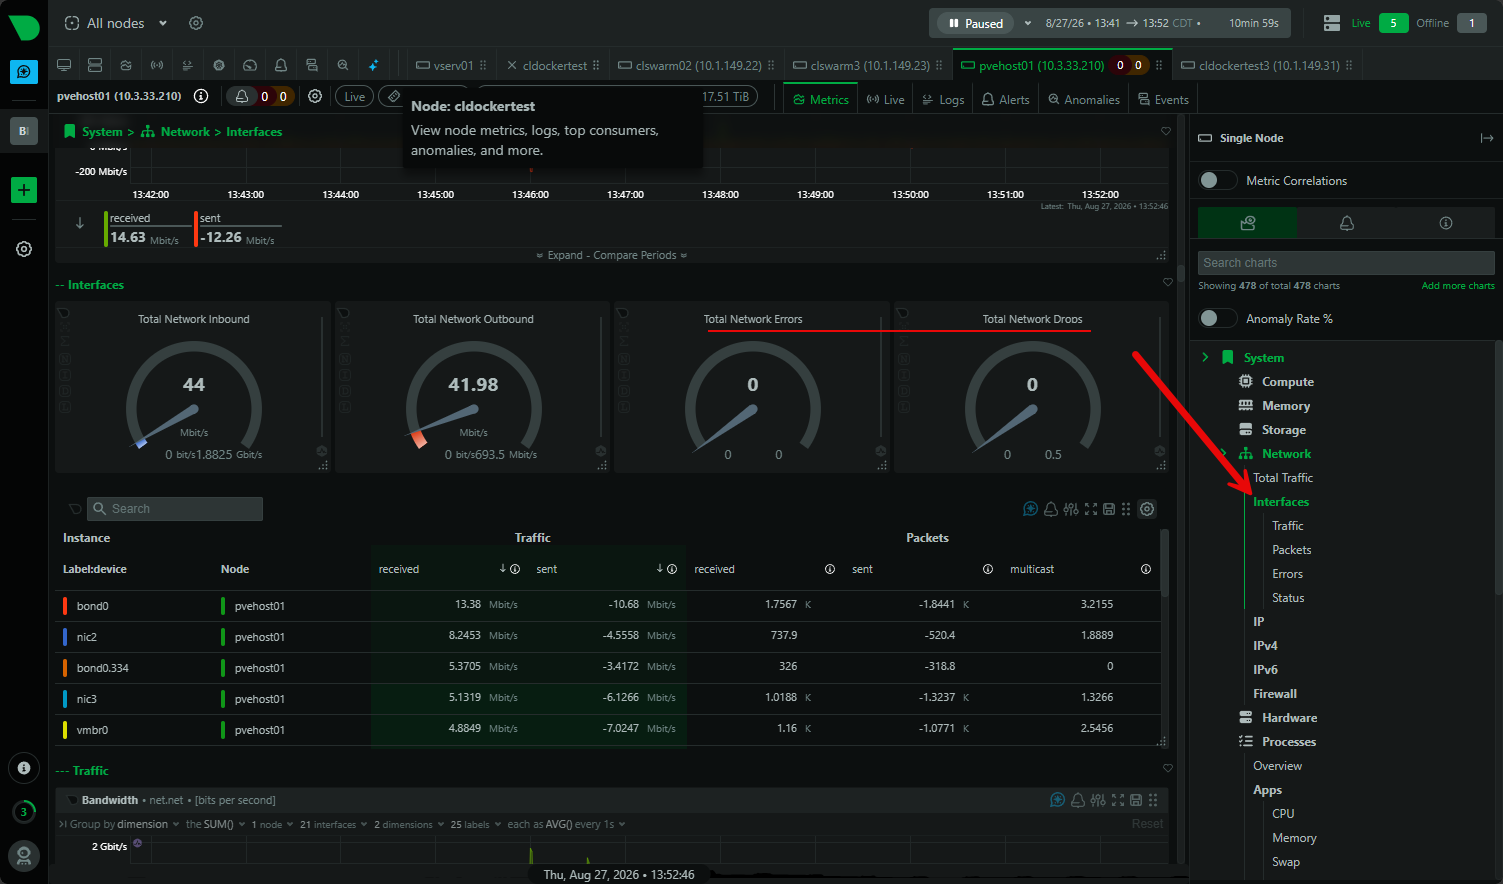
Counters that are rising very rapidly may indicate a flaky DAC cable or something like a mismatched MTU size that can cause issues. Netdata also has really good monitoring on this front for your network so you can see things like drops and errors and trend counters over time.
4. Latency and packet loss between critical systems
Just like with storage systems, latency can wreak havoc on your network. If you have latency or packet loss between your hosts or between your Proxmox host and storage or another host running workloads, everything will feel sluggish. So, just simple latency and packet loss monitoring is a great way to make sure that everything is operating like it should be for the most part,
If you have a monitoring solution that records ping latency and packet loss over time, that can really help with trending issues. Many network issues are intermittent in nature, so even if you have a clean ping test at 8:00 in the morning, it doesn’t mean that same ping test is clean in the afternoon.
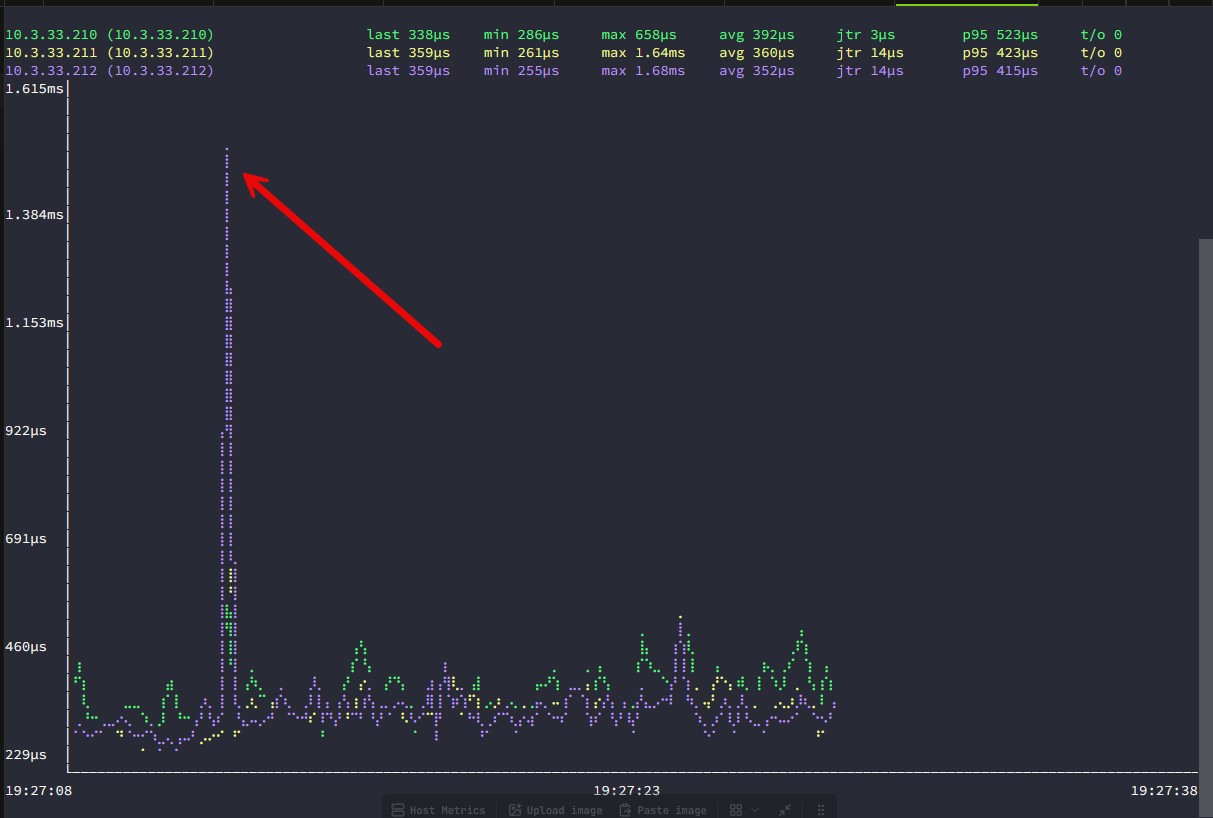
If you want to test pings and latency over time between multiple hosts at once, you can do this with the gping command, which is a command I recently covered in another post here: 8 Modern Linux Commands I Use Instead of the Old-School Alternatives.
Below, I am using gping to show me ping times and latency between three Proxmox hosts.
I also like the IPv4 metrics that display in Netdata for my Proxmox hosts. You can click on the IPv4 module and you can see things like total number of packets, and errors between TCP and UDP.
5. Storage pool and filesystem headroom
Storage capacity is usually a metric that most watch and falls more into the classic category of things that most know to watch in home lab and production environments. Sometimes though the part that gets missed is how dangerous it can be on that last few percentage points of capacity. Try to keep “headroom” in mind. Why is this important?
Well, ZFS is a pretty good example of this. Having ZFS pools living at extremely high capacity can cause performance issues and you will see problems with fragmentation, snapshots, replication, etc. This same concept also applies with LVM thin pools and other things like container storage, Docker volumes, NAS shares, Kubernetes persistent storage, etc.
Be sure to monitor and get notified when you are at 75 or 80 percent instead of discovering an issue when storage is at 98 percent when it might be a lot harder to deal with. Things like snapshots are useful but they can consume a LOT of disk space that you expect, especially if data is churning quite a bit.
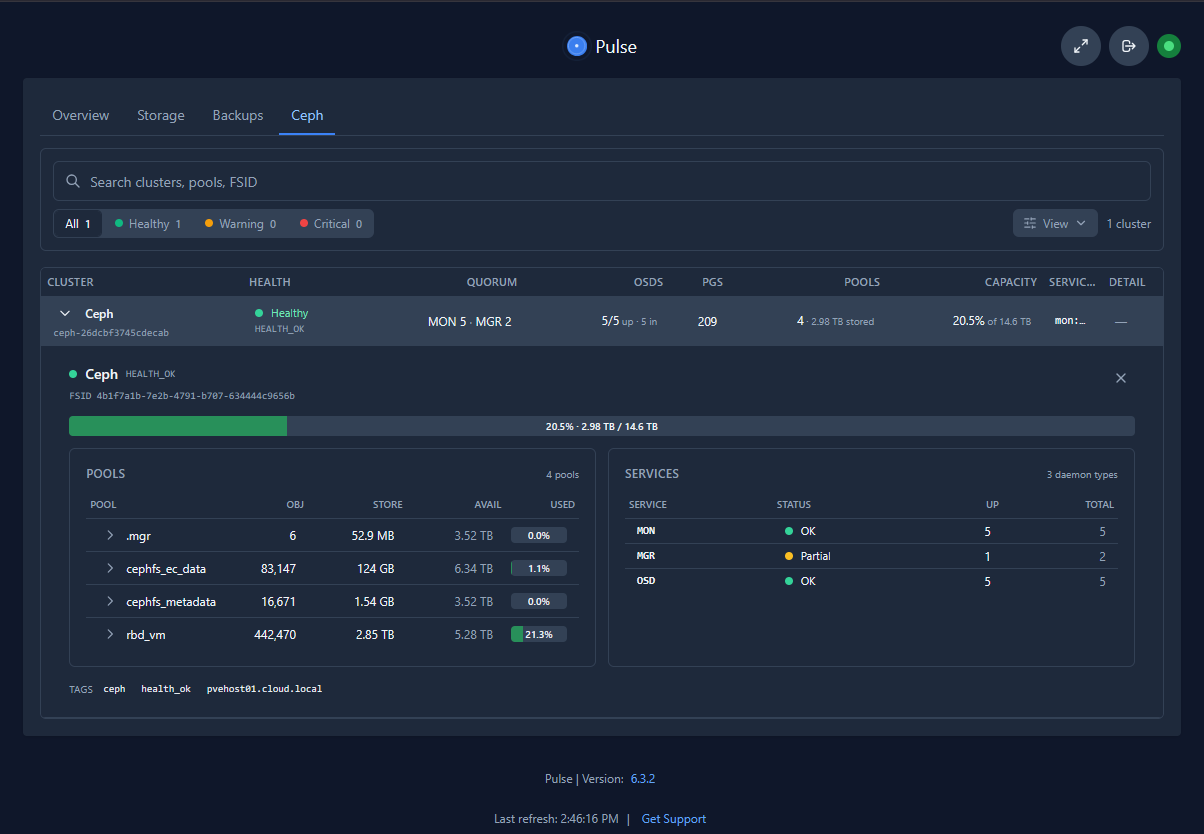
I also make use of Pulse in the home lab to monitor storage capacity across the nodes in my Proxmox cluster. It gives really good visibility into things like Ceph storage space.
6. VM, container, and service restart counts
Things that are indicators of stability issues are always good to keep an eye on. One of the things I really like to monitor is uptime and service restarts. I make use of Uptime Kuma in the home lab to keep an eye on actual service uptime to make sure things like web pages, DNS server ports, and other endpoints are alive and well.
Docker also has some really good metrics to keep an eye on alike service restarts. So, if a service has crashed 20 times in the last 6 hours, most likely, there is something going on there with the application or data or the underlying hardware. Just because a service is up and running at this moment doesn’t mean that it is healthy.
Running basic Docker commands can tell if you how long the service has been up and running:
docker ps
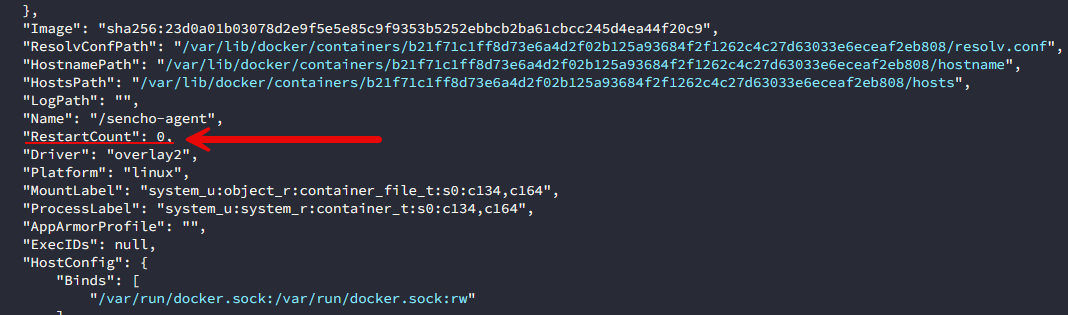
I also inspect individual containers when something looks out of whack:
docker inspect <container>Here specifically, you can see the restart count which is like an indicator of the stability of a container and if you have something going on:
7. Backup age and last successful backup
Another super important metric to monitor is the backup age of your virtual machines and containers and the last successful backup you have had of your workloads. For me the age of the last backup is extremely important as it tells me how far back the snapshot of data is from. If it is really old, chances are if I have to rely on that specific backup to recover, I will be looking at at least some type of data loss.
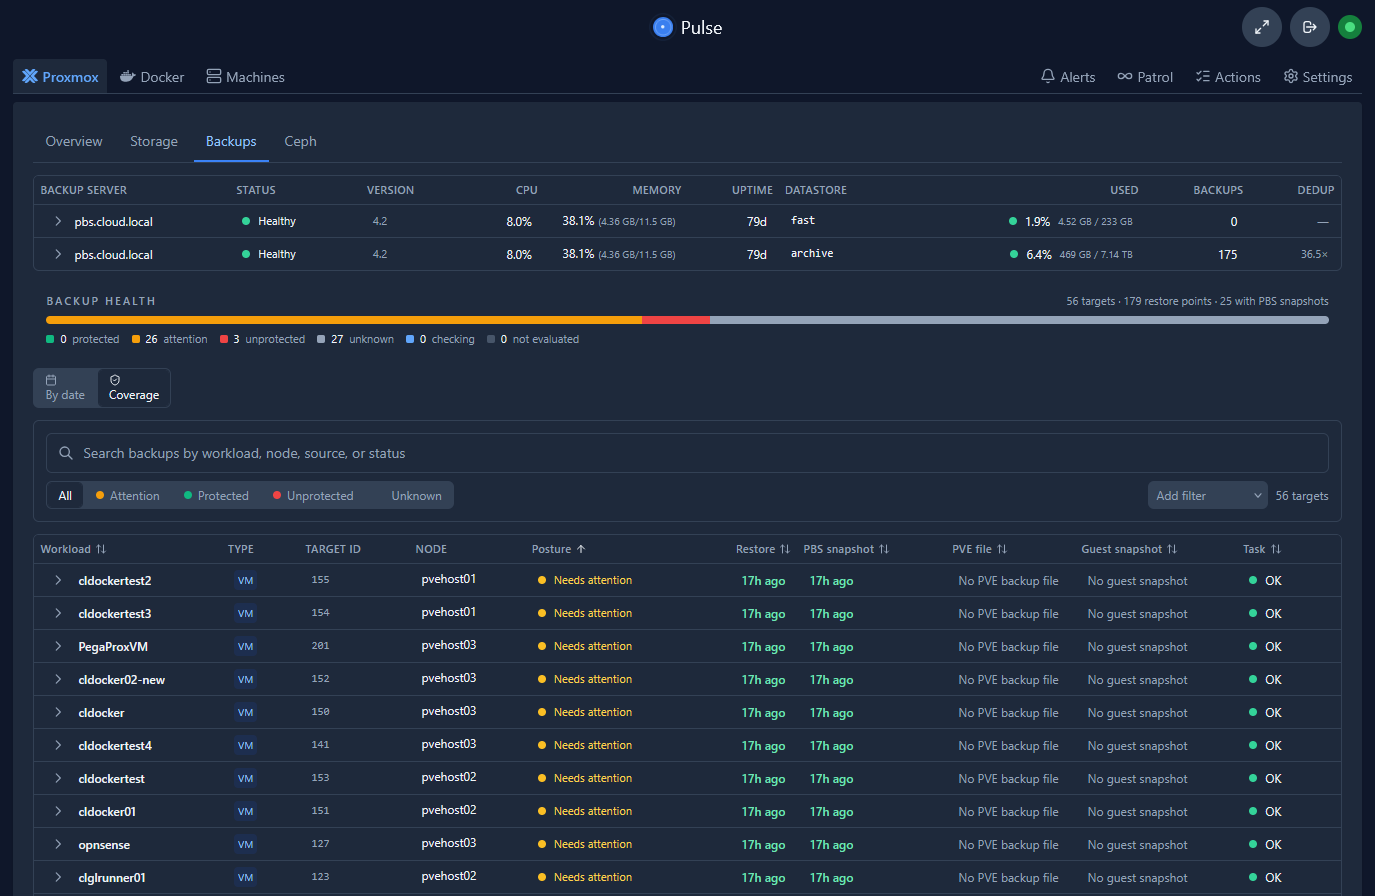
If I expect that a VM or LXC is backed up every night, I want to get an alert if the last successful backup slips to 36 or 48 hours old. I don’t want to have to discover that in the middle of a restore. Here, to check on my backups, I make use of Pulse which has some good checks on the backups front. It will show you the age of the last backup, restore, and will show “needs attention” if the backup hasn’t been verified as of yet.
8. Temperature and thermal throttling
If you are like me, the physical layout of my home lab has changed quite a bit over the past few years. I no longer am running “big iron” enterprise servers. My lab is made up of mini PCs these days. As great as mini PCs are, they generally have weaker cooling found in the internals and can struggle in tight spaces or in a mini rack.
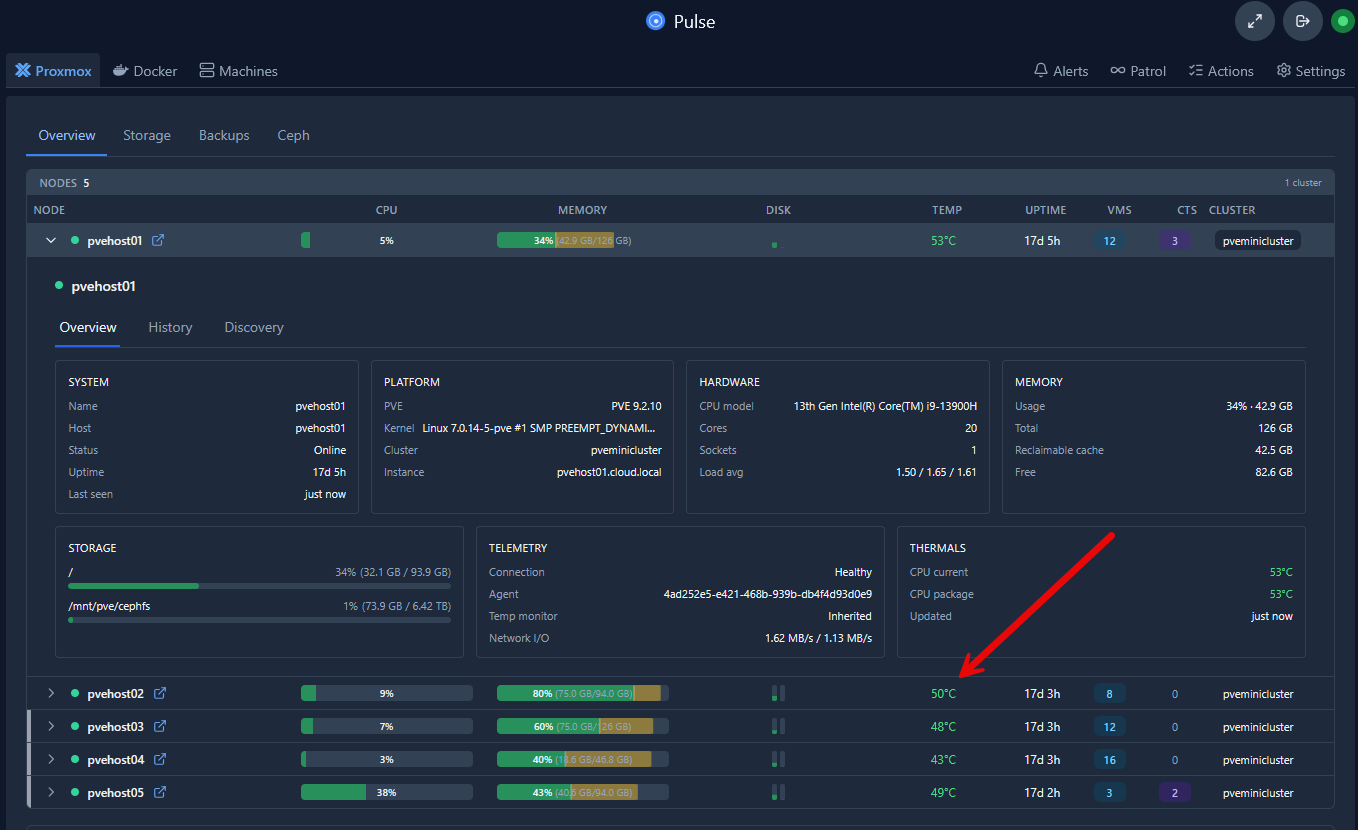
Be sure to have a way to monitor the temperatures of your hardware and make sure these are in the healthy range for your hardware. This includes the CPU temperature, but also temperatures like of your NVMe drives.
9. Container image updates
This is one that I like to add to the “metrics” that I watch in the home lab. Keeping your container images updated is a great way to keep things running smoothly and securely. When you run Docker containers, one of the main aspects of managing your environment is keeping your container images fresh and updated.
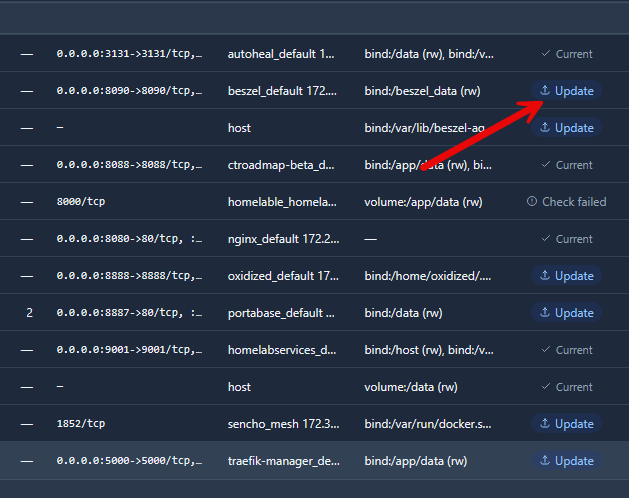
How do you know if you have image updates? Well, there are thankfully these days a lot of great tools that I use in the home lab to alert me if there are image updates. Pulse as I have already mentioned a few times here also has a feature as part of its Docker container management that keeps you informed when updates are available. I like this “monitor” of sorts as even if you have a solution like Watchtower or Dockcheck that keeps your containers updated most of the time, this will clue you in if those solutions are not doing what they are supposed to do.
Wrapping up
Hopefully, this overview of the home lab monitoring metrics that I watch before something goes wrong will help shed light on a few of the lesser monitored areas of a home lab and why you need to pay close attention to these. How about you? Are you monitoring any other more obscure metrics in your home lab for health or status information that I dont’ have listed here? Let me know in the comments.
More in this topic




Google is updating how articles are shown. Don’t miss our leading home lab and tech content, written by humans, by setting Virtualization Howto as a preferred source.
About The Author