I am always on the lookout for new and interesting tools that allow us to manage our Proxmox servers and clusters more efficiently and overall, a little easier. I stumbled onto a tool called pvectl that helps you to manage your Proxmox clusters more efficiently from the command line in a TUI type tool. Even though Proxmox has powerful command line utilities like qm, pct, pvesh, pvesm, and others already built in, you have to remember these and their parameters. The pvectl tool bridges the gap here and provides a way to manage from the Proxmox CLI without remembering syxtax. I think it helps to have a middle ground between things you can do from the web UI and the command line. Let’s see how.
What is pvectl?
First of all, what is pvectl? The pvectl tool is an open source terminal utility designed for managing Proxmox VE Server from the Proxmox CLI. It doesn’t replace Proxmox’s native CLI tools. But, it provides an interface that allows admins and home labbers to browse their clusters, hosts, virtual machines, LXC containers, storage, networking, etc. You can do all of this from an interactive terminal.
If you have ever used tools like k9s for Kubernetes, lazydocker for Docker, or btop for monitoring Linux systems, the overall philosophy feels familiar. So instead of you having to memorize long commands, you can navigate through an interface using your keyboard. You can do this while staying inside your terminal session.
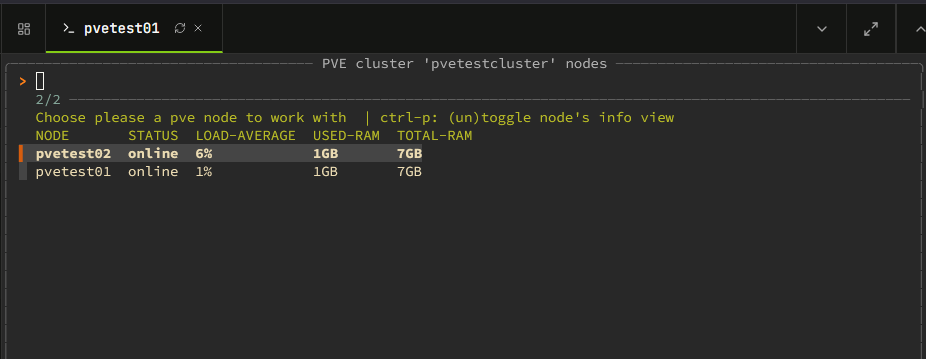
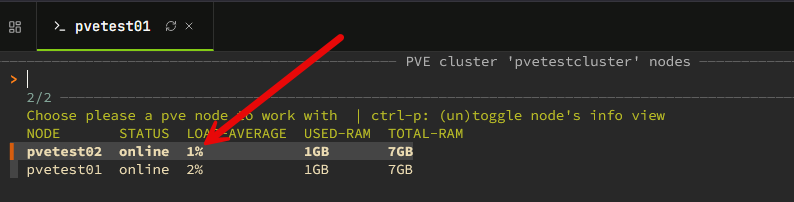
Below, is a screenshot of using the pvectl utility viewing two nodes in a cluster:

Why I think TUIs are awesome
I have been a huge fan of TUIs since using K9s for interacting with Kubernetes clusters. TUIs gives you the speed that we often appreciate from command line environments, but it also gives you a nice blend of GUI management that allows you to navigate through menus very quickly with keyboard shortcuts.
The pvectl utility is a similar idea here where it allows you to interact with Proxmox clusters and manage these with a TUI interface which is very nice. In my opinion, the missing tool that has been lacking in Proxmox and truthfully many other environments is an interactive command line environment that sits somewhere in between options like the web UI and interacting with the API for automation.
If you just want to connect to a node and quickly answer questions like the following, a TUI may be just what you are looking for:
- Which VMs are currently running?
- Which containers are consuming the most resources?
- Is storage getting full?
- What node is a VM currently running on?
- Which backups completed successfully?
- Are any tasks currently executing?
The pvectl tool allows you to bring those views together into a single interface.
Installing pvectl
I think the install process was fairly straightforward, although I ran into a couple of quirks since I was installing this on a test PVE instance and just followed the instructions on Github for things like paths, which didn’t work quite right. But more on that below.
The first thing you will want to do is clone down the project. You can do that with this command:
git clone https://github.com/mytechspacexyz/pvectl.git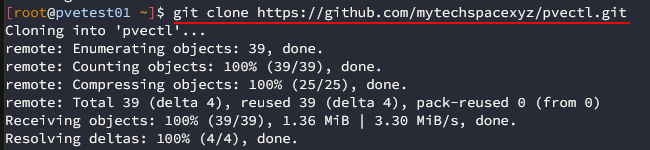
Install this package as a prerequisite as I ran into this on PVE 9 being needed when running the pvectl command:
apt install -y fzf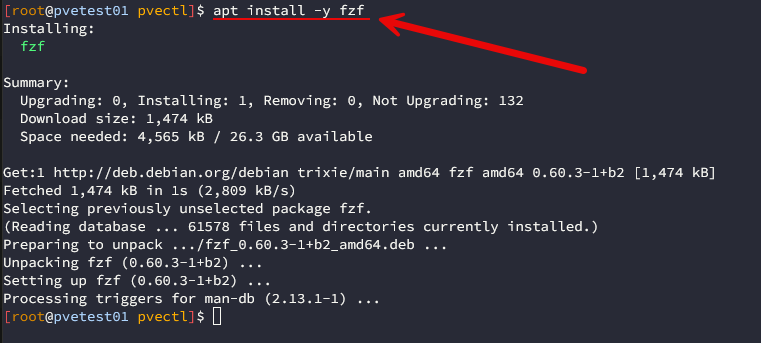
One small hiccup I ran into during installation was that the documentation assumes you already have a ~/bin directory configured in your PATH. My Proxmox VE 9 installation did not have this, so the provided symlink command failed. Creating the symlink in /usr/local/bin instead worked since that location is already part of Proxmox’s default PATH.
So, on that note, below, you see me adding execute bit on the executable and creating the symlink:
chmod +x pvectl

ln -sf /root/pvectl/pvectl /usr/local/bin/pvectl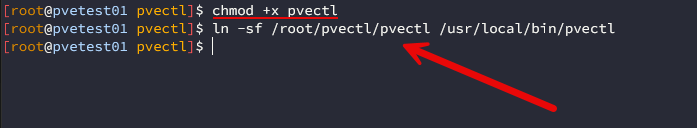
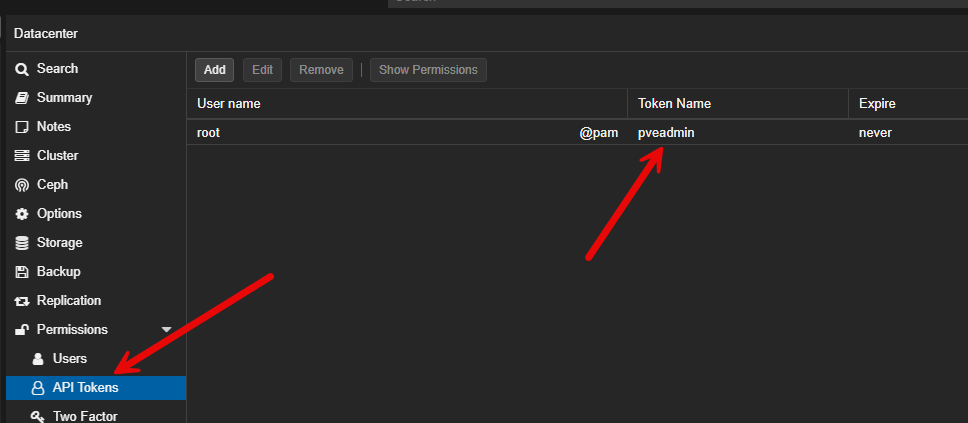
Make sure you have an API token you can use for authentication with pvectl:
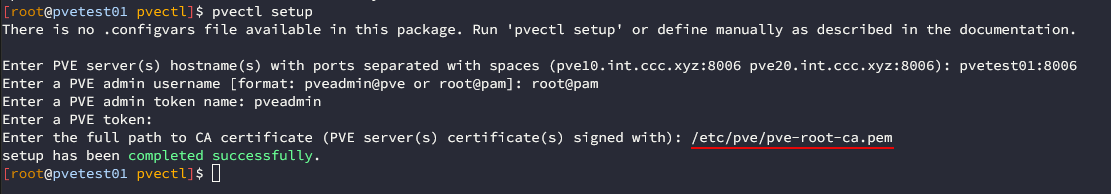
After you have the symlink in place and API token created, then you run the setup command:
pvectl setupThere are a couple of callouts here with the “setup” command. Here you enter the hostname or IP along with the port. Then you will enter the name of the token you created as shown above and the token value. Then you will need to enter /etc/pve/pve-root-ca.pem for the CA certificate location if you are using a self-signed certificate which a lot are in the home lab.
Once you run through the setup with pvectl, then you can launch the pvectl command to manage your environment using:
pvectl manageExploring the interface
I like how the interface is organized and even though I hadn’t used it before, it made sense. This is the beauty of the TUI in a lot of cases, if designed well, they flow pretty intuitively. When you launch the tool using the pvectl manage command, you will see the following top level menu showing the PVE hosts in your environment.
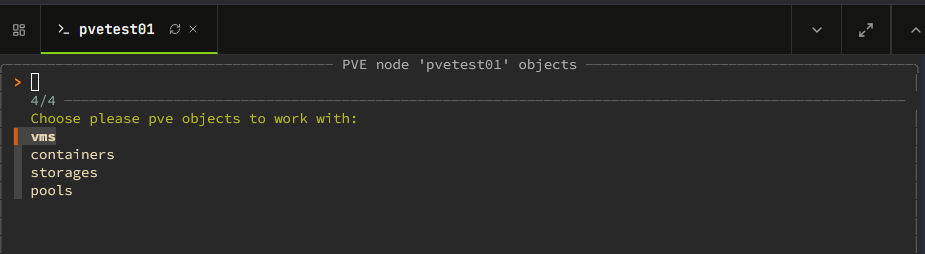
After selecting one of the nodes, you will be take to the screen that has you Choose PVE objects to work with:

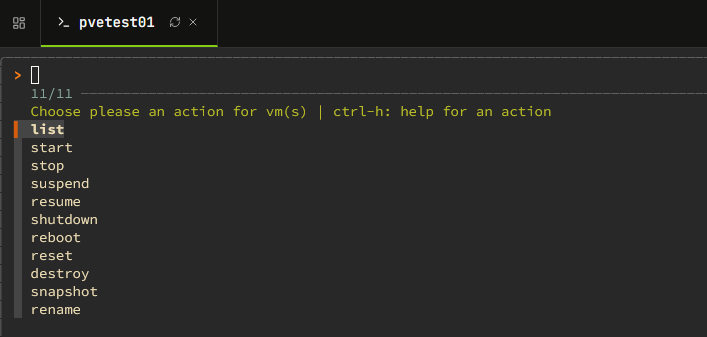
Then you get to Choose an action for vm(s):
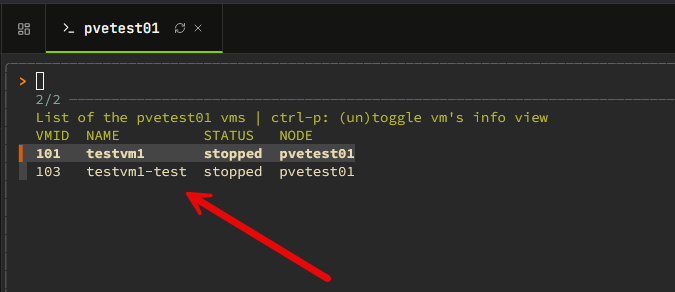
Then we see List of the <your pve hostname> vms:
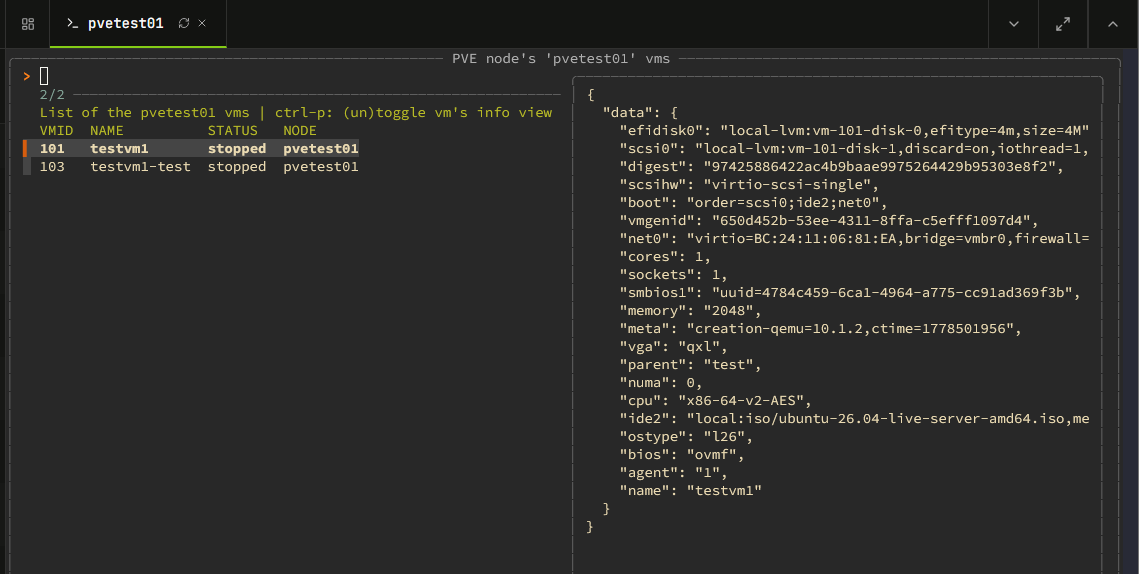
There is also an interesting view with pvectl that allows you to turn on the VM’s info view. Just do CTRL+P and it will display the pane of information on the right-hand side.
Working with LXC containers
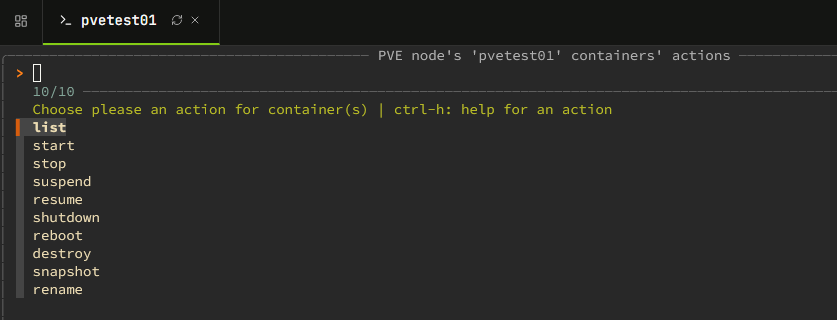
Same goes for working with LXC containers, you have a really simple but good menu for various options here. You can list, start, stop, suspend, resume, shutdown, reboot, destroy, snapshot, or rename your LXCs.
Customizing pvectl and debugging any issues
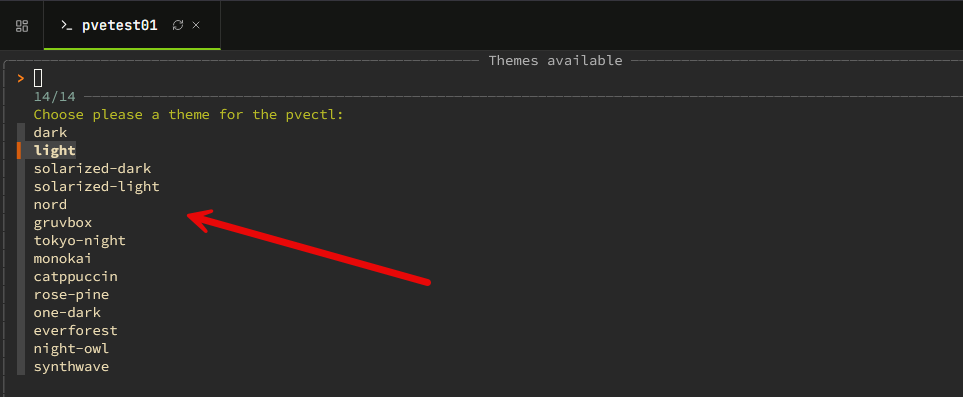
One of the cool things with pvectl is that you can customize the appearance of the tool. You can set the theme. There are several to choose from by default.
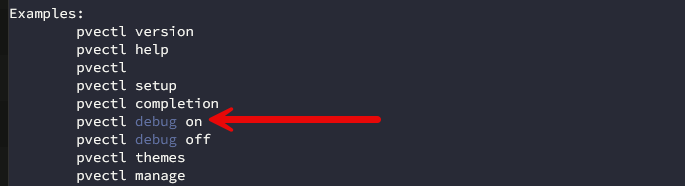
It also has a debug mode that you can flag on if you have any issues with the tool or errors to see what is going on behind the scense.
Basic monitoring capabilities for hosts but not much
With the pvectl tool, you get basic monitoring capabilities for your hosts, virtual machines, and LXC containers. You get a little metrics percentage next to the nodes. I checked the virtual machines and LXC containers nodes and these don’t show the performance information you get with PVE hosts. Hosts also show USED-RAM and TOTAL-RAM.
Pro version vs free
It is interesting that pvectl has a Pro version. I would really like to see more features added to the free version of the tool as I think it would help with momentum of adoption. But if you want to spring for a Pro license these are the features it contains.
It adds provisioning, cloning/migration and backup/restore workflows:
- VM/Container: create, clone, migrate
- VM/Container: backup, restore
- Backup management: info, restore, delete
- Storage: ISO download, template download
Where I still see the web interface still winning
I still think by in large for most more in-depth operations in the home lab, you are probably going to want to hit the web UI for more advanced configurations. The pvectl tool is great for what it does, but he management functionality is rather basic at this point.
However, I think it is great to have a tool like this on a host that in a pinch if you were locked out of the web interface or wasn’t working for some reason, you could launch something like this and perform some basic lifecycle operations.
Wrapping up
I really like these little open source tools that can make things easier from the Proxmox CLI or provide a new way of carrying out various workflows. The pvectl tool is fairly basic at this point but does allow you to do some basic workflows and checks on your VMs and containers. You can perform certain lifecycle operations and see things going on across nodes in your cluster. How about you? Have you tried out this tool? What are your thoughts?
Google is updating how articles are shown. Don’t miss our leading home lab and tech content, written by humans, by setting Virtualization Howto as a preferred source.
About The Author