I am always on the lookout for new and better tools for monitoring in the home lab environment to keep an eye on self-hosted apps and services. There are a lot of free and open source monitoring tools out there. But, many of these require a lot of time and tinkering to dial them in correctly. At the point where I currently am with my home lab, I would rather spend time focusing on other tasks than tinkering with my monitoring. I want something I can stand up quickly and that is already very close to being dialed in. When I stumbled onto Beszel, this ended up becoming my lightweight monitoring tool home lab configuration that was previously served by Prometheus, Grafana, node exporters, etc.
What is Beszel?
Beszel by its very intent is a lightweight monitoring tool that is designed to give you visibility into your systems without requiring you to spend lots of time on complex configurations and tweaking. Beszel focuses on the basics and does those VERY well.
I think that Beszel excels at the following:
- CPU, memory, disk, and network usage
- Simple, clean dashboards
- Lightweight agents
- A centralized UI
- Minimal resource overhead
Also, there is not a requirement for lots of other infrastructure like Prometheus or Grafana. You don’t have to work through complicated alerting pipelines or rules just to get started. It is designed to get up and running quickly and to be fast and simple. This simplicity aspect is what stood out to me.
Installing Beszel “Hub” in a home lab
One of the things I appreciated most about Beszel is how quickly you can get it running. The server piece to the solution is what they call the “hub”. You can deploy this using Docker, which fits with how most are running their resources these days.
A basic deployment looks something like this:
services:
  beszel:
    image: henrygd/beszel
    container_name: beszel
    restart: unless-stopped
    environment:
      - APP_URL=http://localhost:8090
    ports:
      - 8090:8090
    volumes:
      - ./beszel_data:/beszel_data
For docker run command:
docker volume create beszel_data && \
docker run -d \
  --name beszel \
  --restart=unless-stopped \
  --volume beszel_data:/beszel_data \
  -e APP_URL=http://localhost:8090 \
  -p 8090:8090 \
  henrygd/beszel
If you want to do a bind mount, here is an example from my home lab:
services:
  beszel:
    image: henrygd/beszel
    container_name: beszel
    restart: unless-stopped
    environment:
      - APP_URL=http://10.1.149.20:8090
    ports:
      - 8090:8090
    volumes:
      - /home/linuxadmin/homelabservices/beszel:/beszel_data
Then we just do a docker compose up -d to bring up the beszel container:
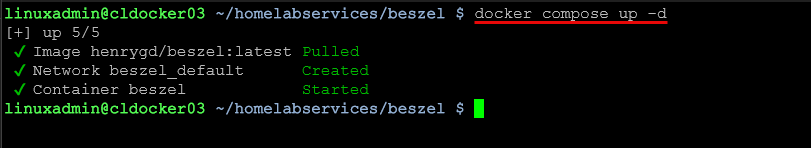
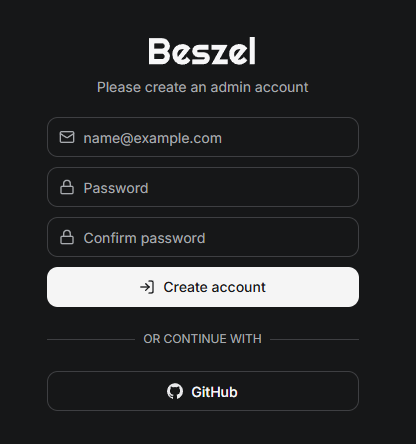
Now, all we need to do is browse out to our Docker host on port 8090. You will be prompted to create your admin account for Beszel. Enter an email address and then create a password and confirm it. You can also use your GitHub account also.
Adding your first system
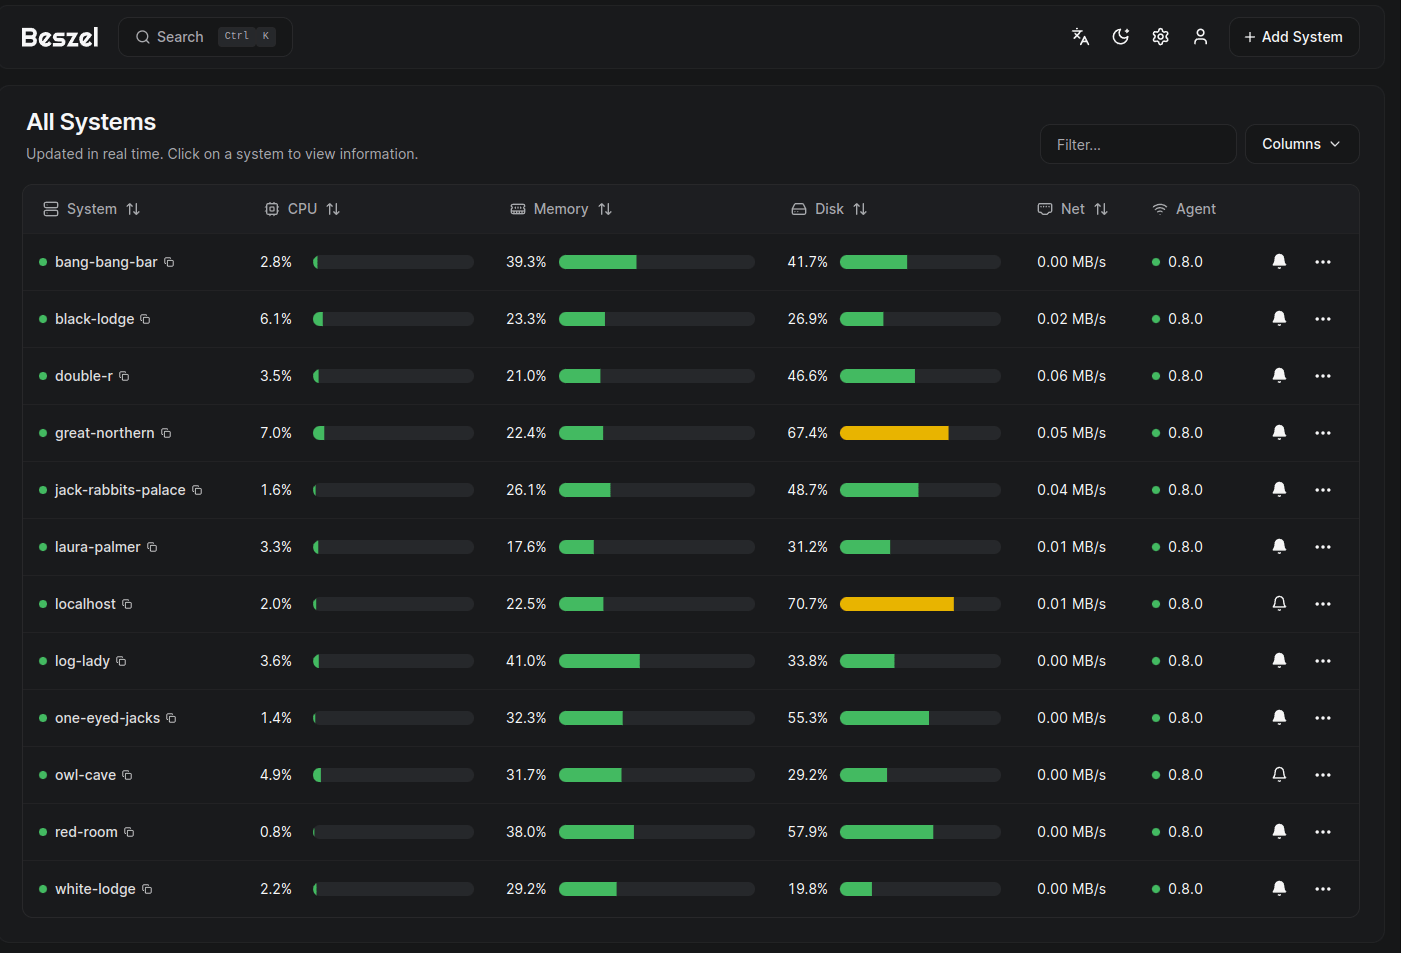
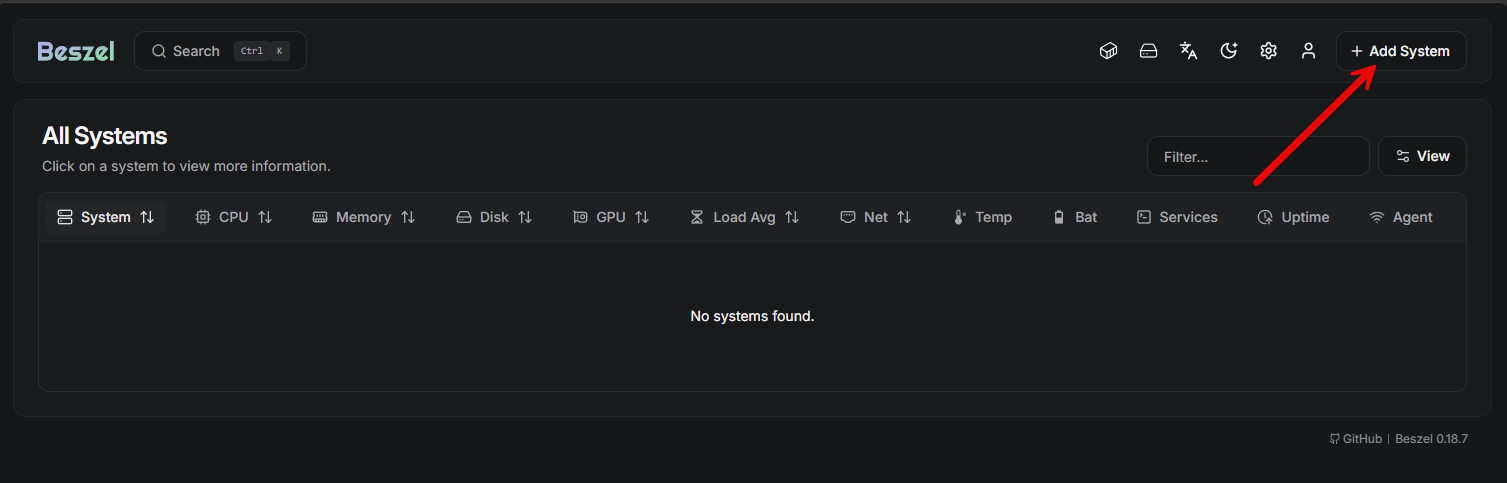
Once you create the first admin account from the dialog box above, you then will see the blank Beszel dashboard where you can add your first system. Here you will click the + Add System button in the upper right-hand corner.
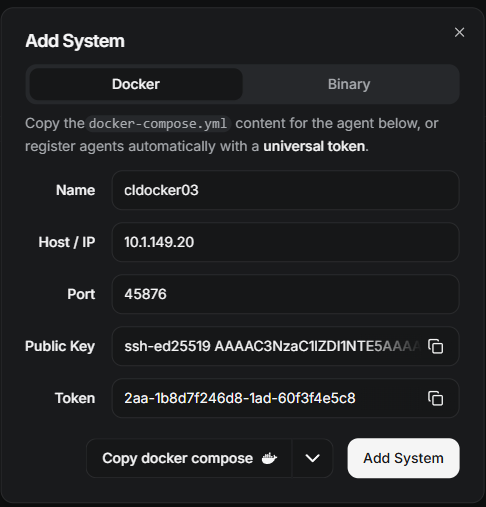
After you click the button, it will launch the Add System dialog box. Here you have two choices. You can add a system by running the Beszel Docker agent container, or you can add it using the installable binary for non Docker hosts.
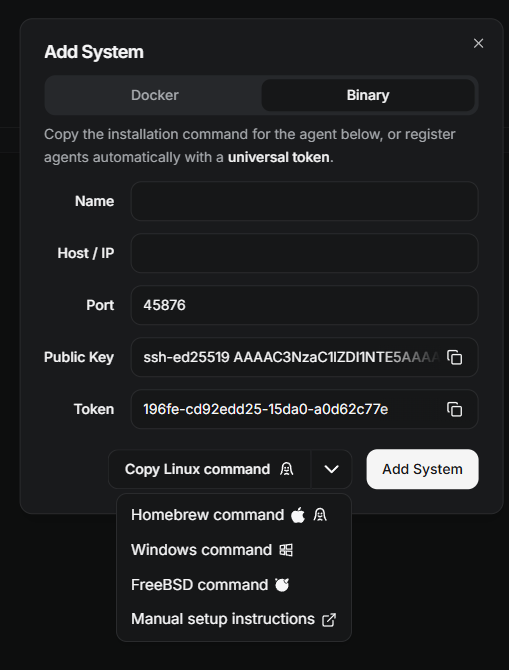
Below is a look at the Binary option. There is actually a wide selection of options here. It is not just Linux hosts which you can add. You can also add using:
- Homebrew
- Windows
- FreeBSD
- using Manual setup instrutions
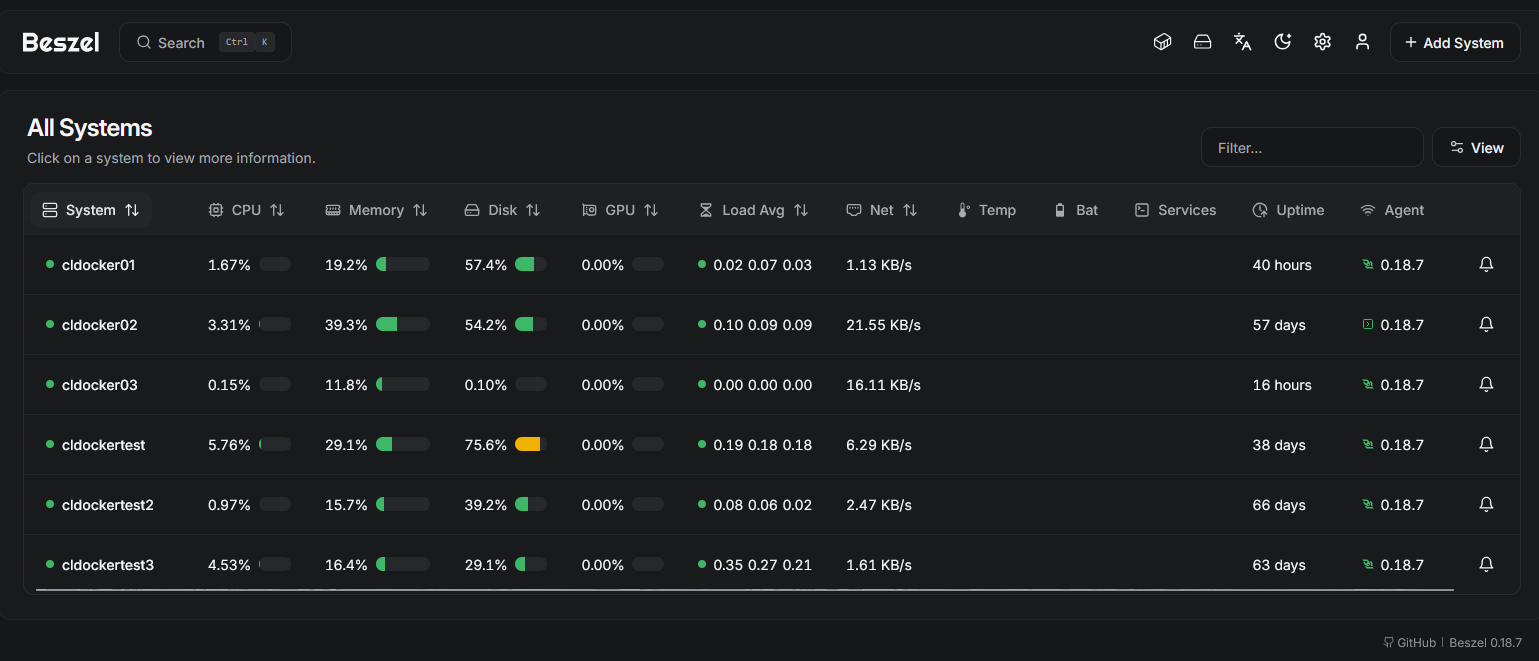
After I added the Beszel docker agent, it immediately started to stream statistics and metrics into the Beszel dashboard.
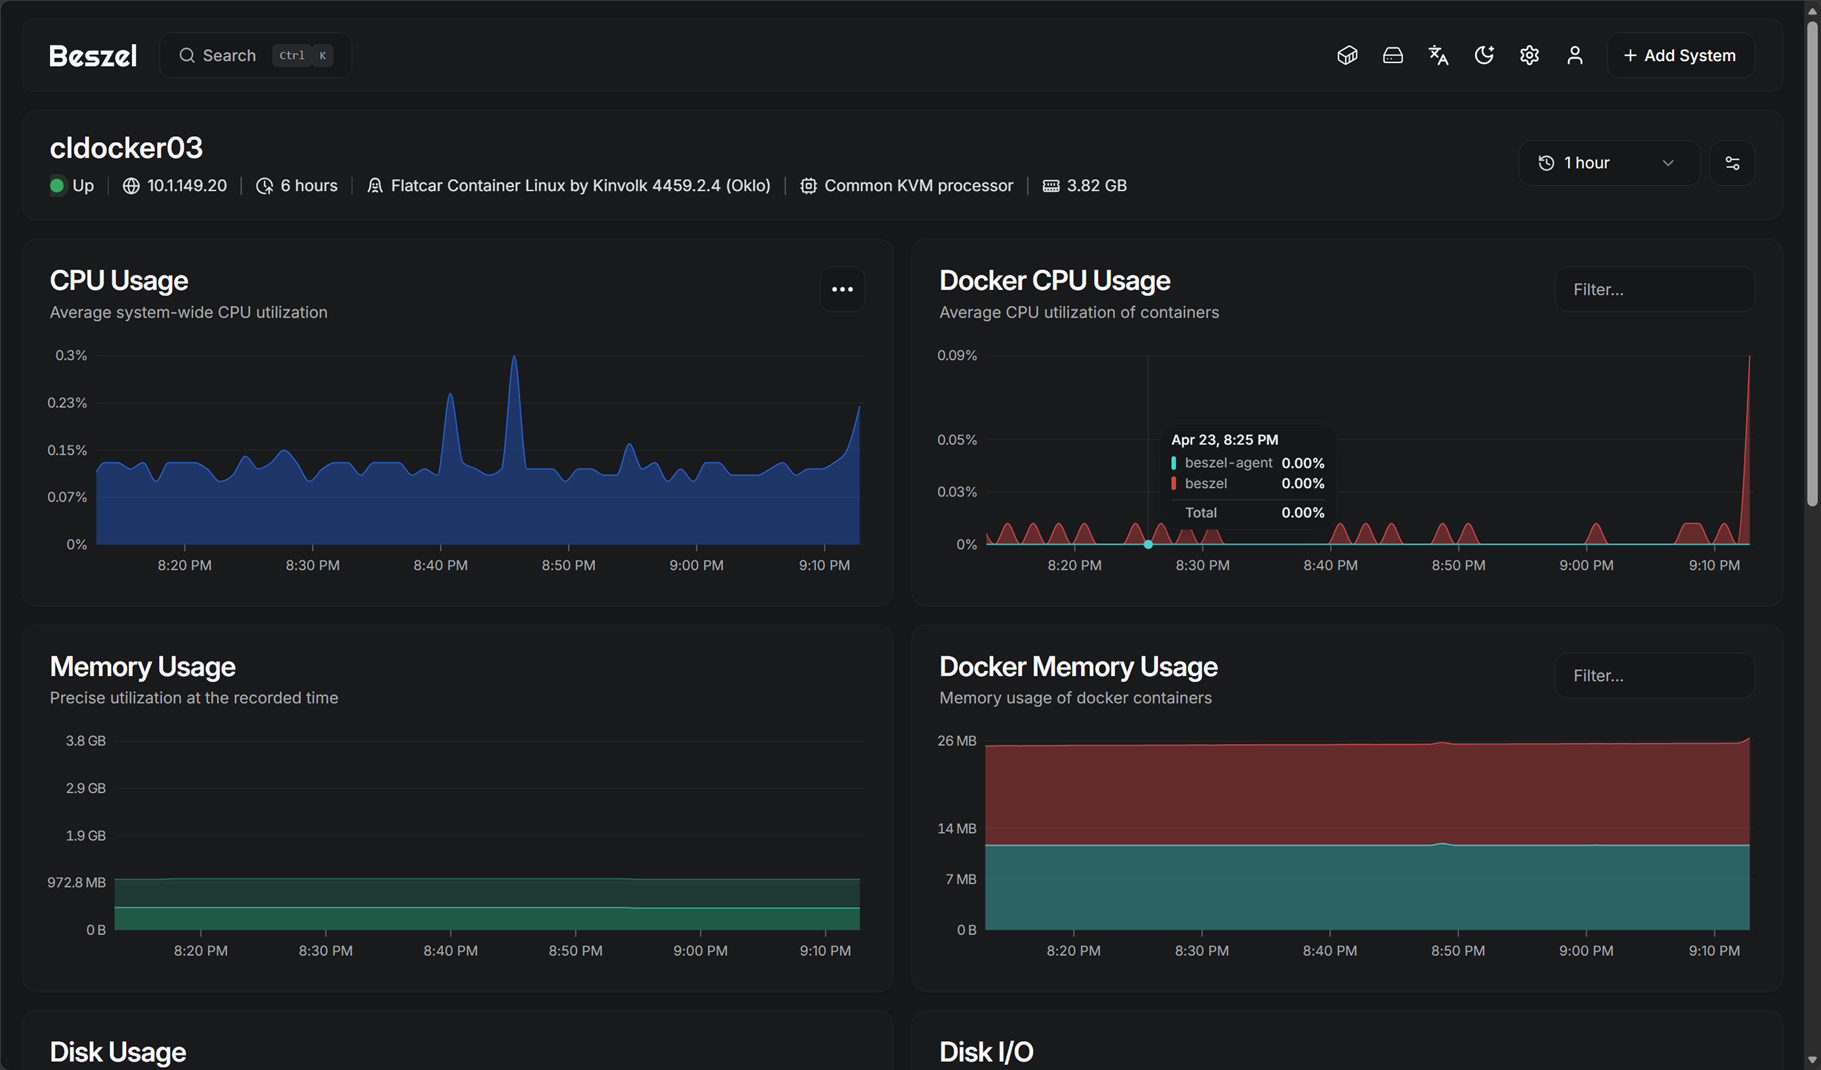
If you click on the host, you will get taken to the much more detailed view of the specific host, showing the CPU, Docker CPU usage, disk usage, and disk i/o.
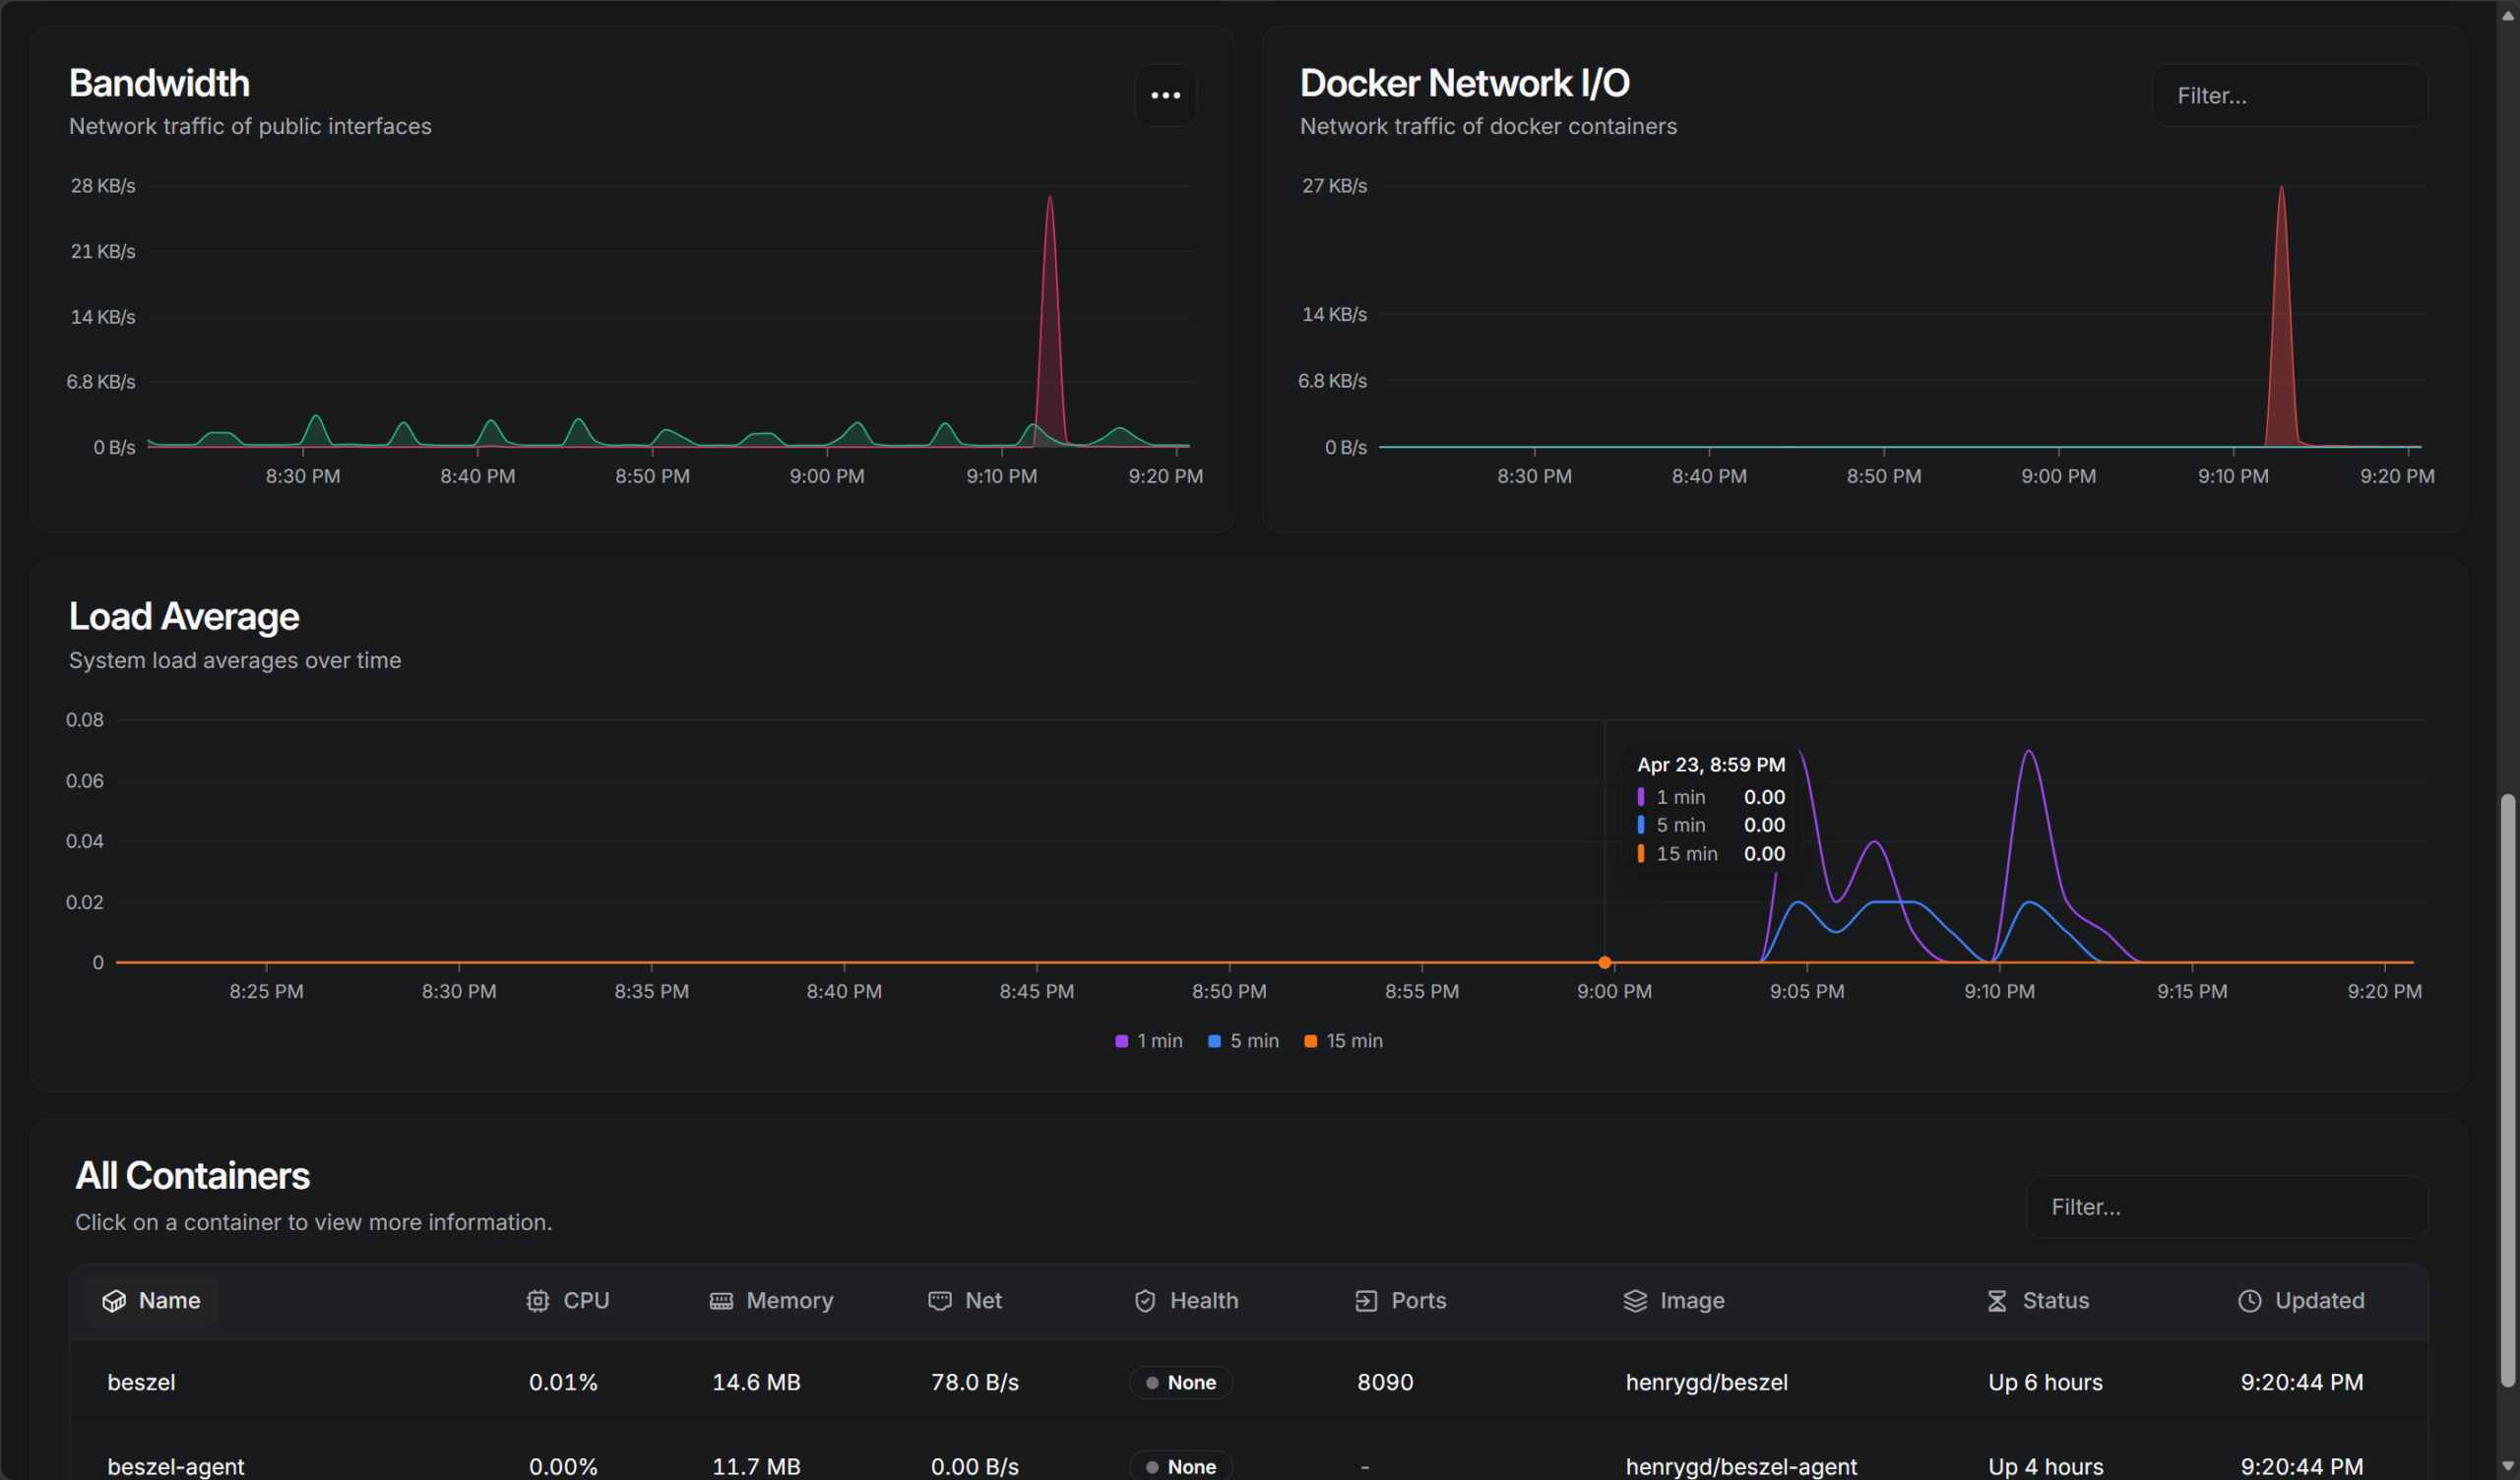
Scrolling further down the same screen, you can see bandwidth, docker network i/o, load average, and an “all containers” view on the host.
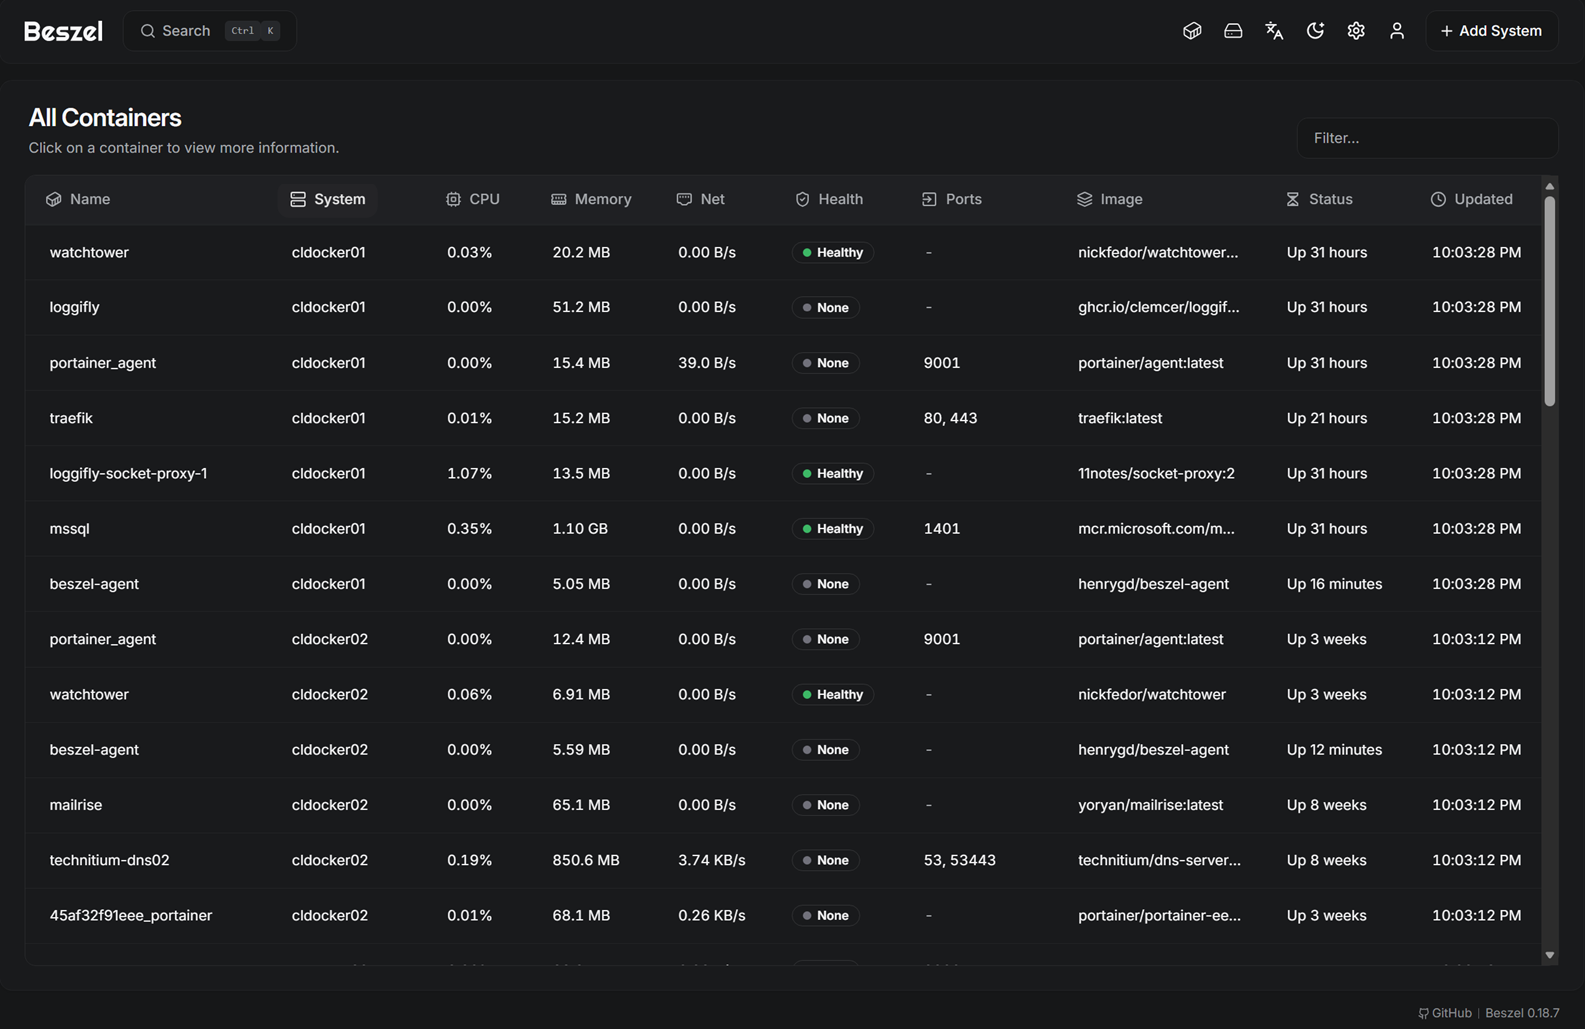
You can also click the “containers” icon, which is the first icon in the upper right hand menu of icons, and it will show you literally “all containers” across all systems you have added. I really like this as if you are like me and run tons of containers, sometimes you forget which host the container is running on. This is a great way to quickly find a specific container.
Alerts and notifications
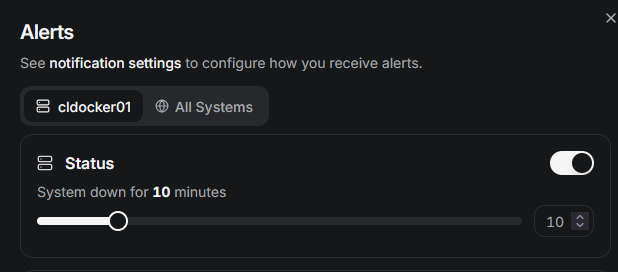
A good monitoring solution has a means to notify you when thresholds reach a certain metric where it triggers an alert. Beszel has a very simple but effective alerting solution built into the platform. You can easily turn on alerts globally or in a granular fashion for each “system” you add to the hub.
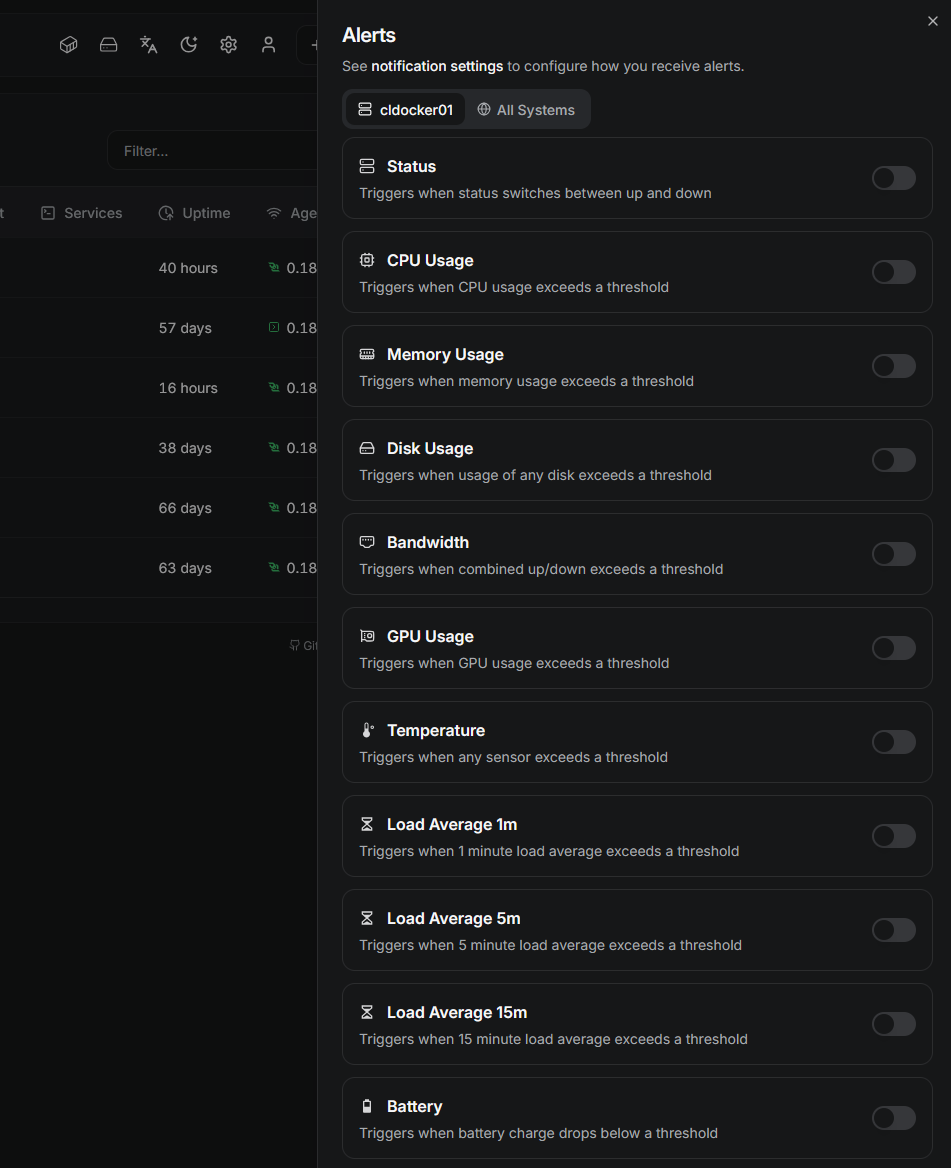
One of the things I really like about configuring Beszel alerts and notifications is how simple this configuration process is. It doesn’t overwhelm you with “nerd knobs”, but instead you have a simple toggle you flip on and then a slider to configure the threshold before it notifies you.
Configuring the notifications for alerting is found under the “settings” of the Beszel hub. Click Notifications:
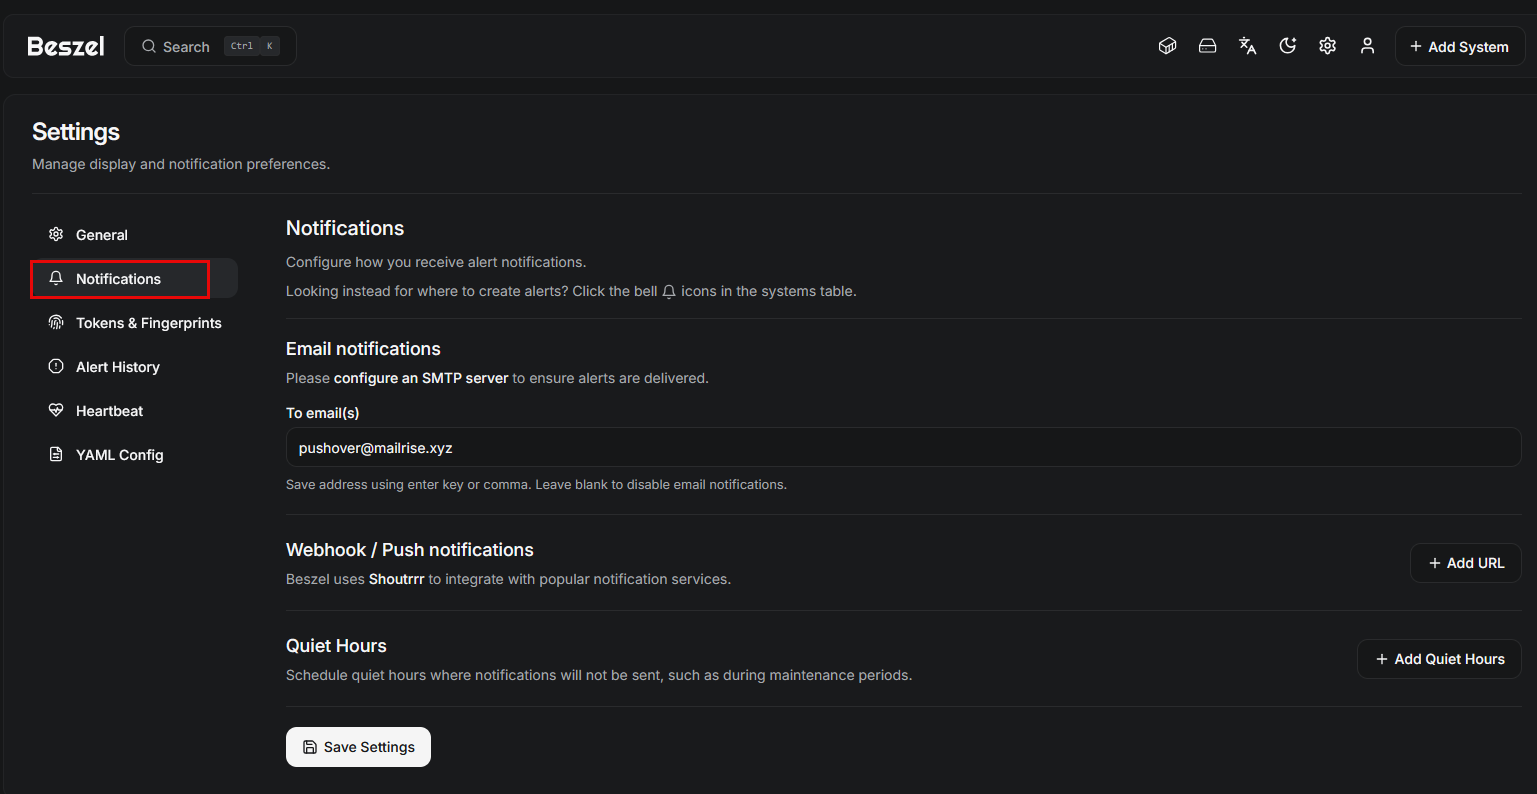
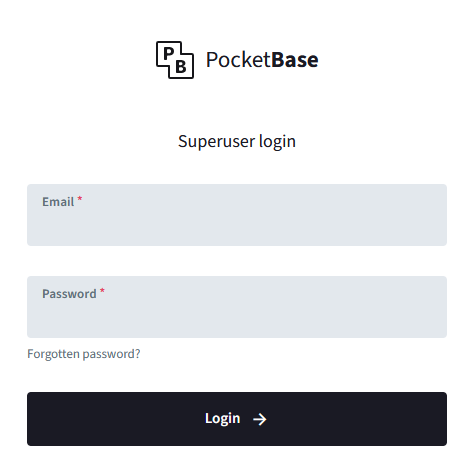
When you click the link to configure an SMTP server, you will be taken to a login for PocketBase included with the Hub deployment. Login with the same password as you do for your hub server:
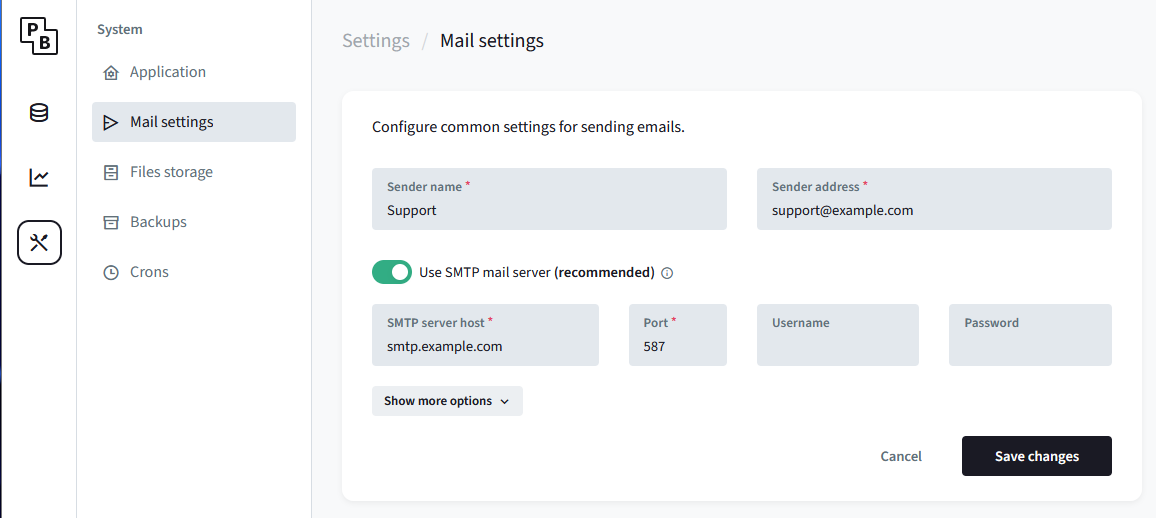
Click the settings icon on the left menu and then click Mail settings.
Performance and resource usage
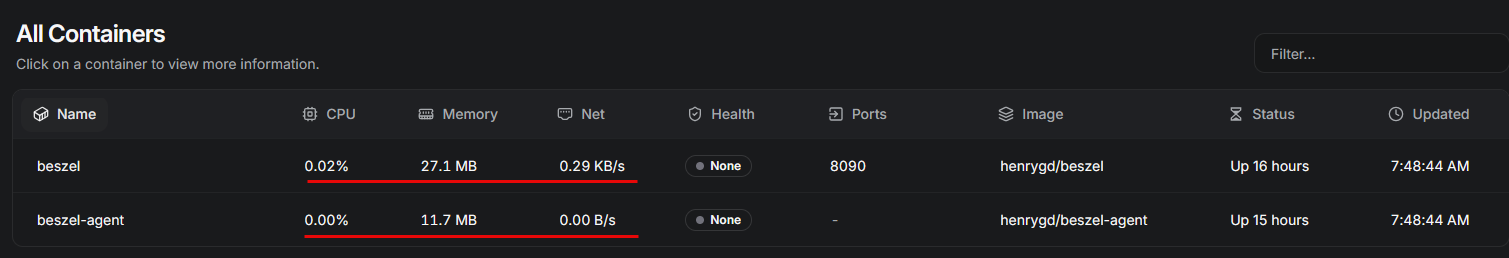
One of my biggest concerns when evaluating any monitoring tool is how much overhead it introduces. Monitoring systems can easily become one of the heavier workloads in a lab if you are not careful. I think this is another area where Beszel really shines compared to some solutions.
Below is a look at the resource statistics of the Beszel Hub, which is managing 7-8 docker hosts with 100 containers or so.
Beszel pros and cons
Below is a quick look at the pros and cons of using Beszel for lightweight home lab monitoring:
| Pros | Cons |
|---|---|
| Ideal for home labs | Probably not suited for enterprise environments |
| Great for small environments | Lacks advanced alerting workflows |
| Lightweight and low resource usage | No deep application-level metrics |
| Fast setup and easy deployment | Limited query capabilities |
| Quick visibility into system health | Not built for long-term metric retention |
| Simple and easy to use | Limited integration with enterprise tools |
| Minimal maintenance required | Not a full observability platform |
For most home lab environments, I think Beszel provides just the right amount of visibility and monitoring for container-heavy environments.
Wrapping up
All in all, I think if you are looking for a lightweight monitoring tool home lab configuration, Beszel is absolutely a great choice. For me it covers all the bases that most need for monitoring, while not being too heavy and cumbersome to install and maintain. After all, most of us don’t want a solution that you spend more time managing than you do your actual applications and self-hosted services in the home lab.
More in this topic


Discuss this in the Community
Google is updating how articles are shown. Don’t miss our leading home lab and tech content, written by humans, by setting Virtualization Howto as a preferred source.
About The Author

Great post! Thanks so much. I need to install Beszel on my home server.
Jim,
You will really like it as a solution. It is simple and easy and gives the key metrics at a glance I think that most care about.
Brandon
Someone likes Twin Peaks.
😁😁😁