Recently, I have been reviewing a lot of mini PCs in the home lab and even transitioning some of my workloads to these small footprint devices. In general, they perform really well. However, in testing for stability and other factors on this platform, especially with hybrid CPU configurations, I wanted to take look at home server stress test solutions to really put the heat on the hardware to make sure evertyhing is stable and performs as expected.
Table of contents
Home Server Stress Testing
A home server can run a wide range of services. These services can include file sharing and data storage to more complex service like running web applications or hosting a game server. The purpose of a stress test is to simulate high-demand scenarios that push your home server’s CPU, RAM, disk storage, and network capabilities to their limits.
Running a stress test requires the right tools for the job to simulate demand in such a way that actually places load across the various components of your home server.
Tools for stress testing your server
There are quite a few tools that are free and open-source found in Linux (can be installed without ads or an account and you don’t have to sign in, etc) that allow stress testing to evaluate performance. These include tools that test your CPU and RAM, stress tests to disk I/O, and tools to simulate network throughput. These tools may include stress, sysbench, iperf3, and hdparm.
There is another tool I would like to introduce you to if you haven’t seen or heard about it as well. It is the S-TUI tool. The neat thing about this tool is that it provides a graphical interface of sorts that allows you to either monitor or stress the machine you are running it on.
Installing S-TUI
Installing S-TUI in Ubuntu is easy. You can do that with the single command:
sudo apt install s-tui -y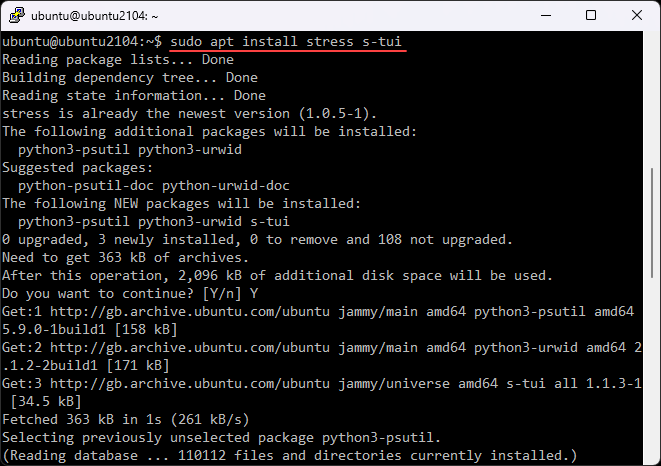
Installing the stress tool
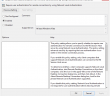
To use the S-TUI tool for running stress tests, we need to install the stress tool. If you don’t install the stress module, you will see this by default when you launch s-tui:
We can install the stress tool with the following:
sudo apt install stress -y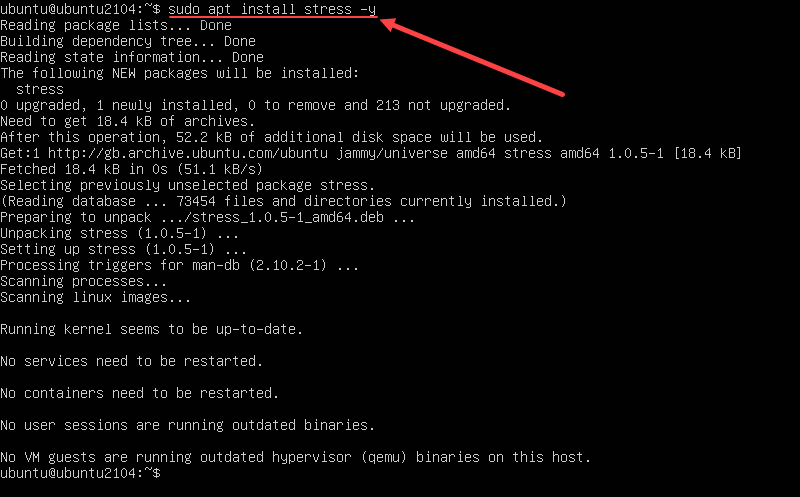
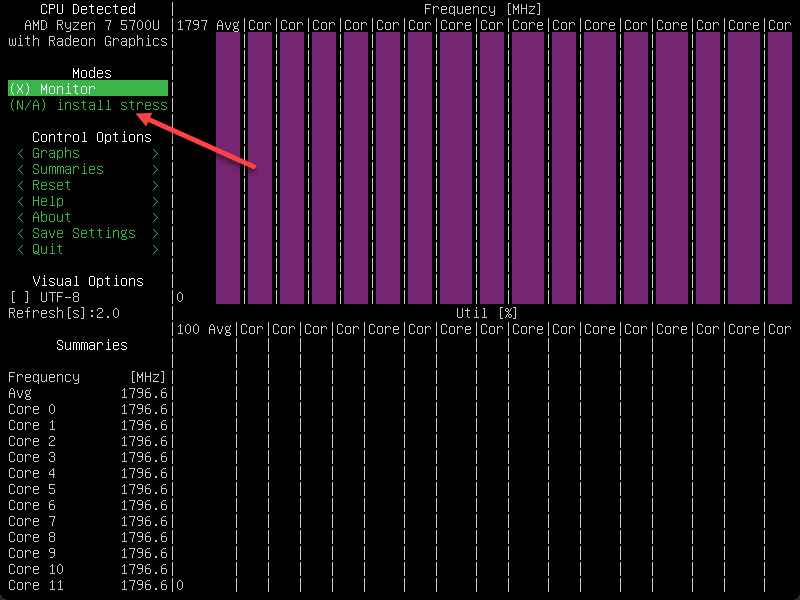
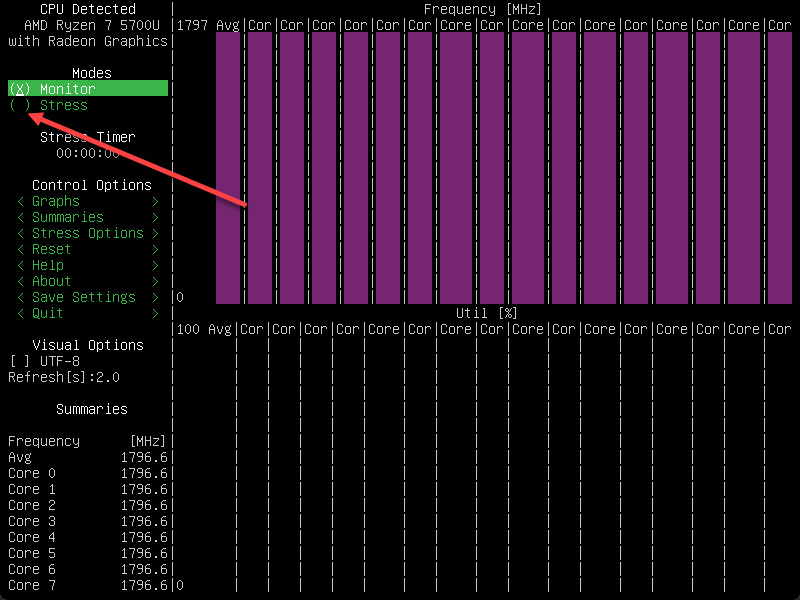
Once we install the stress tool, we will see this option available to us now when launching the s-tui tool.
As a side note, you can run the stress utility on its own without the S-TUI tool. You can see the parameters if you run the stress command:
stress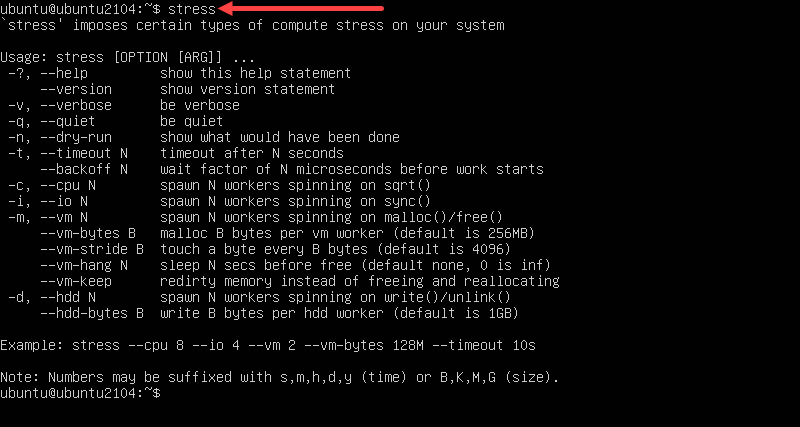
Get your CPU cores from Linux
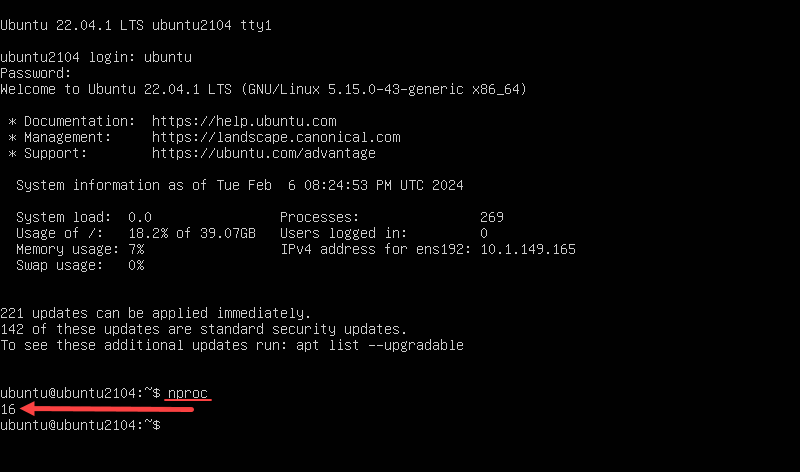
Before we start load testing, we want to know how many cores we have configured and available to us in Linux. One of the easy ways to see the number of cores assigned to your VM or on your physical machine is using the command:
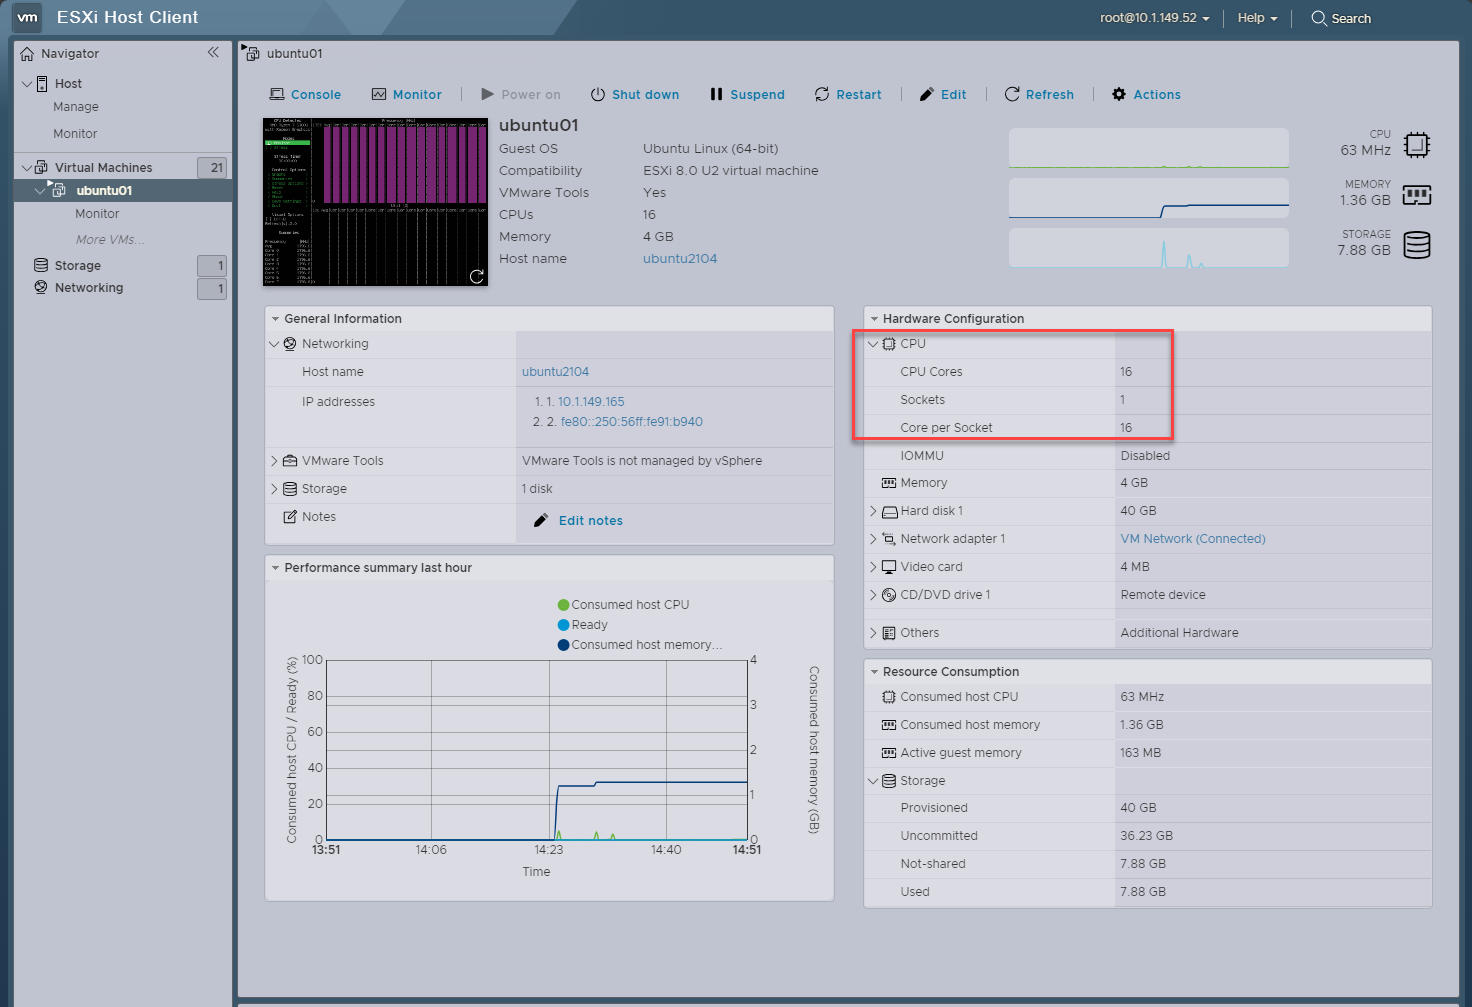
nprocWith nproc, you can quickly get the number of cores available. Below, you can see I have assigned 16 cores to my Ubuntu Server 22.04 LTS virtual machine. This is the total number of cores available to the VM from the host ESXi server, which I am running on top of a GMKtek M5 with a Ryzen 5700U processor.
Below, you can see the configuration for the virtual machine I have configured for CPU stress testing.
CPU Load Testing with the S-TUI tool
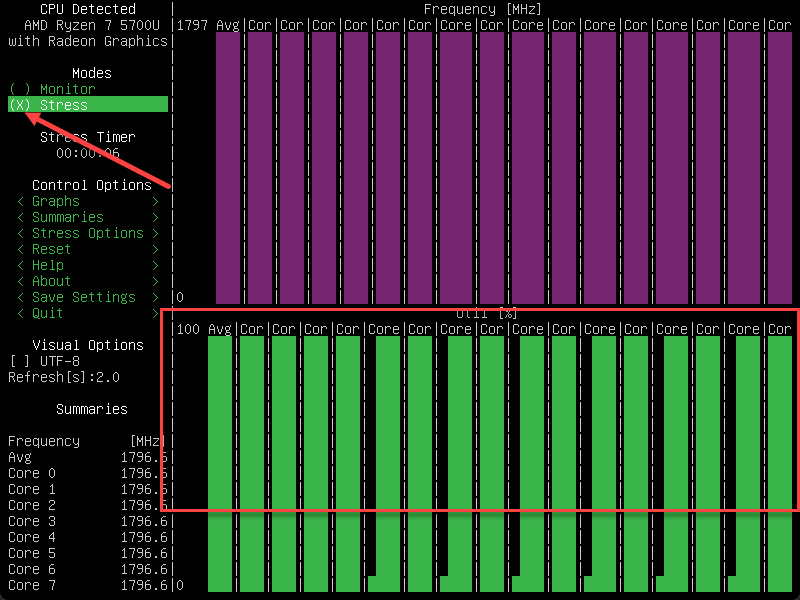
Using the S-TUI tool, you can stress your CPU in your virtual machines or your bare metal machine running Linux. When you install the S-TUI tool, you can then launch it from the command line with the intuitive command:s-tui
Now let’s select the Stress option. We can see the CPU graphs for used % go to 100%. For comparison you can see the image below with the green bars, compared to the image above.
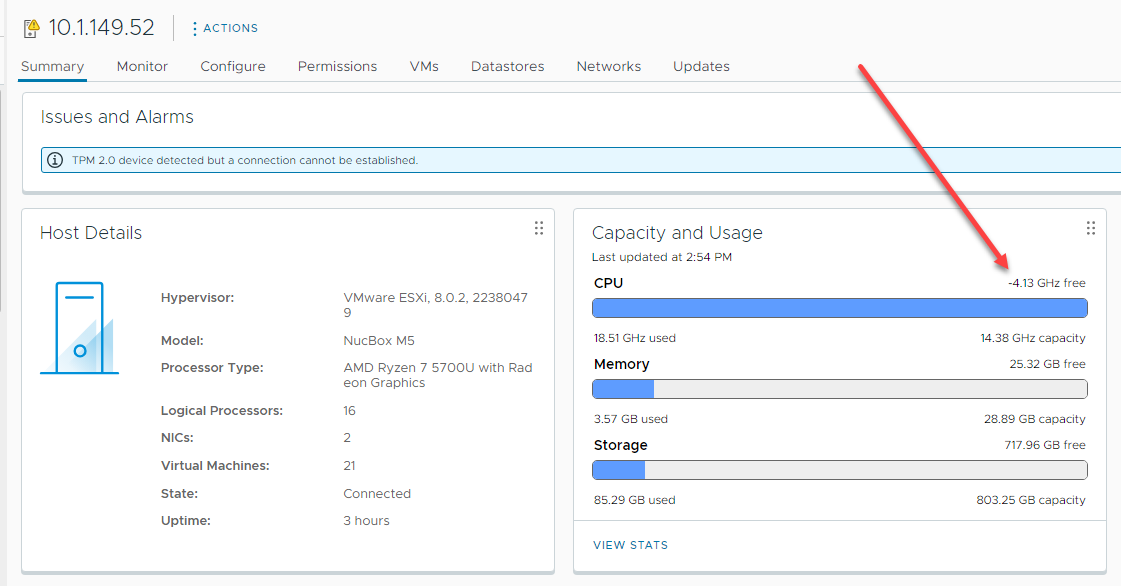
Also, if we monitor this in the vSphere Client if the host is connected to vCenter Server, or if we are connected directly to the host client, we see we have effectively saturated the CPUs with utilization.
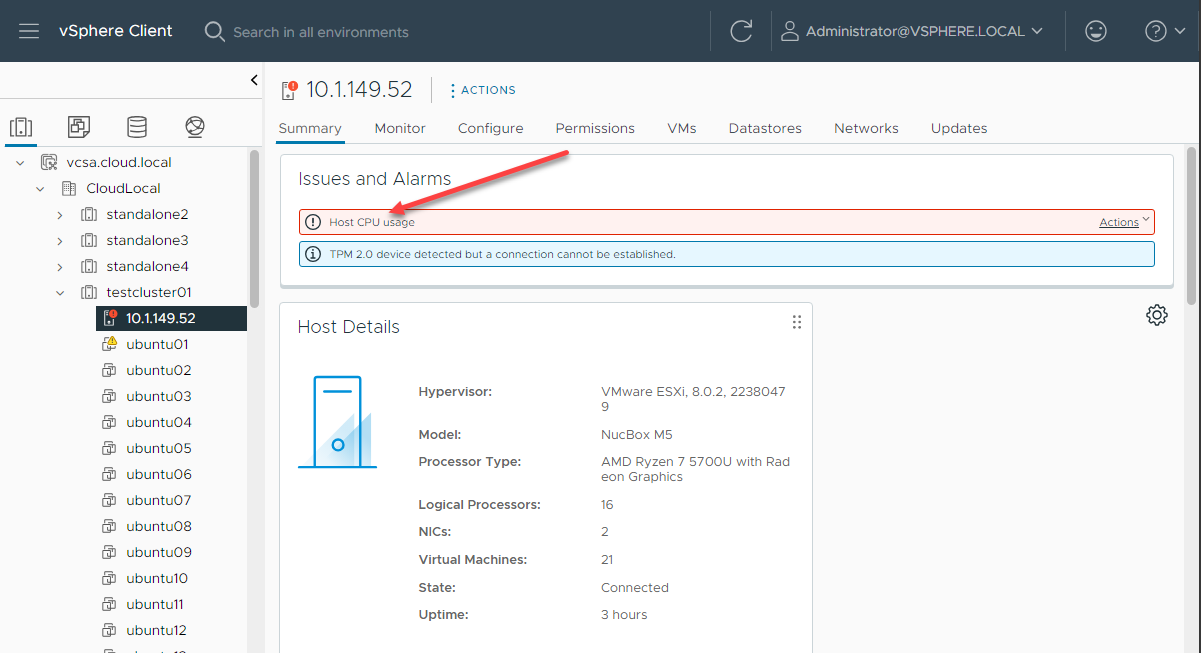
After a bit, I was able to even get the warning in the vSphere Client of host CPU usage.
By running a CPU stress test on your server for a period of time you can gauge the CPU’s stability and thermal performance, power consumption, etc. It helps to ensure you don’t see overheating or throttling.
RAM Stress Testing
RAM is another critical component that affects tje pverall speed and responsiveness of your server. Stress testing RAM involves filling it to capacity and performing read/write operations to check for errors and stability issues and the need for any diagnostics.
We can use the stress tool from the command line. For instance, if you have 4 gigs of memory assigned, you can use the following to stress test your memory allocated.
stress --vm 4 --vm-bytes 1024M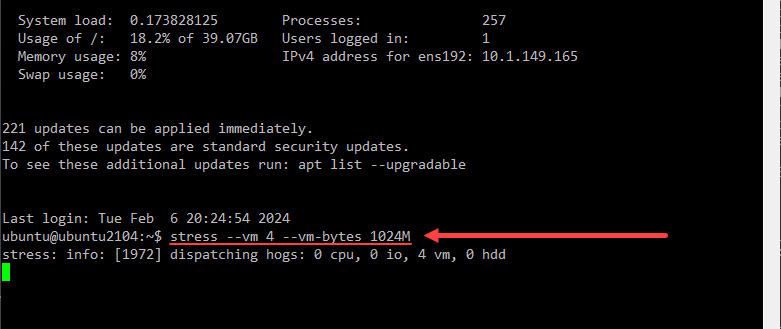
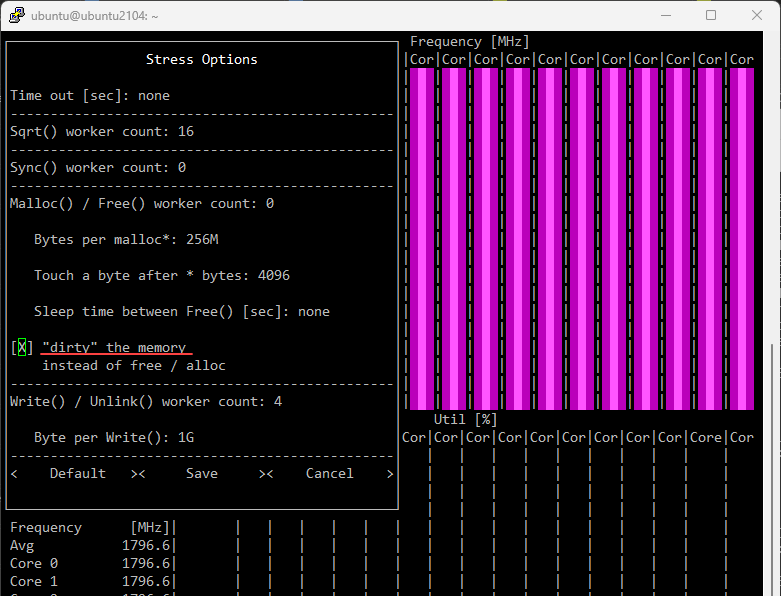
In the S-TUI tool options, we can also affect the memory as well. Note the options:
- Bytes per malloc*
- Touch a byte after * bytes
- Sleep time between free
- Dirty the memory
Disk stress testing
Disk stress testing is also extremely important. Especially if you are running virtualization solutions that rely on quick disk access, it is good to find any problems before you begin running your workloads and accessing files or running block storage. It can evaluate both the read and write speeds, latency, response time, etc of your storage media, including HDDs, SSDs, and even NVMe drives.
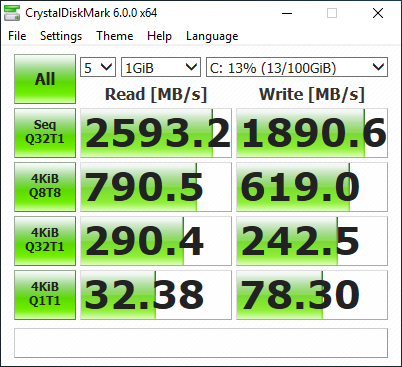
Generally, there are a large number of benchmarking tools and disk speed tests. You can use the more traditional type tools like the CrystalDiskMark utility. Below is a screenshot of the results of a disk test I had ran quite some time ago. The version is likely old in the screesnhot at this point.
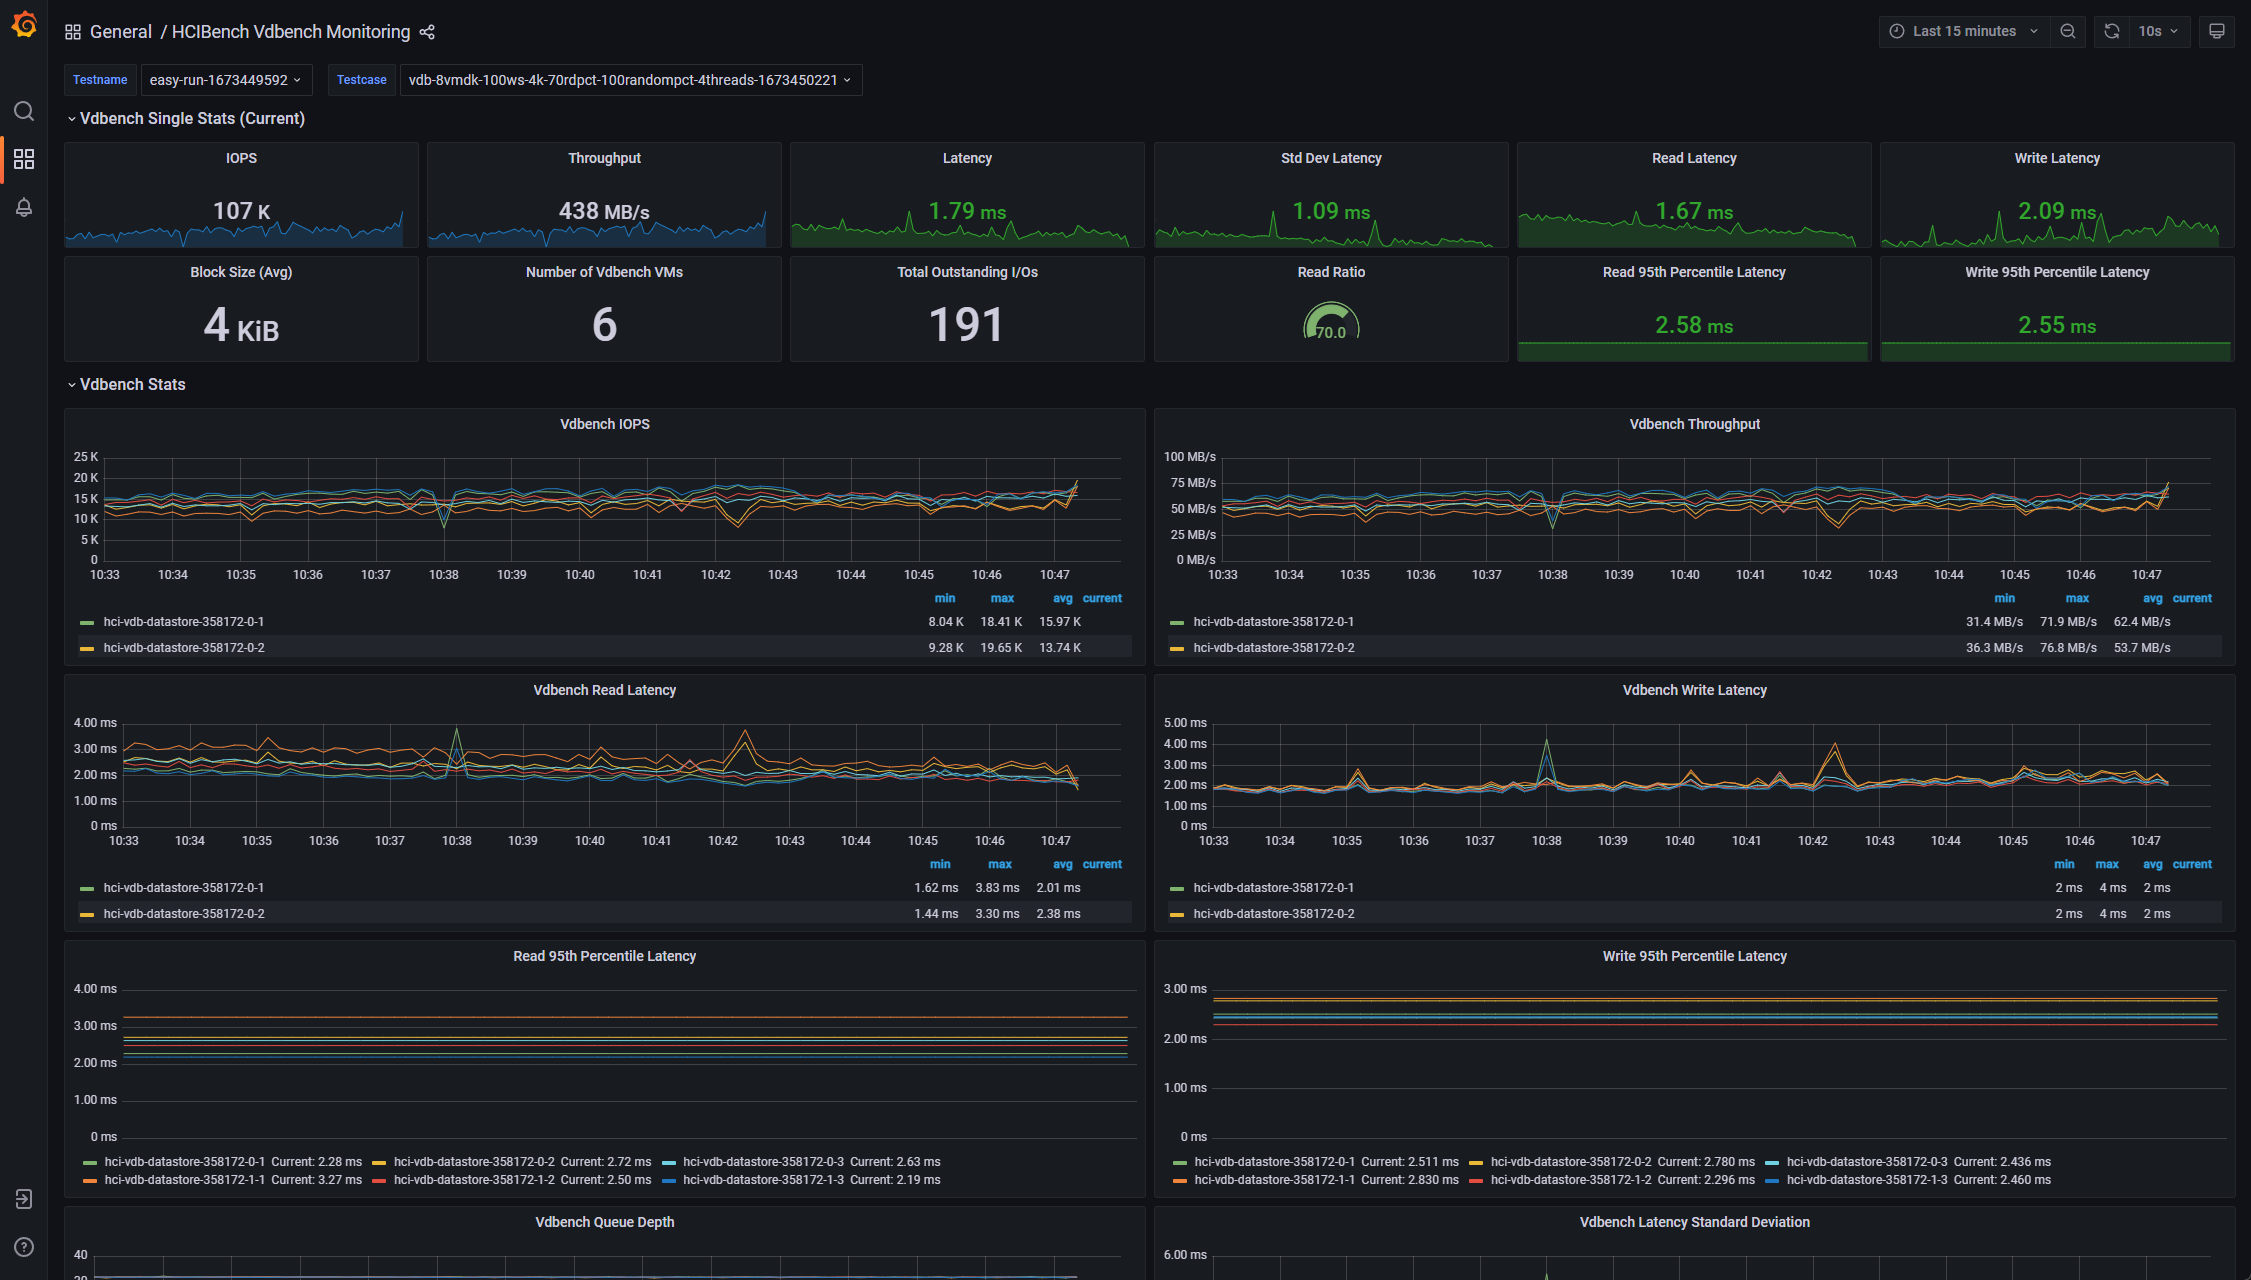
For HCI solutions, you can’t really run something like CrystalDiskMark. HCI solutions built on top of object storage need a benchmarking solution that is built for that use case and the scalability of object storage.
The HCIbench solution I have written about before is a great way to benchmark your VMware vSAN solution, if you are running VMware.
Read my HCI Bench post when I introduced Intel Optane to my home lab: Configure HCI Bench for VMware vSAN Performance Testing. HCI Bench has a nice graphical user interface (GUI) for your HCI test.
Network Throughput
If along with a new home server, you have upgraded your network to 10 gig or even 25 gig, you will likely want to know you are getting the throughput expected.
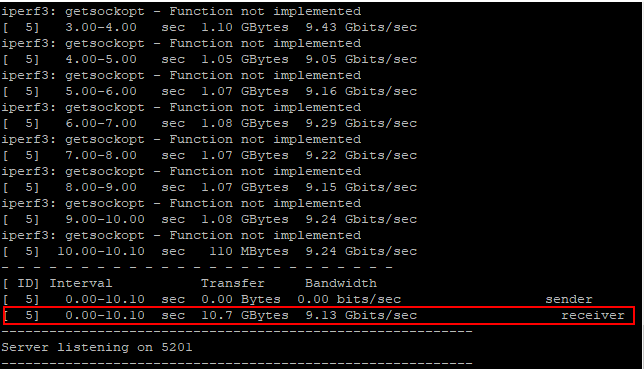
Testing network performance involves measuring both the upload and download speeds, as well as the stability of connections over time. There is a widely recognized network tool called iperf3 that allows simulating high-traffic between servers.
Essentially, you setup one server as the iperf3 server listener, and the other is setup as the iperf3 client.
Check out my post here covering how to use iperf to test network performance between hosts: Run Basic Network Speed Bandwidth Throughput Test Between ESXi Hosts.
Power Consumption
An often overlooked aspect of home server testing is power consumption. A server that’s efficient under load not only saves on electricity bills but also generates less heat and has lower temperature readings, needing less cooling. This helps with the lifespan (endurance) of the components and many other benefits.
Monitoring power usage during the torture test provides insights into how well the server performs under different stress levels. This is one test that you will need a piece of hardware to really test effectively. I have a very cheap power meter I snagged on Amazon for testing power consumption.
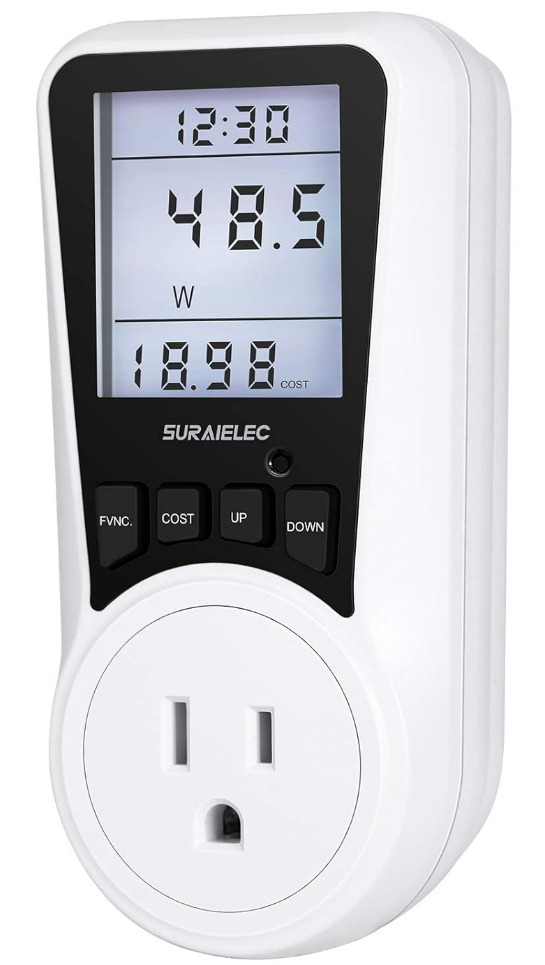
You can use a power meter like this in conjunction with the CPU torture test to get an idea of what kind of power consumption you are seeing running a worst-case scenario (100% CPU) so you know what it will amount to.
Wrapping up home server stress testing
Running repeated torture tests, especially after making changes to your server’s hardware or software configuration helps you understand how performance and power profiles might change. It can also help with an analysis to understand if something knew might affect reliability.
System optimization using various torture tests and performance benchmarks can help “burn in” a new server, and definitely understand the performance you can expect. As mentioned several times, it also helps to discover potential stability issues before you place workloads on them.
Hopefully this post has been enlightening on a few resources you can use for torture testing for performance, diagnostics and troubleshooting, and power consumption. Keep in mind, there are other benchmarking areas that may apply in your home server environment, such as graphics cards (gpu) benchmarking or web server load testing (apache and others). There is likely a tool for your needs that has already been developed outside of the ones we have looked at in this post.
Google is updating how articles are shown. Don’t miss our leading home lab and tech content, written by humans, by setting Virtualization Howto as a preferred source.
About The Author