Kubernetes Monitoring Tools with Prometheus and Grafana
Kubernetes monitoring and effective monitoring at that can be done with effective free and open source solutions like Prometheus and Grafana. Both of these solutions when used together can help monitor your modern infrastructure with Kubernetes.
Table of contents
What is Prometheus?
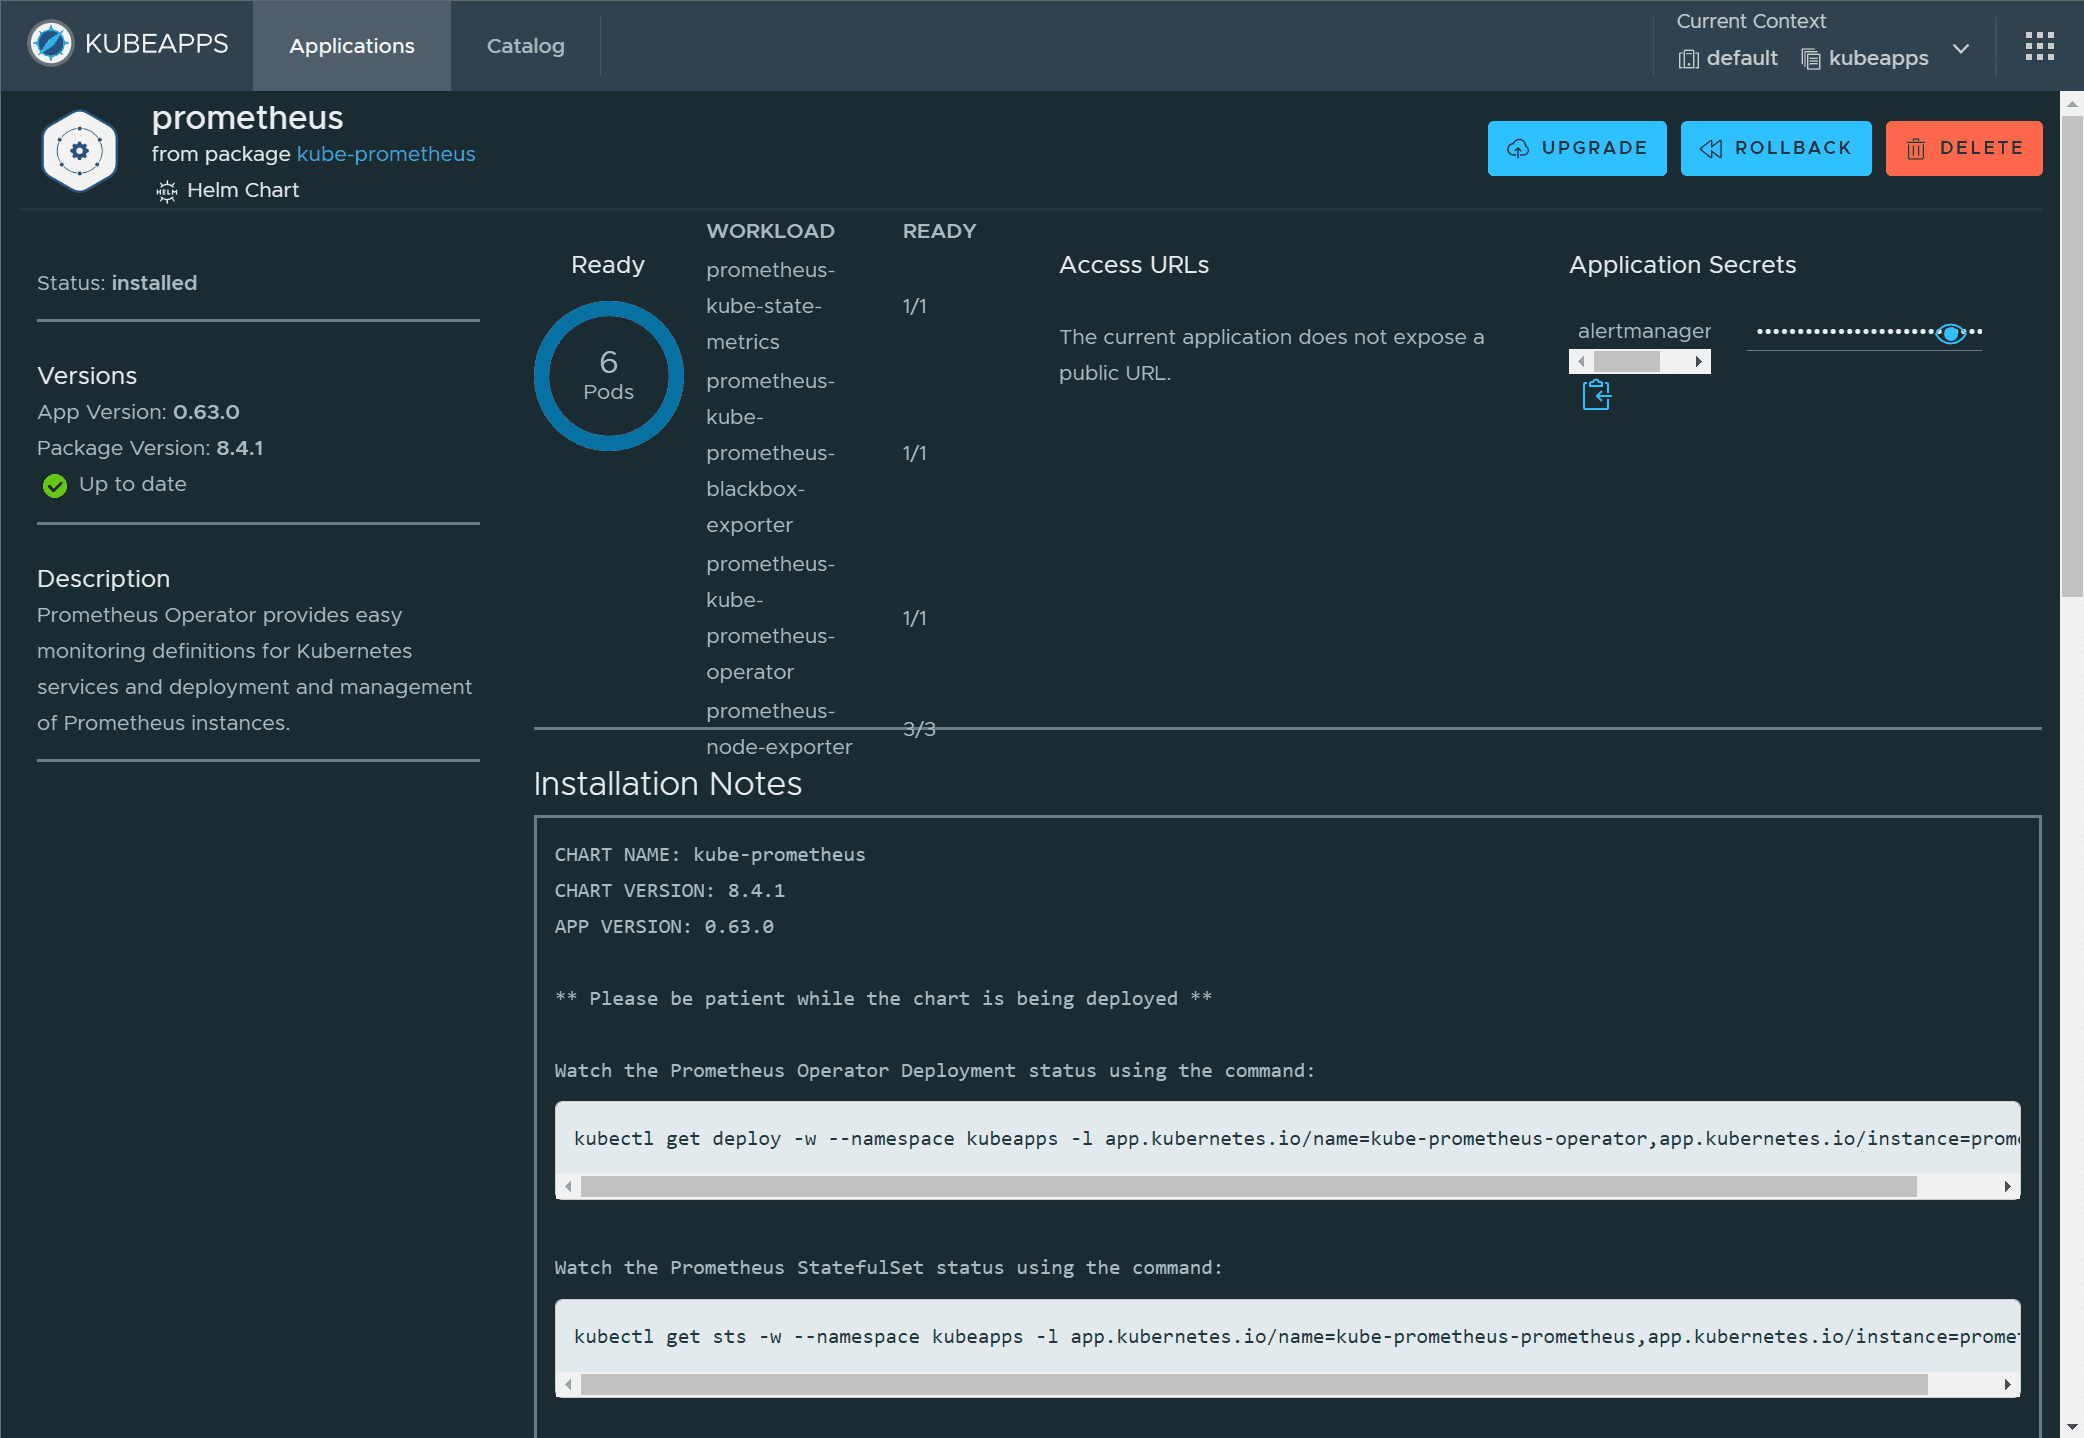
What is Prometheus?
Prometheus is an open-source systems monitoring and alerting solution. It is designed for collecting and storing metrics as a time services data collection. It also has its own query language called PromQL to enable working with the data as needed. Also, Prometheus has a data model that admins can use that is good for dynamic cloud environments and can monitor apps and infrastructure like K8s.
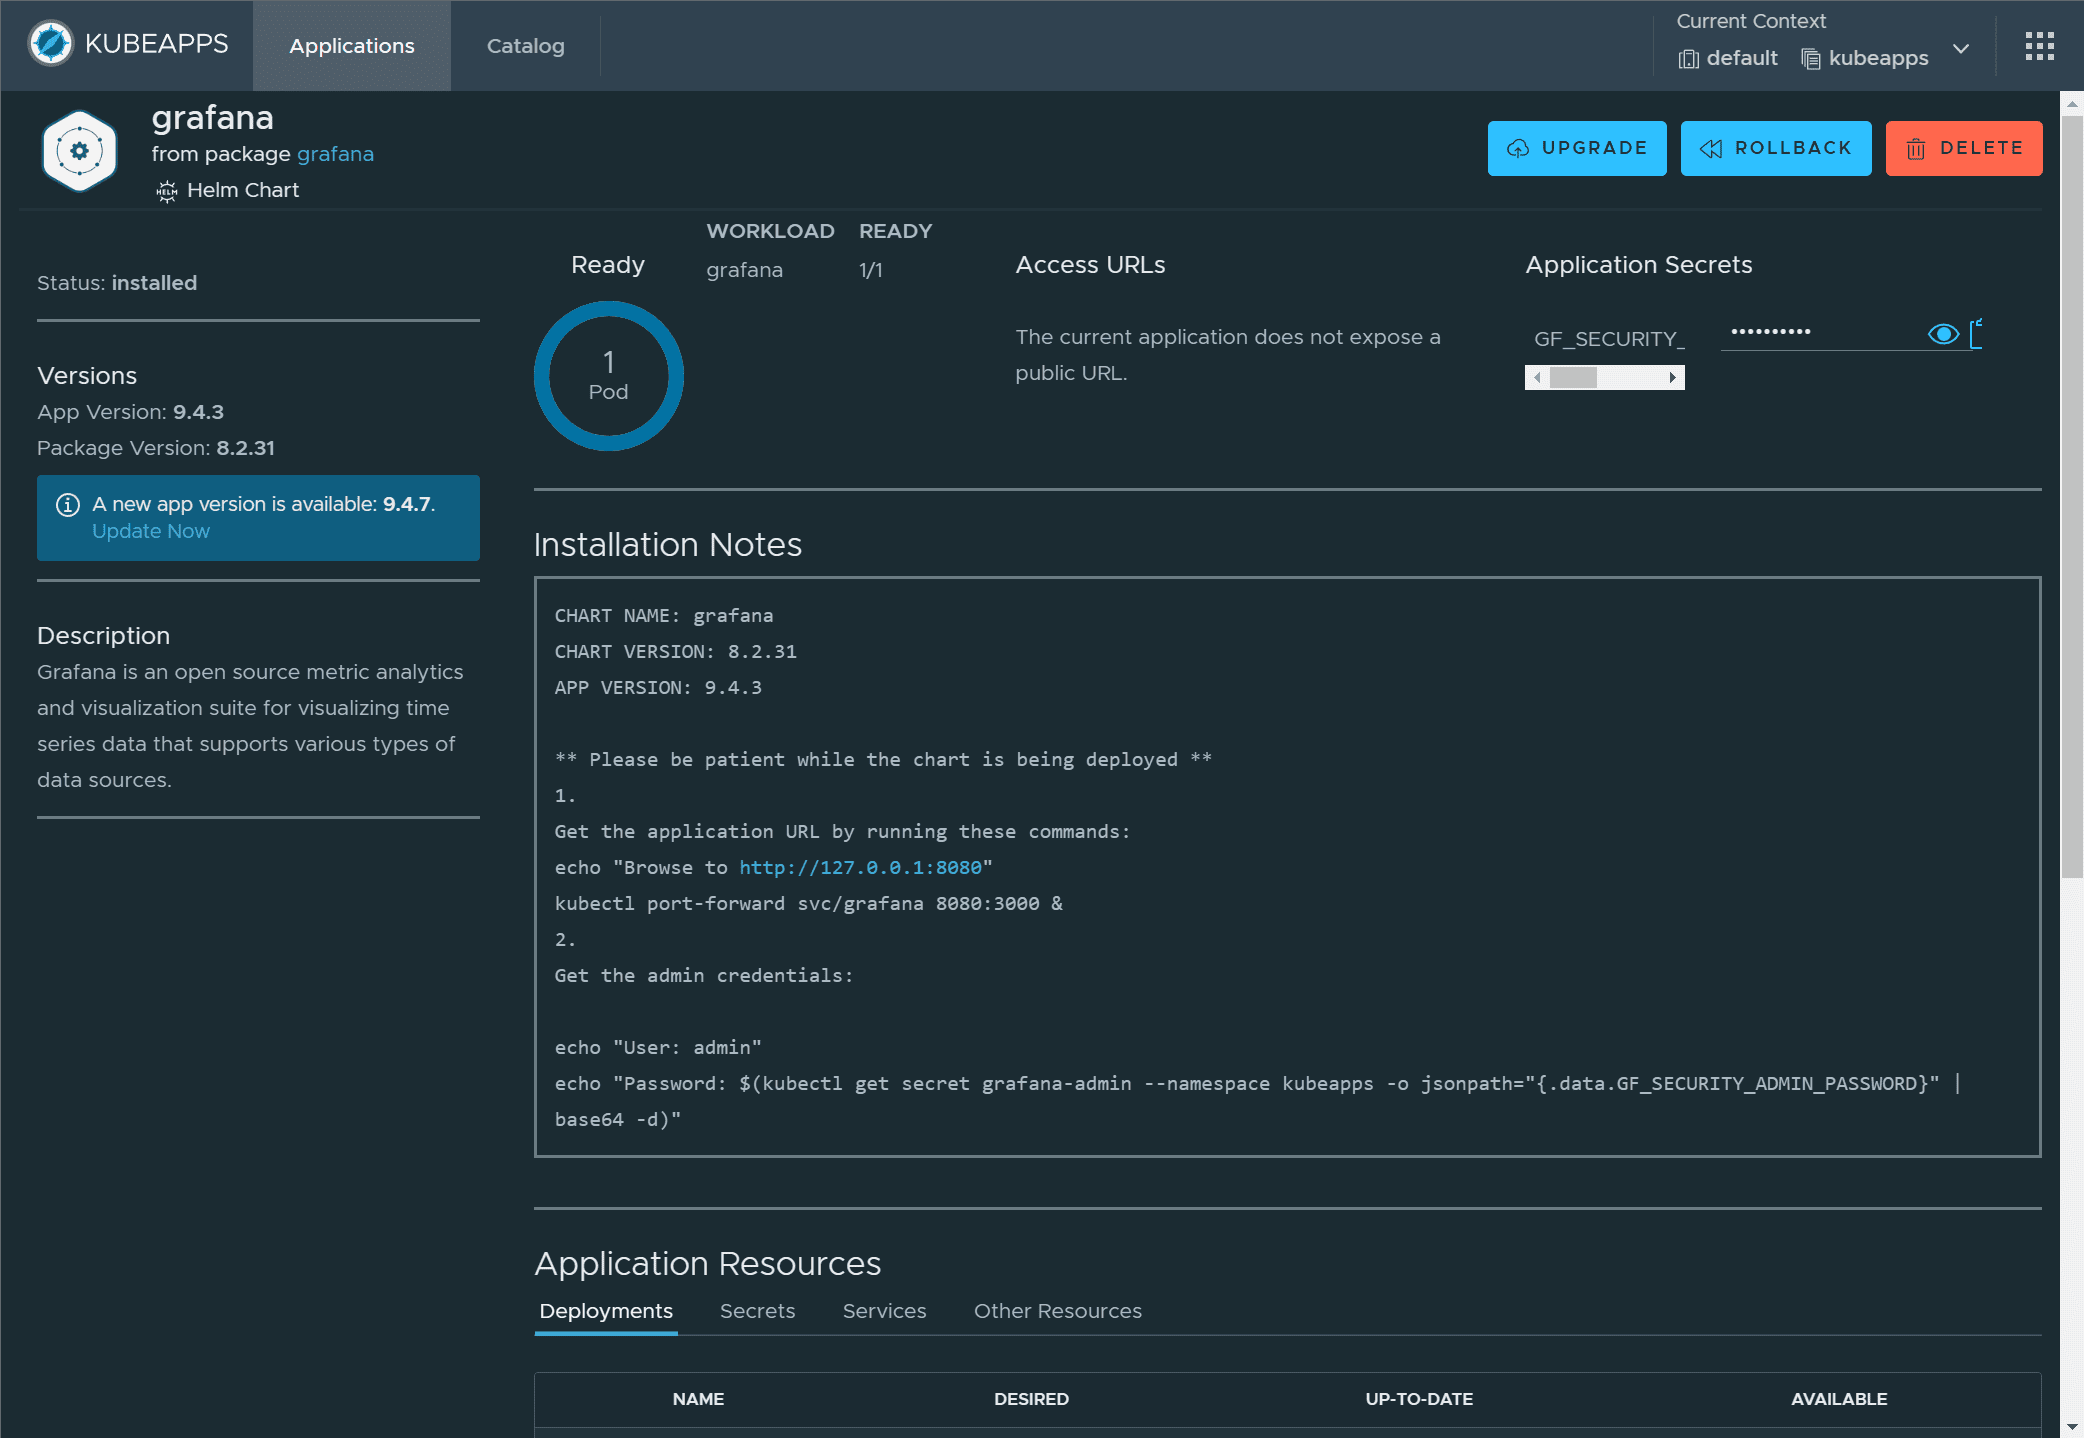
What is Grafana?
Grafana is also an open-source solution that allows you as an admin to visualize your data. Data points in a DB may not make much sense in and of themselves. However, if you can visualize them on a chart or graph, this can make much more sense when trying to see what is going on.
It has many dashboards that are freely available to download such as for Kubernetes. You can also setup alerting with Grafana and notify admins to different communication platforms like email, Slack and other systems that may be used in your environment.
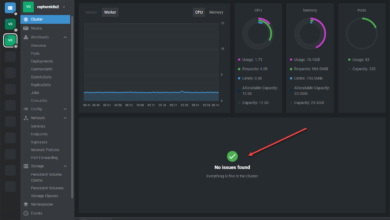
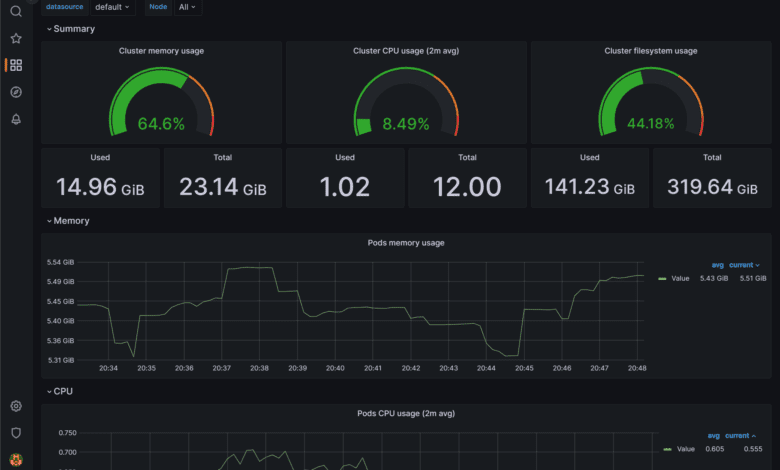
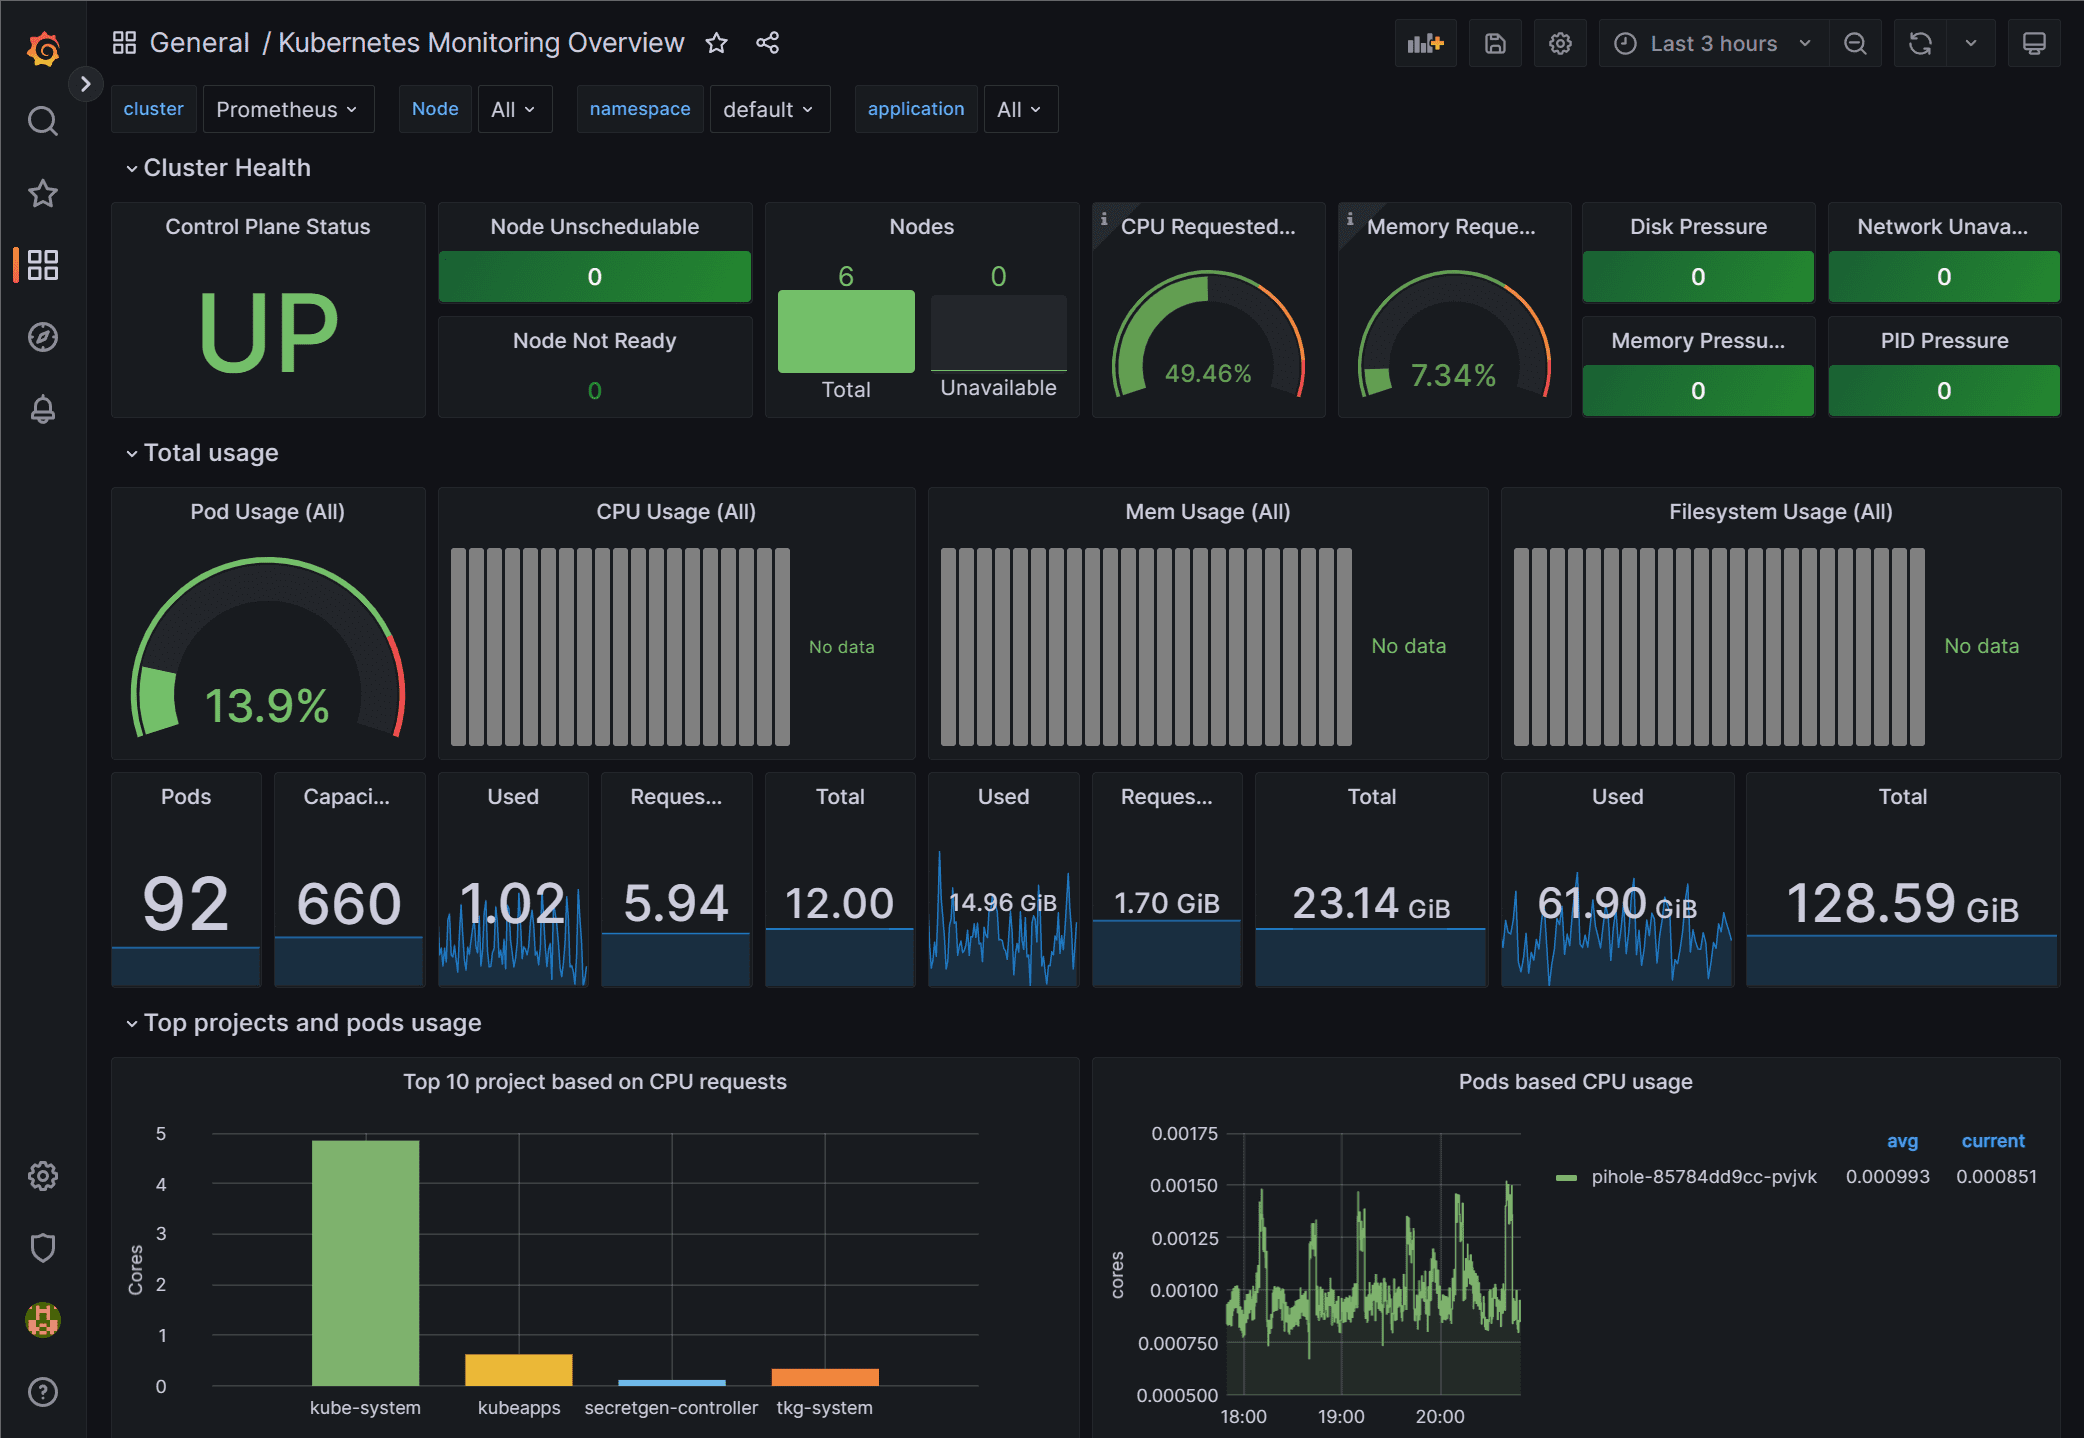
Below is a Grafana dashboard showing the overview of cluster statistics:
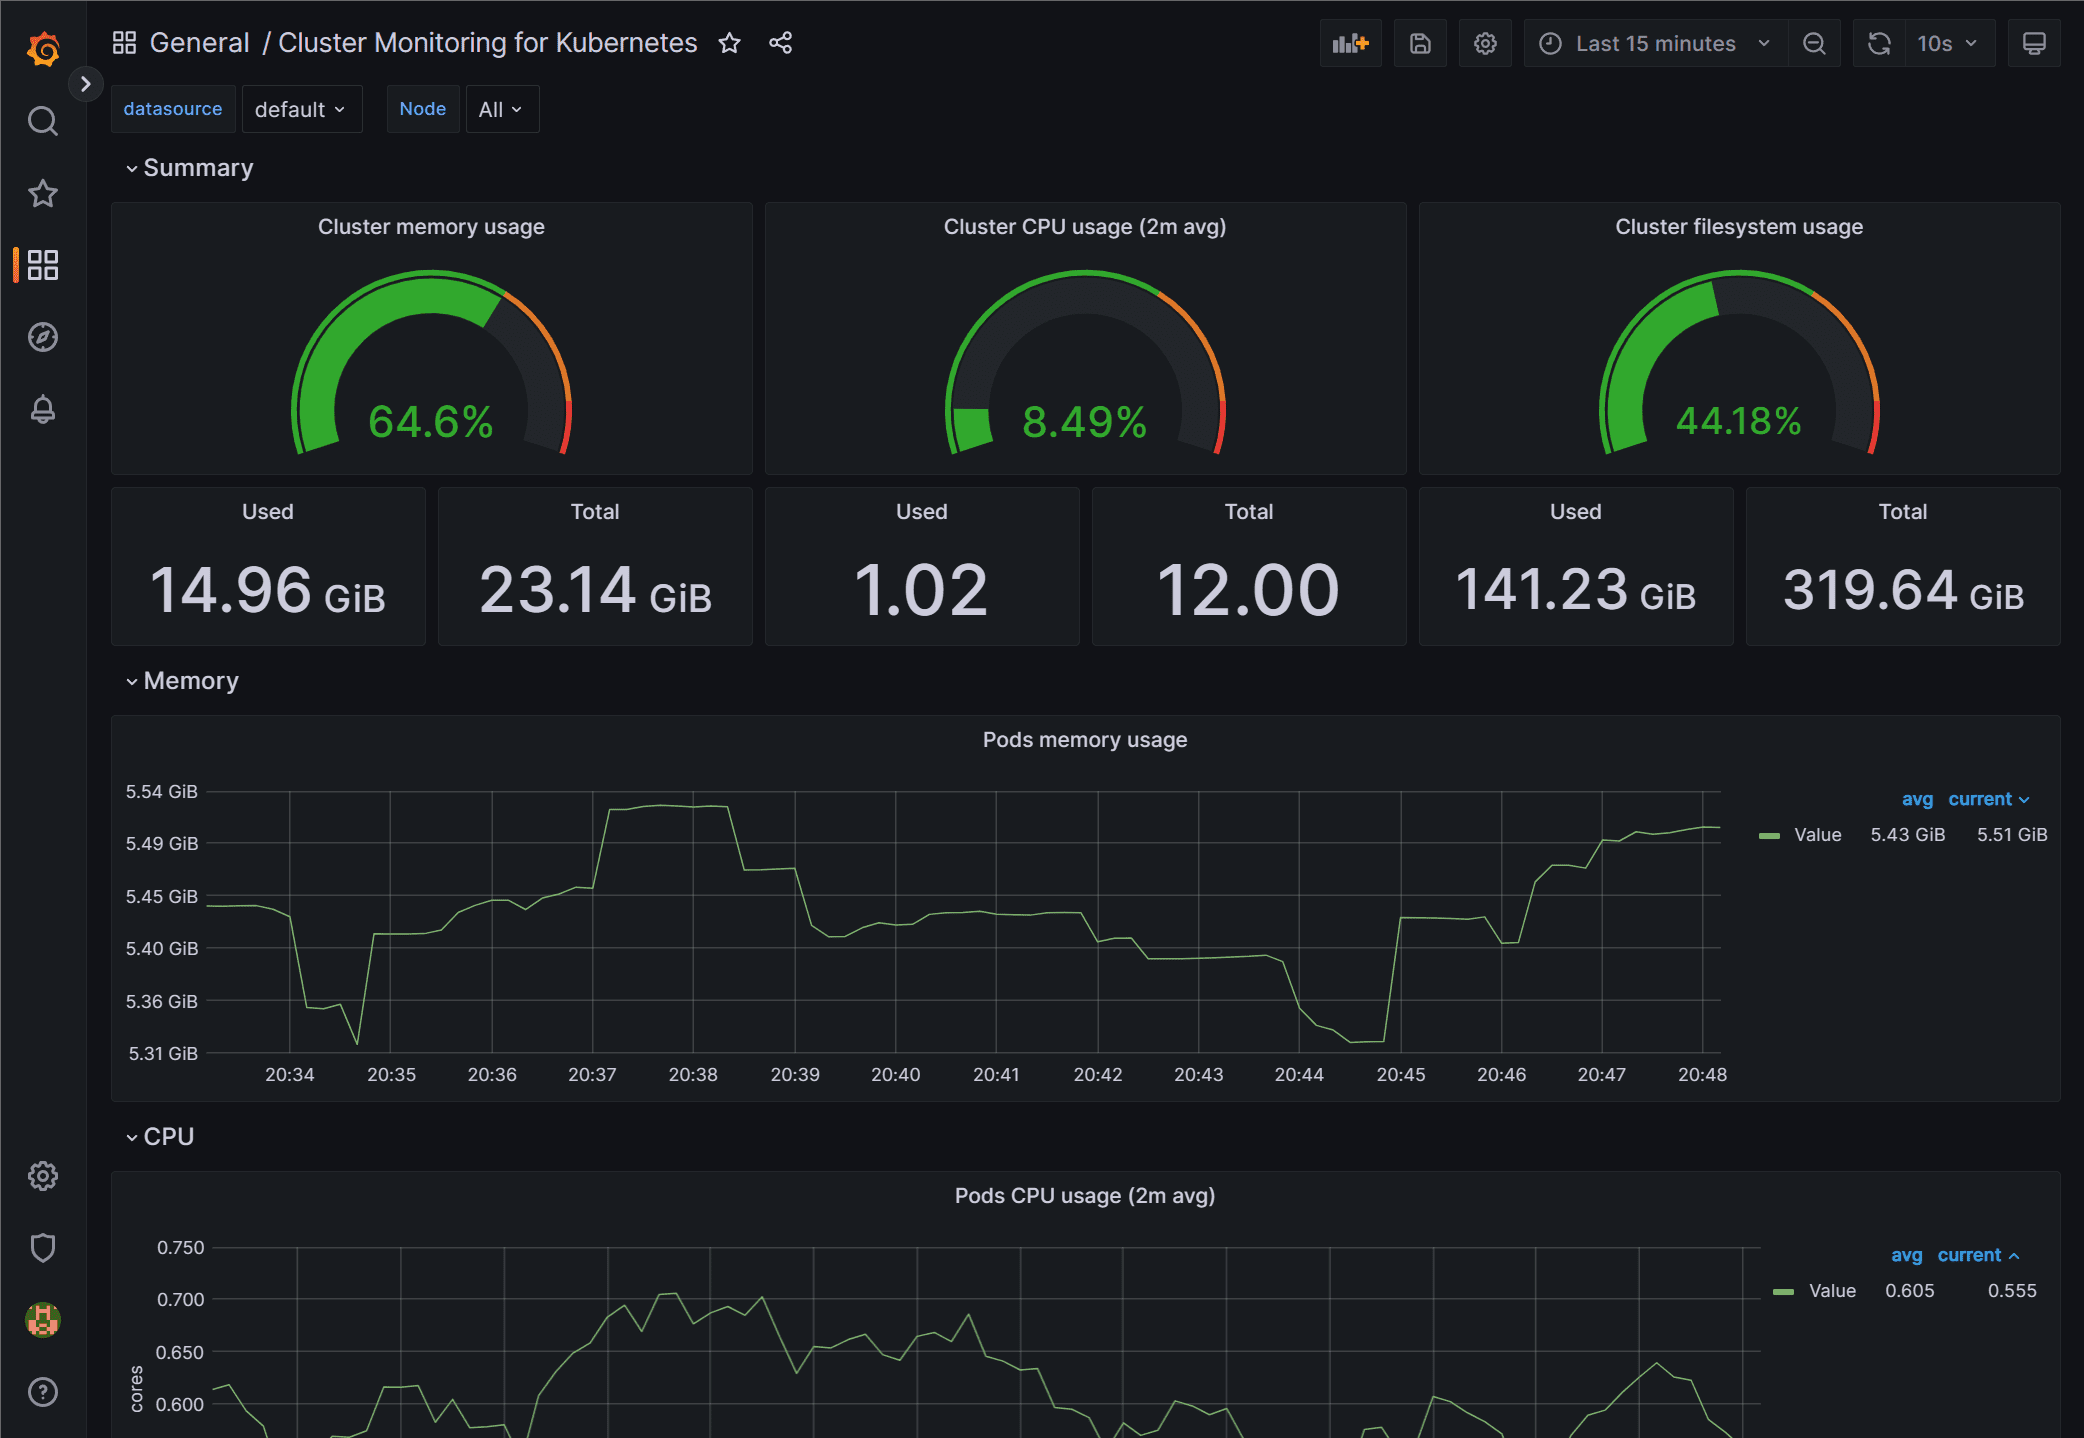
Another Kubernetes dashboard in Grafana displaying a wealth of cluster statistics.
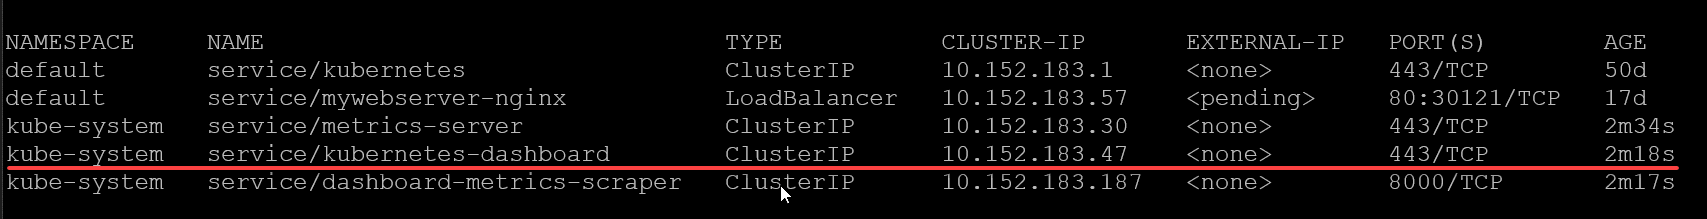
Kubernetes Dashboard
Kubernetes Dashboard is a web-based Kubernetes monitoring tool that provides an overview of your Kubernetes cluster, including the current state of your Kubernetes resources, resource usage, and system metrics. It lets you view and manage your Kubernetes objects, such as replication controllers, services, and pods.
You can use the Kubernetes Dashboard to monitor resource consumption, resource metrics, and usage statistics of your Kubernetes environment. The Dashboard also enables you to run diagnostic commands, view log data, and perform other management tasks.
Kubernetes Dashboard is an excellent starting point for monitoring your Kubernetes infrastructure, but it might not be sufficient for all your Kubernetes monitoring requirements. Combining Kubernetes Dashboard with other monitoring tools, such as Prometheus and Grafana, can provide a comprehensive monitoring and observability strategy.
Integrating Prometheus and Grafana with ELK Stack
For a complete Kubernetes monitoring solution, consider integrating Prometheus and Grafana with the ELK Stack (Elasticsearch, Logstash, and Kibana). ELK Stack is a popular open-source log data aggregation, analysis, and visualization monitoring tool.
Integrating Prometheus and Grafana with the ELK Stack, you can achieve a full-stack monitoring solution covering metrics and logs. Elasticsearch, Logstash, and Kibana can work together to collect, process, and visualize log data, while Prometheus and Grafana focus on metrics data.
- Elasticsearch is a distributed storage and search engine. It can store and index log data from K8s. Logstash is a data processing engine that can collect data from logs and other sources like K8s pods and send them to Elasticsearch.
- Kibana provides a web interface for visualizing and exploring log data stored in Elasticsearch. When combined, these are a great way forward for Kubernetes monitoring.
Monitoring Kubernetes in Virtual Machines and Hybrid Environments
Kubernetes monitoring tools are not limited to Kubernetes clusters running on bare-metal or cloud infrastructure. You can also use these tools to monitor Kubernetes environments running on virtual machines or hybrid environments where Kubernetes clusters are deployed across multiple infrastructures.
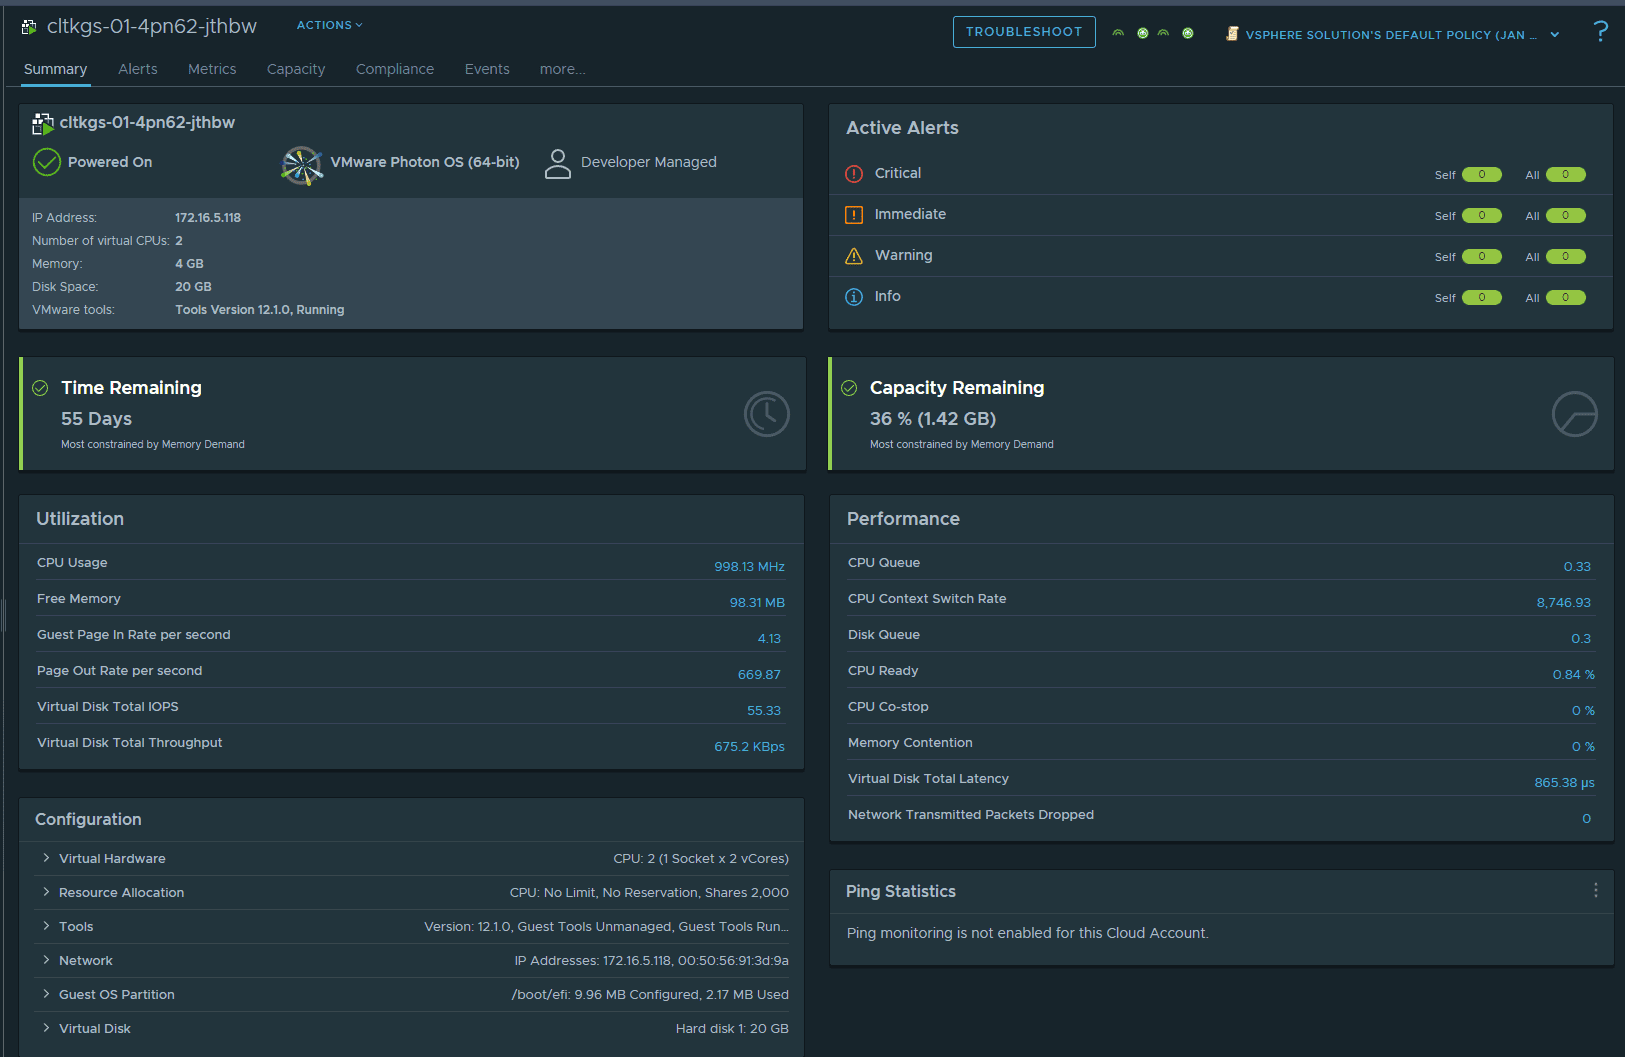
Depending on the underlying infrastructure, you can also use tools to monitor the Kubernetes virtual machine hosts. Below is a look at Workload inventory management in vRealize Operations (Aria).
However, you can also monitor VMs and infrastructure using Prometheus and Grafana as well. See my blog post here on server monitoring with Grafana dashboard:
Third-Party Tools
There are many other 3rd party tools in addition to the open source tools like Prometheus and Grafana. These include things like:
- ELK Stack – this is made up of Elasticsearch, Logstash, Kibana. It provides a log data store and visualization tool for Kubernetes
- Google Borg Monitor – This is a tool that Google developed that can monitor Kubernetes
- Fluentd – This si a lightweight data sender that collects and processes data from logs found in Kubernetes environments.
These third-party tools can be integrated with your existing Kubernetes monitoring setup or used solely as the source of your monitoring for your modern K8s environment.
Kubernetes Watcher and Metrics Generation
The Kubernetes watcher is a feature that monitors any changes that happen in Kubernetes including for objects and then it can generate metrics based on these changes. You can track the state of changes and performance in your environment.
You can integrate Kubernetes watcher with prometheus and grafana for visualizations and metrics gathering.
Monitoring containers
You can also monitor running containers. This is important to do for admins in the K8s environment. Prometheus and Grafana can collect and visualize metrics and capture information such as CPU and memory metrics network statistics and disk metrics.
Wrapping up
Hopefully this post will give a good overview of the tools related to Prometheus and Grafana that you can use to monitor your Kubernetes environment. There are many tools available that can be used for admins to have visibility to the environment. ELK stack can provide great tools for viewing metrics and visualizing these as well. What do you guys use?