Monitoring is a critical part of running enterprise IT infrastructure. You need to know when critical services are down, or the underlying infrastructure has issues. Uptime Kuma provides visibility to ups and downs as needed and is a great self-hosted monitoring tool for that purpose. If you want to run a fancy self-hosted monitoring, uptime Kuma can monitor services in your home lab or production environments. As we will see, once you have Uptime Kuma installed, it is as easy as starting to monitor your infrastructure
What is Uptime Kuma?
First, what is Uptime Kuma? It is a free and open-source monitoring tool the developer mentioned was inspired by such solutions as uptime robot and statping. However, those solutions are no longer maintained.
Uptime Kuma is a great solution that allows the creation of simple and easy-to-use monitoring dashboards to monitor the status of servers, applications, and services in your home lab or elsewhere.
It is available as a Docker image and can be found on the Docker hub to easily pull down the container. You can also pull directly from the developer’s GitHub page. Create a Docker host using Ubuntu or another Linux distribution, then create a new instance to monitor downtime in your environment.
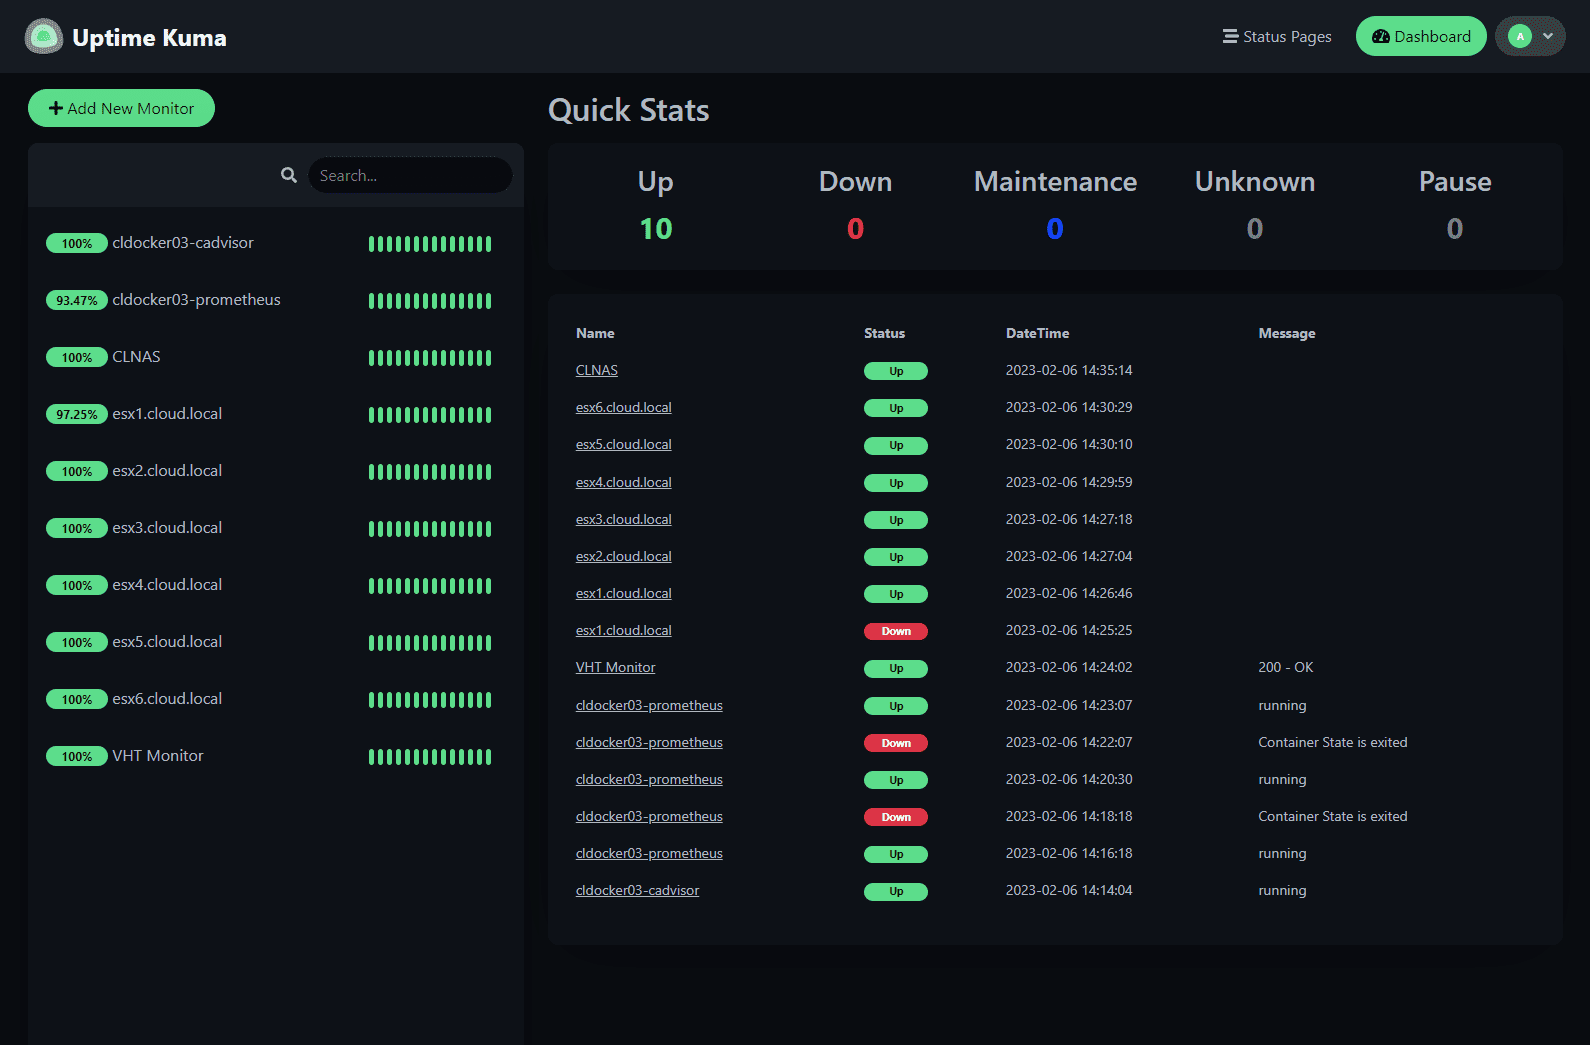
You can monitor and perform alerting with the solution and create beautiful dashboards to display the uptime and reachability of services in your environment.
What can Uptime Kuma monitor?
What are examples of services and solutions Uptime Kuma can monitor?
websites, including SaaS services like Microsoft Teams
domain urls
services
servers
test data
site accessibility
server resources
protocols
DNS records
Docker containers
Steam Game Server
MQTT
Microsoft SQL Server
PostgreSQL
MySQL/MariaDB

Uptime Kuma Features
Uptime Kuma provides a wealth of features and capabilities for fancy self-hosted monitoring, including the following:
Monitoring uptime for HTTP(s) / TCP / HTTP(s) Keyword / Ping / DNS Record / Push / Steam Game Server / Docker Containers
Fancy, Reactive, Fast UI/UX
Notifications via Telegram, Discord, Gotify, Slack, Pushover, Email (SMTP), and 90+ notification services
20-second intervals
Multi Languages
Multiple status pages
Map status pages to specific domains
Ping chart
Certificate info
Proxy support
2FA support
Installing Uptime Kuma
The process to install Uptime Kuma is straightforward. All you need is a Docker container host to deploy the container and other services.
You can use the following docker run command to install the Uptime Kuma container on your Docker container host:
Create a docker volume
docker volume create uptime-kuma
Start the container
docker run -d –restart=always -p 3001:3001 -v uptime-kuma:/app/data –name uptime-kuma louislam/uptime-kuma:1
Install on a Linux host
You can install Uptime Kuma on a Linux host directly without a container, such as an Ubuntu host. You can view the detailed installation guidelines on the official documentation page.
How to Install · louislam/uptime-kuma Wiki (github.com)
Other installation methods
Many services like Linode offer Uptime Kuma as part of apps you can install in the environment. You will just need your Linode API token and a few bits of other information.
Uptime Kuma – Uptime Robot Monitoring Alternative | Linode Marketplace
Log in to the server and set the initial password
After you have pulled and spun up the container in your environment, you must browse to the website on port 3001. This is a plain text HTTP site. However, you can use a reverse proxy to easily secure the site with HTTPS. You will be prompted to create a new user and password for the solution.
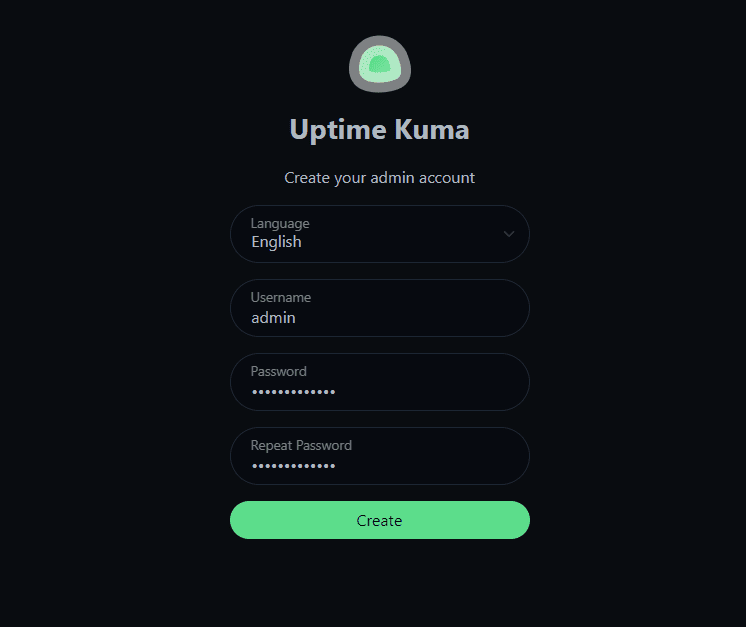
Enter the new user, password, and verify the password. Then click the Create button.
How to Access Uptime Kuma After Installation?
To access the solution after installation, you will need to browse to port 3001 on your Docker host and login using the username and password created in the process above.
How to Add Monitors to Uptime Kuma?
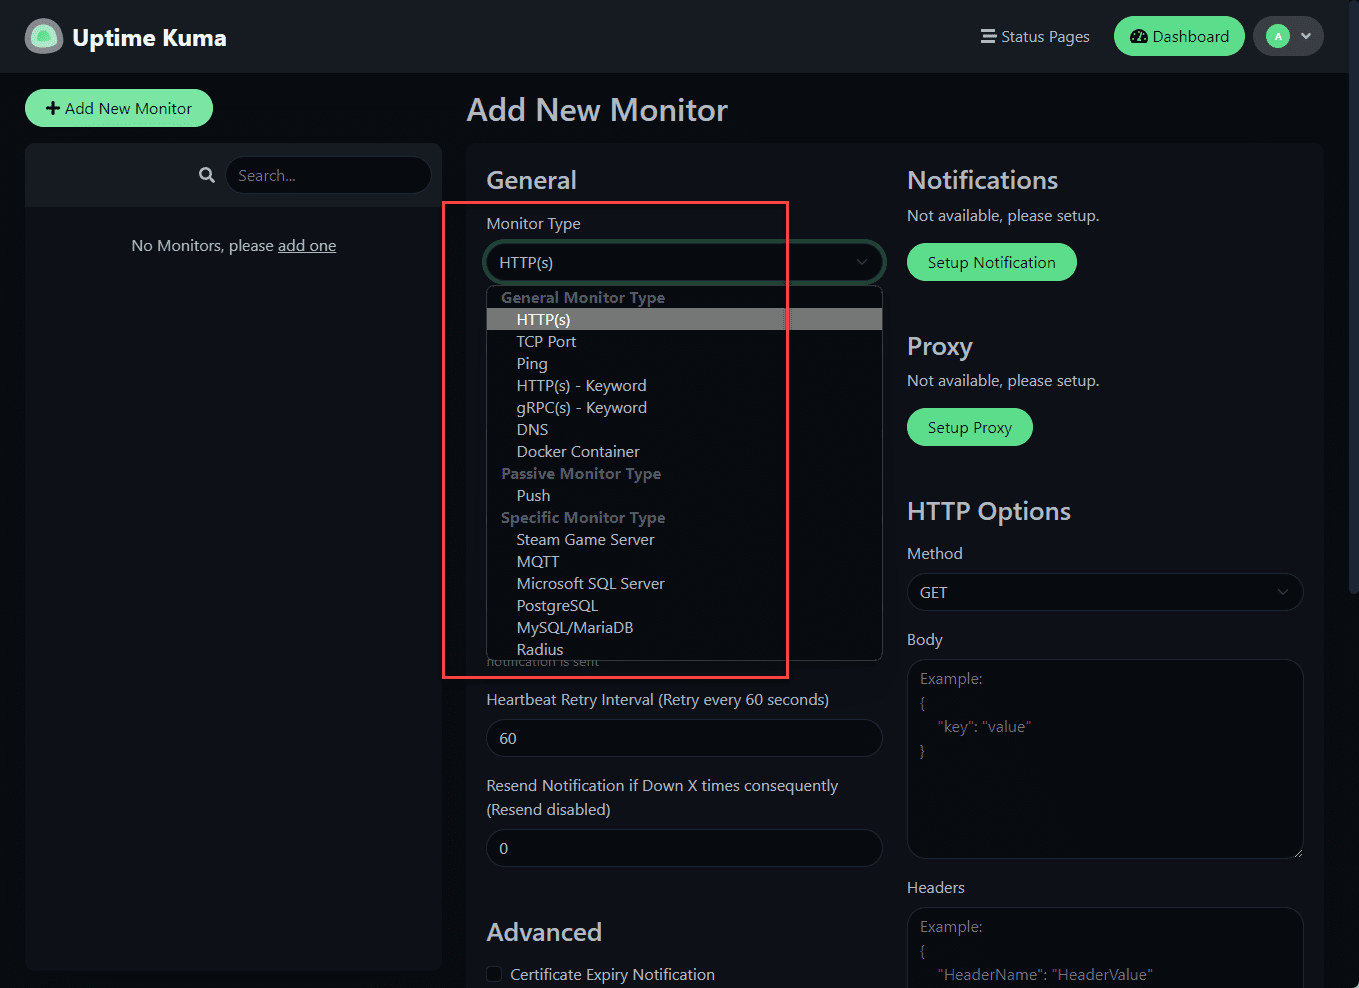
Uptime Kuma makes the process to add monitors extremely easy. Click the green Add new monitor button to begin the process to add a new monitor.
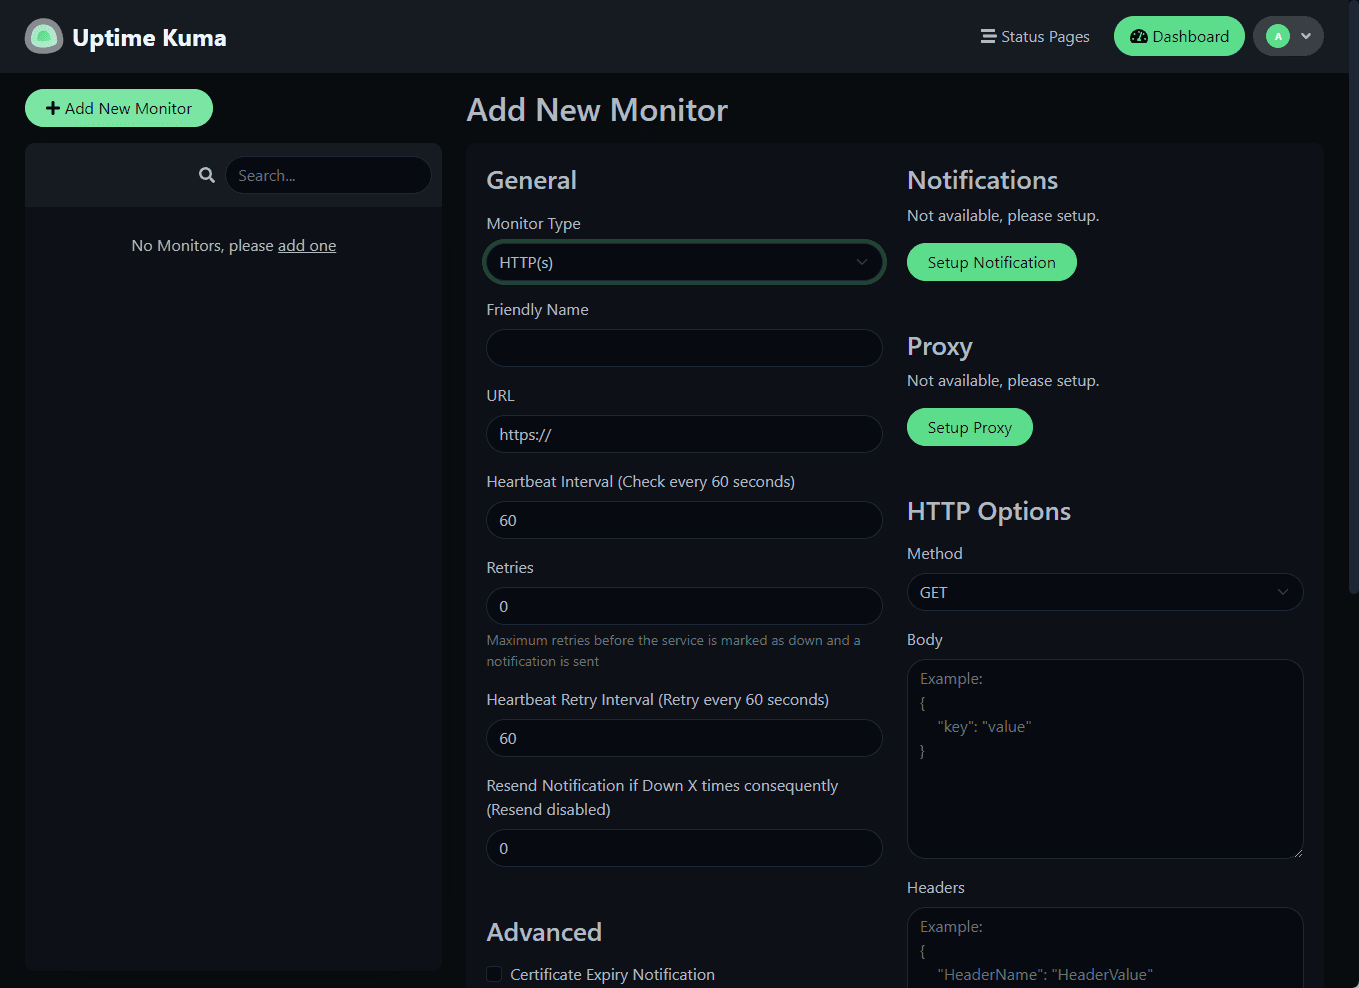
You can click the dropdown menu for the Monitor type to see the available monitor types.
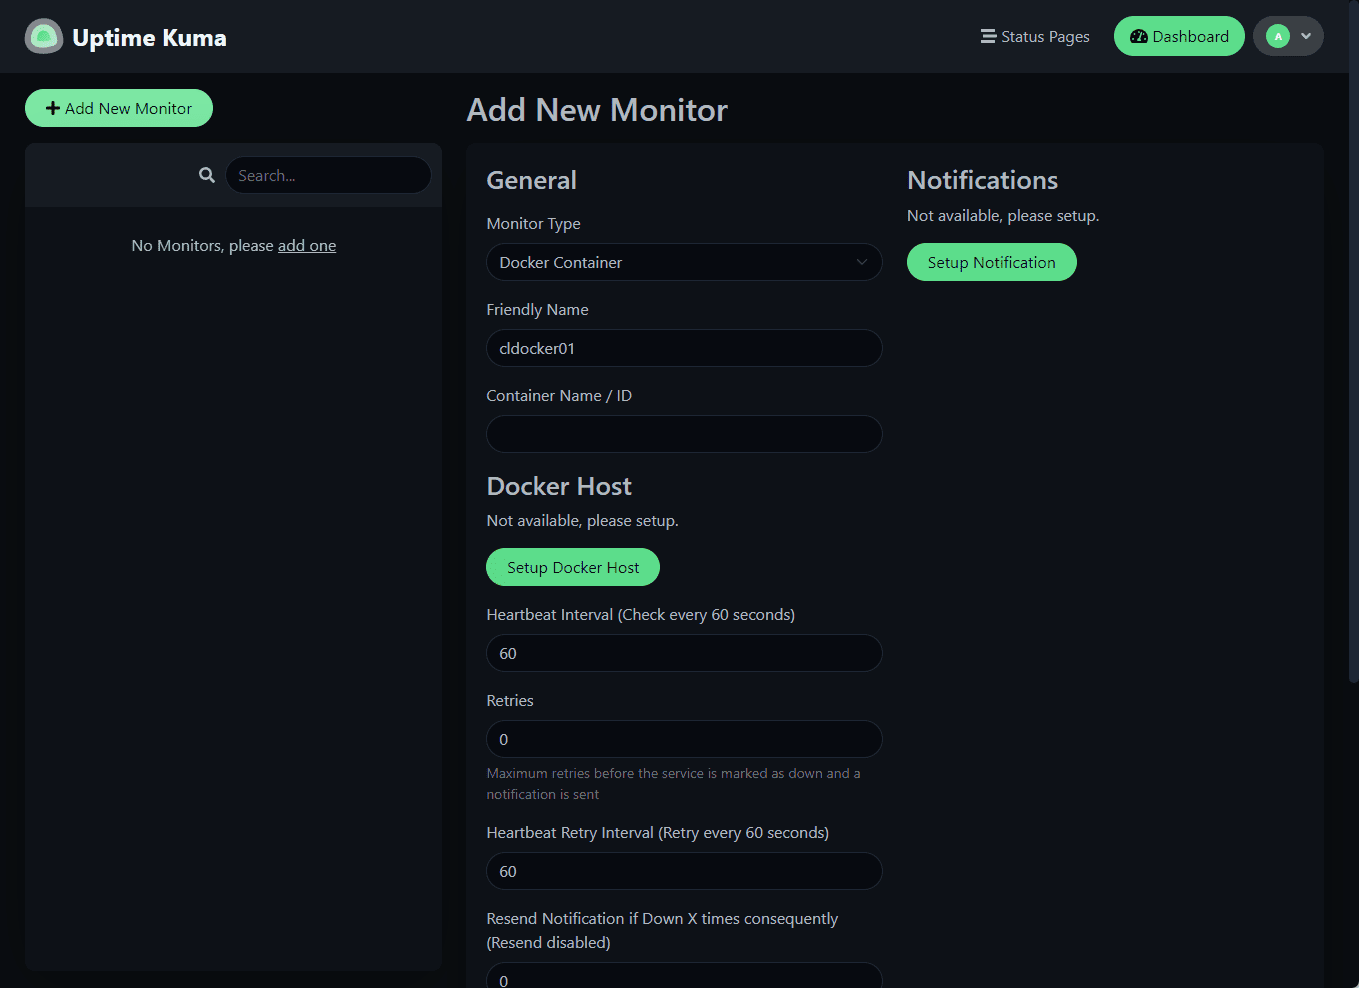
Add a Docker container host for monitoring
One of the really cool things you can do is monitor a specific container directly. You can do this by adding your Docker container host and then add the specific container, by container name or ID to a new monitor.
Allow your Docker container to be remotely monitored
There are a couple of lines of configuration you will need to add/change on your Docker container host for monitoring.
Create daemon.json file in /etc/docker:
{“hosts”: [“tcp://0.0.0.0:2375”, “unix:///var/run/docker.sock”]}
Add /etc/systemd/system/docker.service.d/override.conf
[Service]ExecStart=
ExecStart=/usr/bin/dockerd –config-file /etc/docker/daemon.json
Reload the systemd daemon:
systemctl daemon-reload
Restart docker:
systemctl restart docker.service
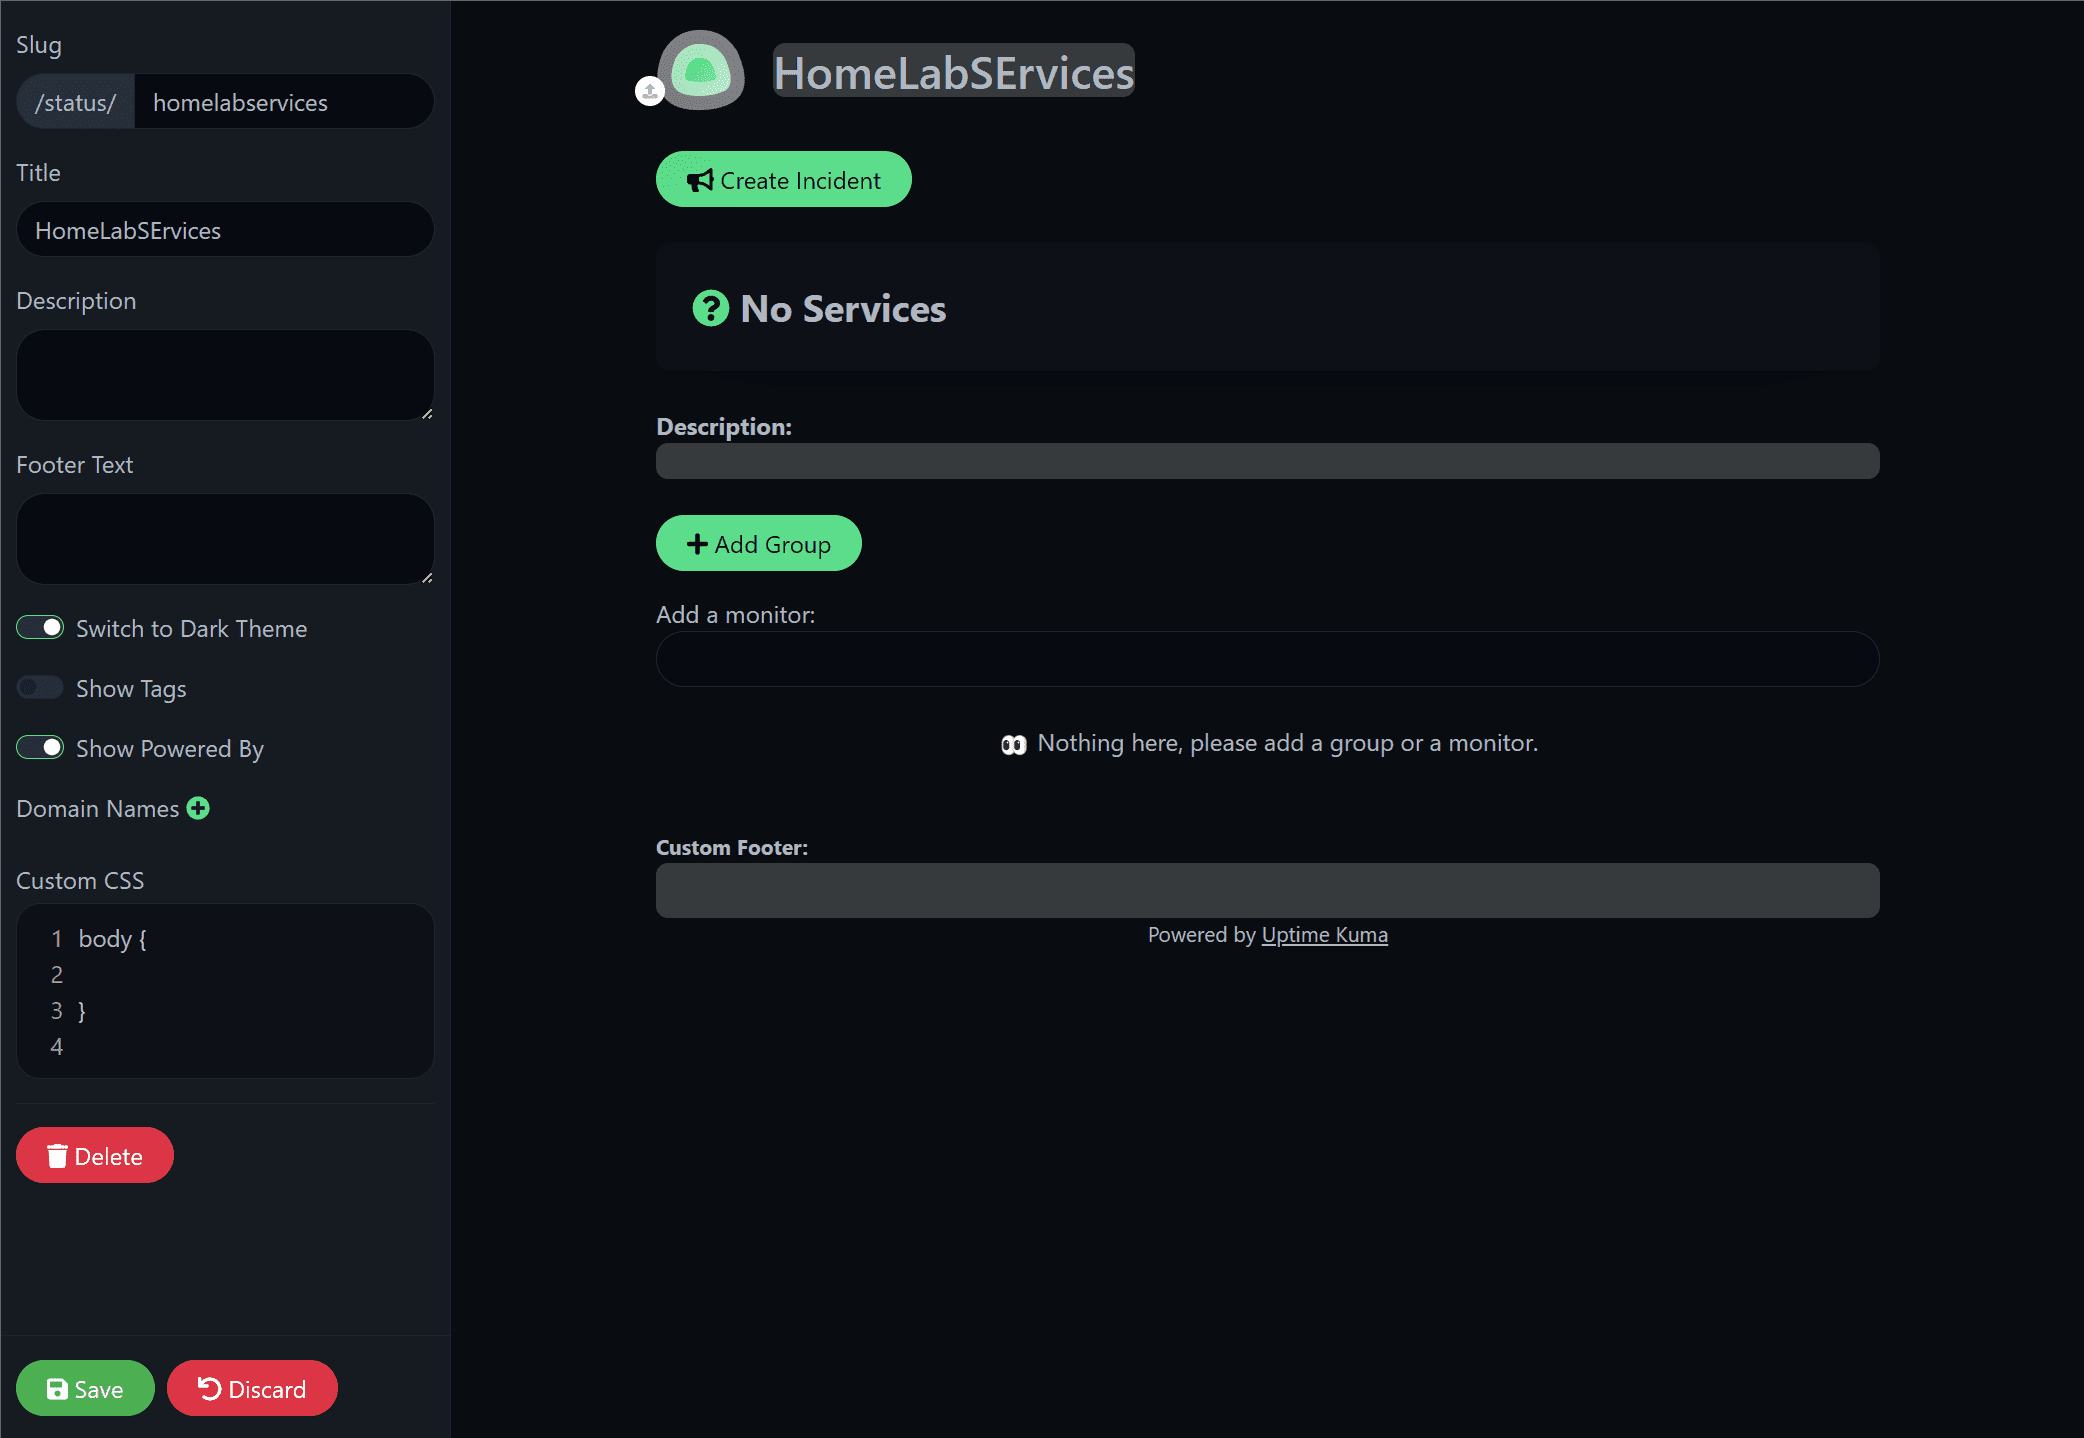
Create status pages
Uptime Kuma allows creating status pages for showing groups of services or subsets of monitored services. You can post incident statuses, etc.
Maintenance operations
It also has a convenient way to pause monitoring for maintenance periods. This capability makes it easy to pause things so you don’t get spammed with alerts during a maintenance period or operation.
Wrapping Up
Uptime Kuma is a great monitoring solution allowing you to effectively monitor critical services in your home lab environment and ensure infrastructure is up and running. You can setup effective alerts, monitor container hosts, and configure status pages.