Monitoring is an extremely important task not only on-premises but also in cloud environments. Organizations are no longer now simply on-premises with their infrastructure. They also have infrastructure that exists in one or even many public cloud environments. So organizations are operating in a hybrid and even multi-cloud configuration in most cases. Amazon’s AWS cloud is the most popular option for businesses today. It boasts 33% of the cloud market share and continues to dominate in many areas. I have written many times before about Paessler’s PRTG Monitoring solution as it provides an extremely robust solution with many capabilities to note. One of those capabilities to note is the ability to monitor your AWS environment. This post will show how to monitor AWS with PRTG CloudWatch sensors including a walkthrough of configuration steps.
What is Paessler PRTG?
Paessler PRTG is a very powerful monitoring solution that works off the concept of sensor-based monitoring where you add devices and then add various sensors that you want to use to monitor those devices. PRTG makes this process easier as well by means of device templates that add many of the desired sensors out of the box for monitoring various infrastructure types.
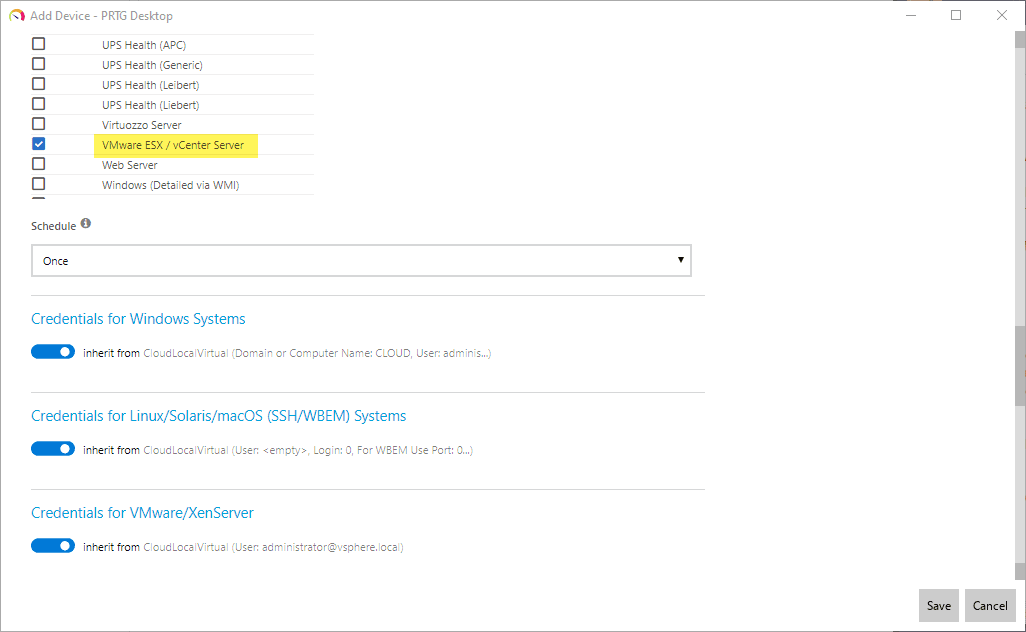
As an example, if you want to add a vSphere VCSA appliance or an ESXi host, you can enter the FQDN and IP address of the host and then select to use an existing device template and then select VMware vCenter/ESXi for the device template. It will then add the various sensors that make sense for a vCenter Server or an ESXi host to monitor accordingly.
Below is a screenshot of adding the VMware ESX / vCenter Server to PRTG.
Monitor AWS with PRTG CloudWatch Sensors
We can easily monitor AWS with PRTG CloudWatch Sensor in just a few steps, including:
- Creating a PRTG device group
- Setting AWS permissions for monitoring in PRTG
- Create a new PRTG device for monitoring your AWS environment
- Adding a new PRTG Device Sensor for CloudWatch monitoring
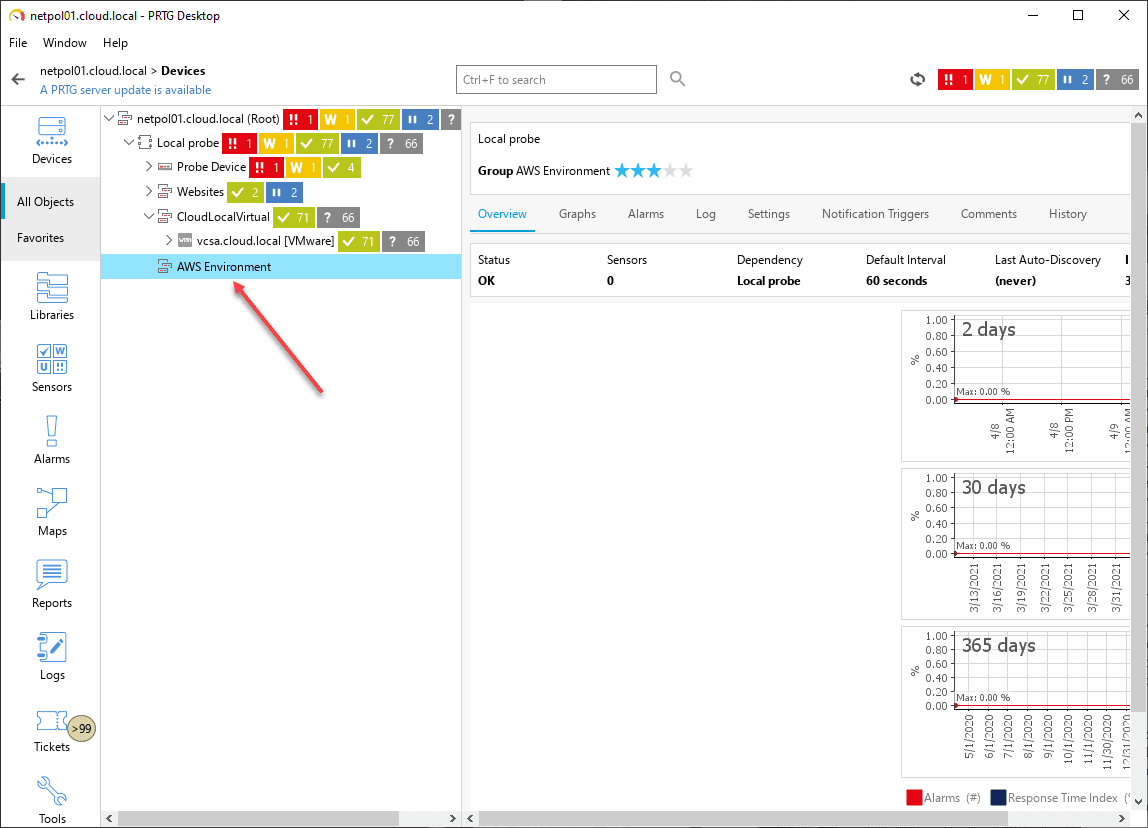
1. Creating a PRTG device group
One of the first steps that actually isn’t required but it allows configuring a device hierarchy for monitoring purposes so you can group devices together. In addition, with a device group, you can set specific monitoring configuring, including credentials. So, below, I have created a new PRTG device group that will contain my PRTG CloudWatch sensor.
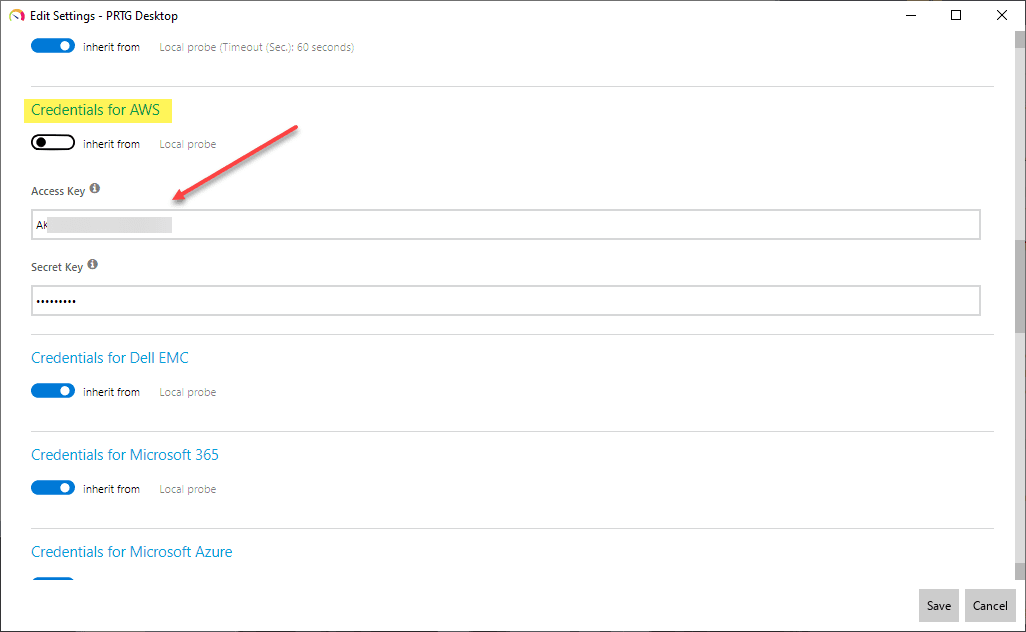
2. Setting AWS permissions for monitoring in PRTG
There is an in depth KB that discusses how to setup AWS permissions for monitoring in PRTG here: How do I set permissions for the Amazon Web Services (AWS) API key to use certain sensors in PRTG? | Paessler Knowledge Base. Once you have configured your IAM permissions for PRTG access, you can then add the permissions to the settings of your device group. You will need your Access key and Secret key for this purpose to query the AWS API programmatically.
3. Create a new PRTG device for monitoring your AWS environment
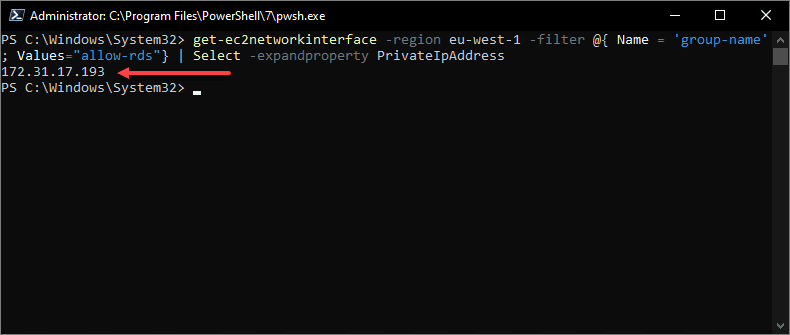
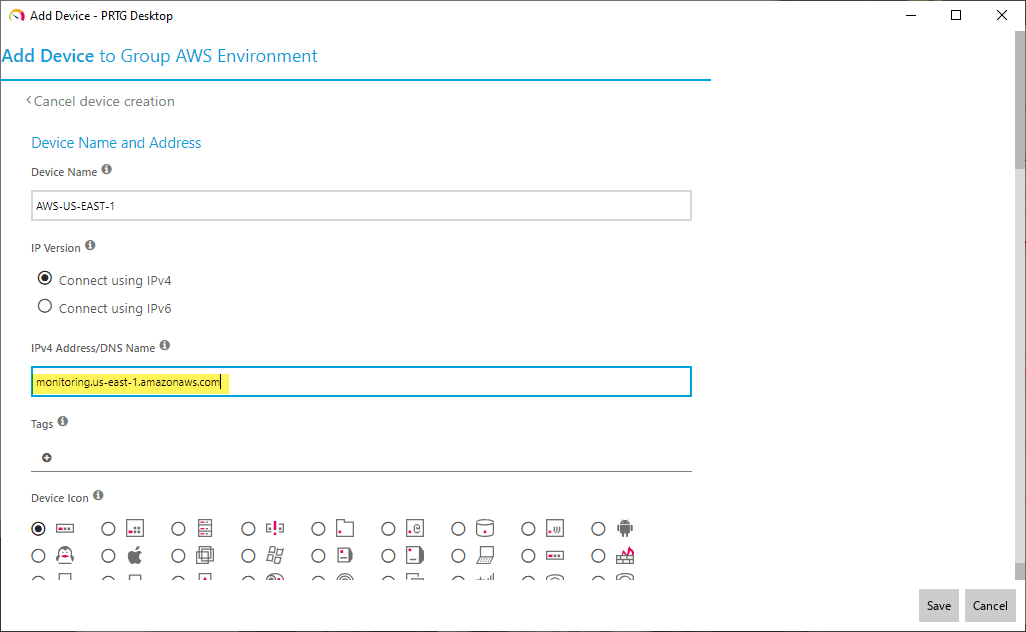
This was a step I couldn’t really find documented anywhere as of yet. You have to create a device to be able to monitor your AWS environment, however, wasn’t sure which device it was looking for as you are required to enter an IP address or FQDN for adding a device. Devices are required to add a sensor.
However, in just a bit of tinkering, found that using the monitoring API URL for AWS seemed to work just fine. For US-EAST-1, I used:
monitoring.us-east-1.amazonaws.com
My Add Device screen looked like this.
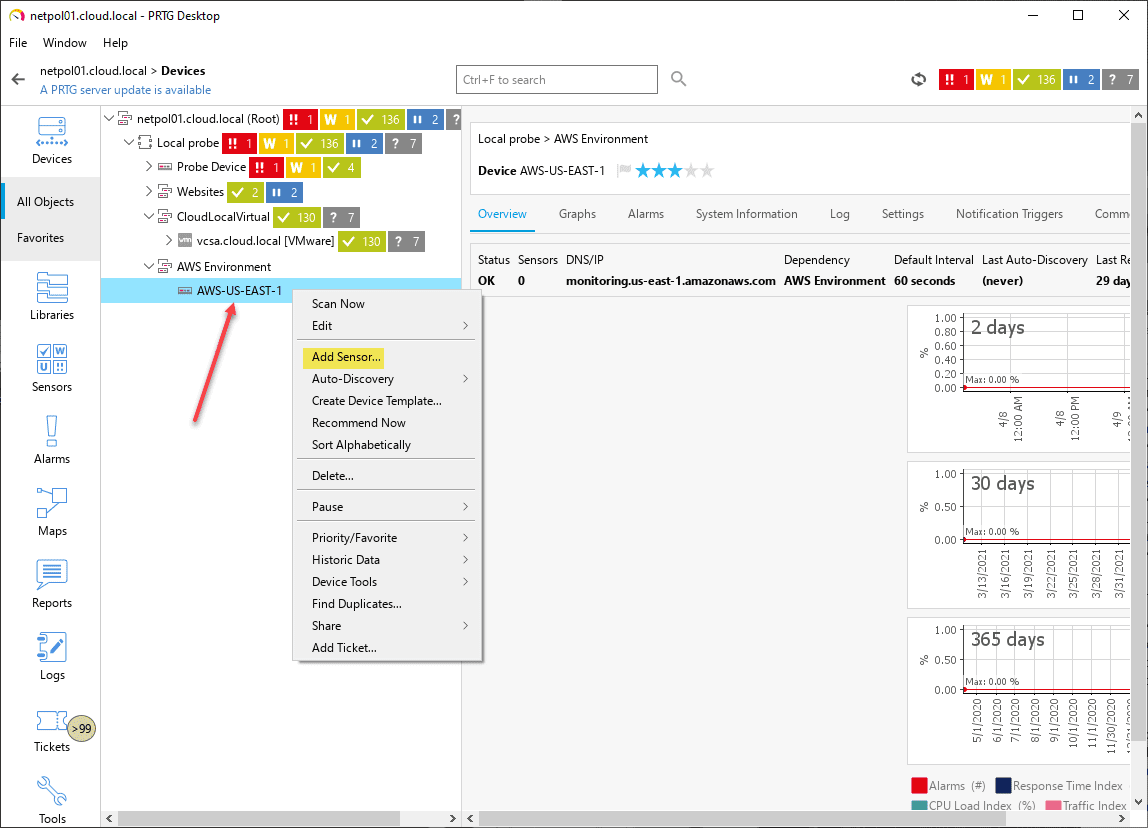
4. Adding a new PRTG Device Sensor for CloudWatch monitoring
For the new AWS device that is pointing to the CloudWatch API URL for monitoring the AWS environment, just right-click and choose Add Sensor.
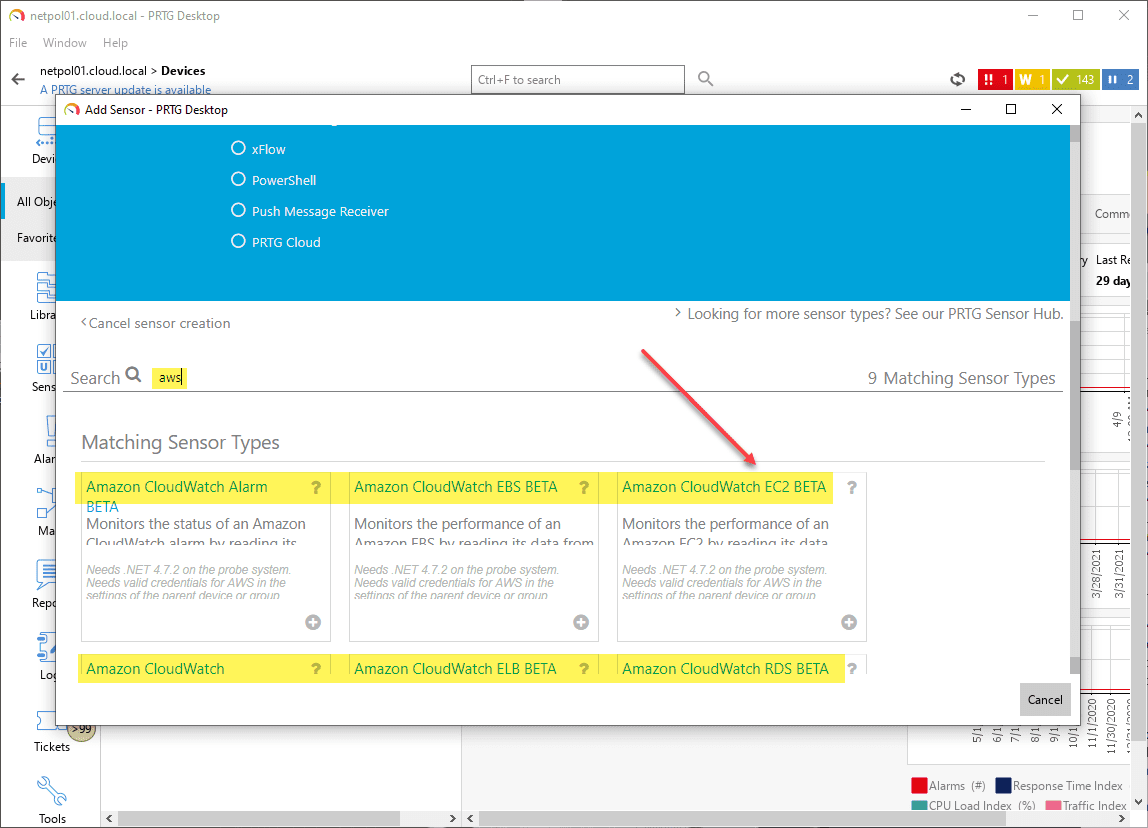
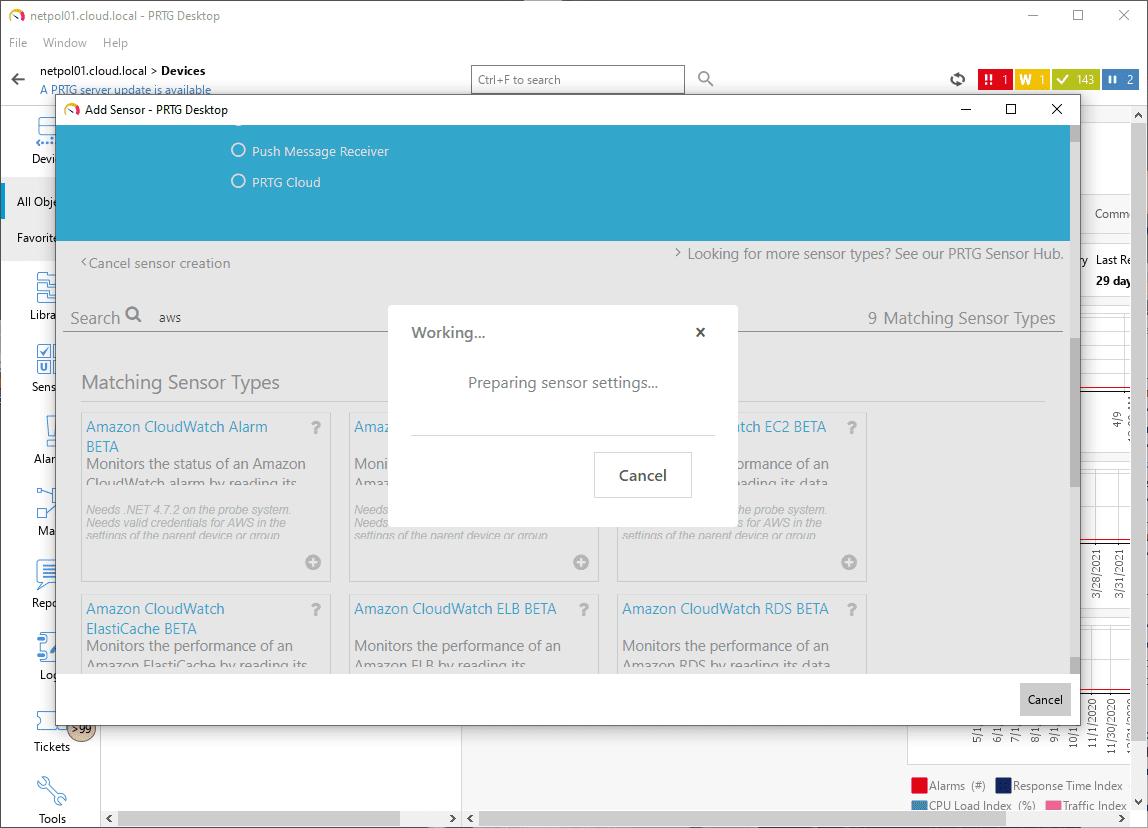
This will launch the Add Sensor screen. Type in AWS in the search field to bring up the available AWS sensors. I am selecting to add the Amazon CloudWatch EC2 monitor. The current monitors available include:
- Amazon CloudWatch Alarm
- Amazon CloudWatch EBS
- Amazon CloudWatch EC2
- Amazon CloudWatch ElastiCache
- Amazon CloudWatch ELB
- Amazon CloudWatch RDS
- Amazon CloudWatch SNS
- Amazon CloudWatch SQS
- Amazon Cost
Keep in mind, these show to still be in beta.
After clicking on the Amazon CloudWatch EC2 sensor, you will see PRTG start preparing the sensor.
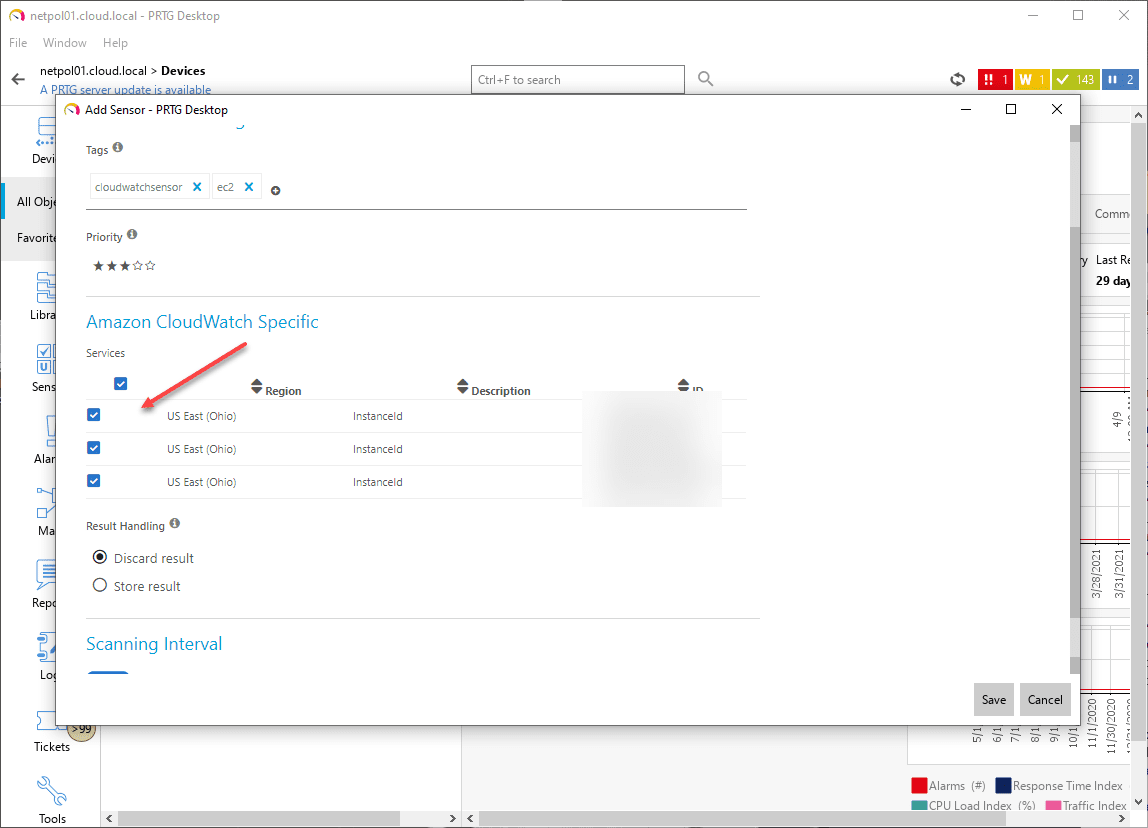
Next, select the instanceIDs that you want to monitor with the PRTG CloudWatch sensors.
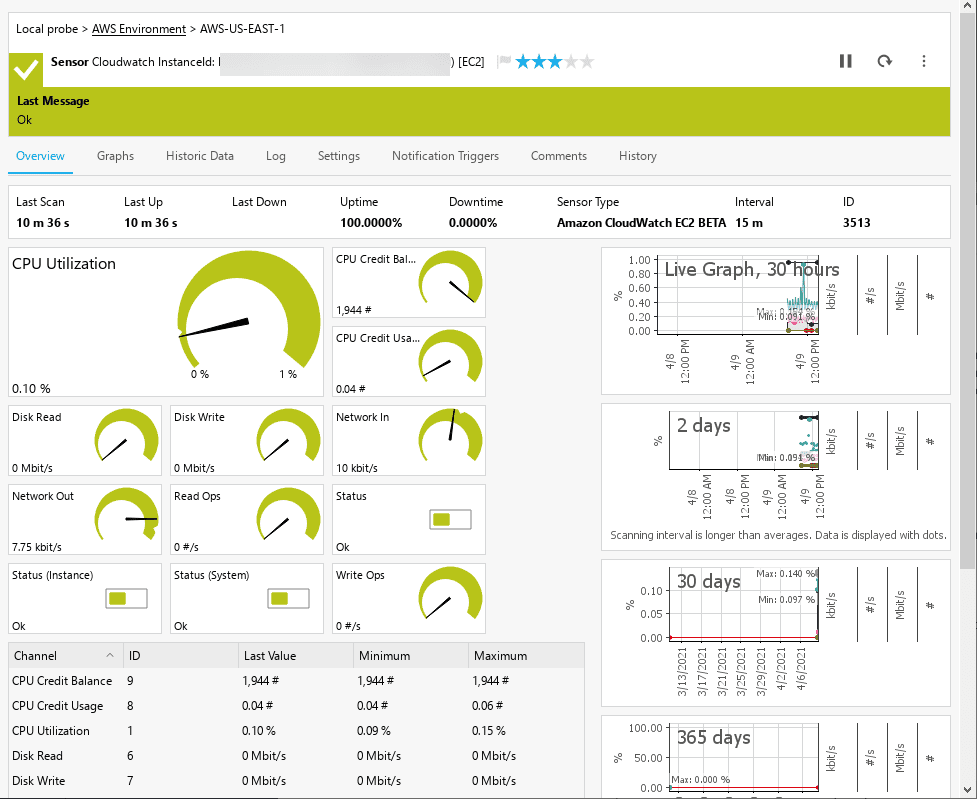
Once you have added the CloudWatch EC2 sensor as I have done here, you will see detailed statistics, including the CPU utilization, credit balance, network in, network out, disk read, disk write, and other helpful metrics.
Wrapping Up
The ability to Monitor AWS with PRTG CloudWatch Sensors allows businesses to add cloud monitoring to their existing PRTG infrastructure monitoring they are already doing on-premises. The ability to pull in your CloudWatch monitoring to PRTG is a great way to perform hybrid monitoring of both your on-premises and Amazon AWS environment. It allows having visibility on very crucial cloud metrics, including cost monitoring.
Check out PRTG over here for a free download and a free copy up to 100 sensors: PRTG Network Monitor » All-In-One Network Monitoring Software (paessler.com)
Google is updating how articles are shown. Don’t miss our leading home lab and tech content, written by humans, by setting Virtualization Howto as a preferred source.
About The Author