VMware vSphere High Availability provides many different mechanisms to help ensure the availabilty of your virtual machines, and by extension your applications. More are familiar with the capabilites of vSphere HA at the cluster level with an ESXi host failure, however, vSphere HA provides capabilities for VM and Application Monitoring. Let’s take a look at VMware vSphere HA VM and Application Monitoring to see what this is exactly and how it is configured.
What is VMware vSphere HA VM and Application Monitoring?
What is vSphere HA VM and application monitoring? VM Montoring with the vSphere HA featurer allows vSphere to restart individual VMs based on heartbeat monitors to VMware Tools when these heartbeats fail. The same is true with application monitoring. VMs can be restarted if the heartbeats for an application are not received within a certain timeframe.
Both of these features can be enabled in the configuration of vSphere HA at the cluster-level of the vSphere cluster in the vSphere Client. Additionally, you can configure the sensitivity with vSphere HA and how it monitors the “non-responsiveness” of either the VM or application.
How does VM and Application Monitoring Work?
How does VM and Application Monitoring work? When this feature of vSphere HA is enabled, the VM Monitoring service uses VMware Tools to determine whether or not a virtual machine is running properly by checking both the heartbeats from VMware Tools as well as I/O activity of teh VMware Tools process running in the guest operating system.
Unnecessary reboots of a guest VM are minimized by the check of I/O activity on the VM along with the heartbeats. There are cases where a VM or application may still be working correctly and the VM has stopped sending heartbeats. When this is the case, the VM Monitoring service also checks the VM I/O stats by means of its cluster-level attribute.
Using the I/O statistics cluster-level metric, the VM Monitoring service checks to see if any I/O activity has occurred in the previous 120 seconds (2 minutes). If there has been no I/O activity, the VM is reset. This value of 120 seconds can be changed with an advanced configuration parameter called das.iostatsinterval.
In order to use Application Monitoring, you need to have a vendor supplied SDK or use an application that already supports VMware Application Monitoring. Using these you can configure customized heartbeats for your applications to be monitored. The Application Monitoring works in a similar way to the VM Monitoring feature. If hearbeats are not received for the monitored application, the VM is restarted.
VM and Application Monitoring Sensitivity
What about sensitivity of the actual monitoring? This can be customized. Sensitivity settings range all the way from Low to High aggressiveness. This means if you have high sensitivity configured, you may have more false positives, whereas low sensitivity means you may have a longer service disruption if you actually have a VM that is unresponsive before it gets reset.
VMware notes that while it is unlikely, high sensitivity settings for monitoring may lead to false positives, especially if there are resource constraints or other issues that may have lead to heartbeats not being received.
Configure VMware vSphere HA VM and Application Monitoring
Configuring VMware vSphere HA VM and Application Monitoring is fairly straightforward and is found on the vSphere HA configuration settings for a vSphere cluster.
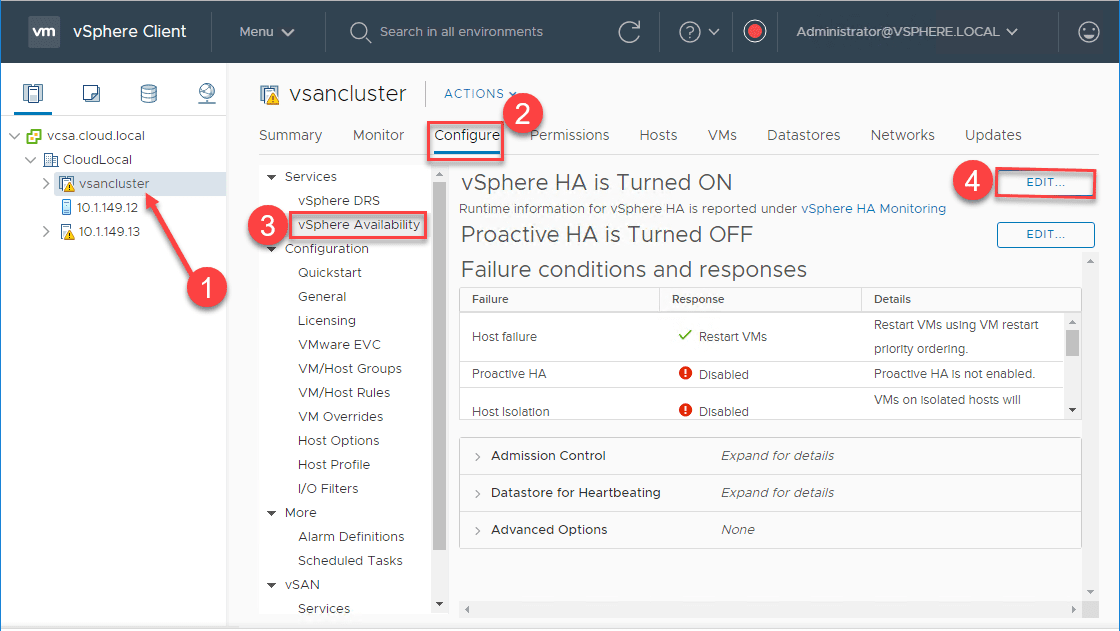
Navigate to the Cluster settings > Configure > Services > vSphere Availability > Edit
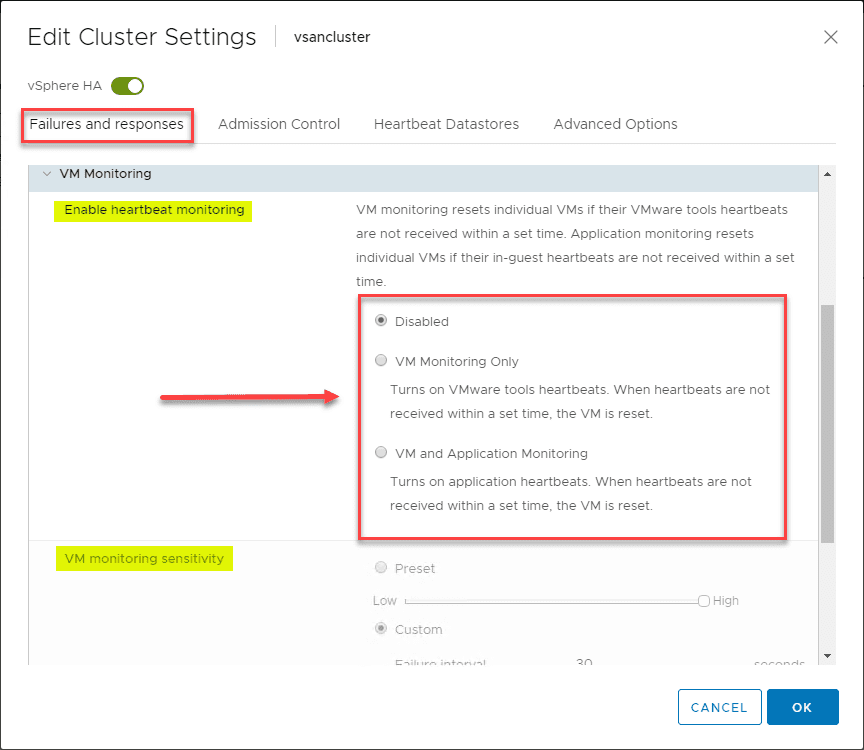
Under Failures and responses > VM Monitoring you can select which option you want to enable.
- Disabled
- VM Monitoring Only
- VM and Application Monitoring
After you enable either VM monitoring or both, you can set the VM monitoring sensitivity to define the aggressiveness of which the monitoring determines a failure has occurred. You can use either the Presets option with the slider from Low to High, or you can use the Custom option.
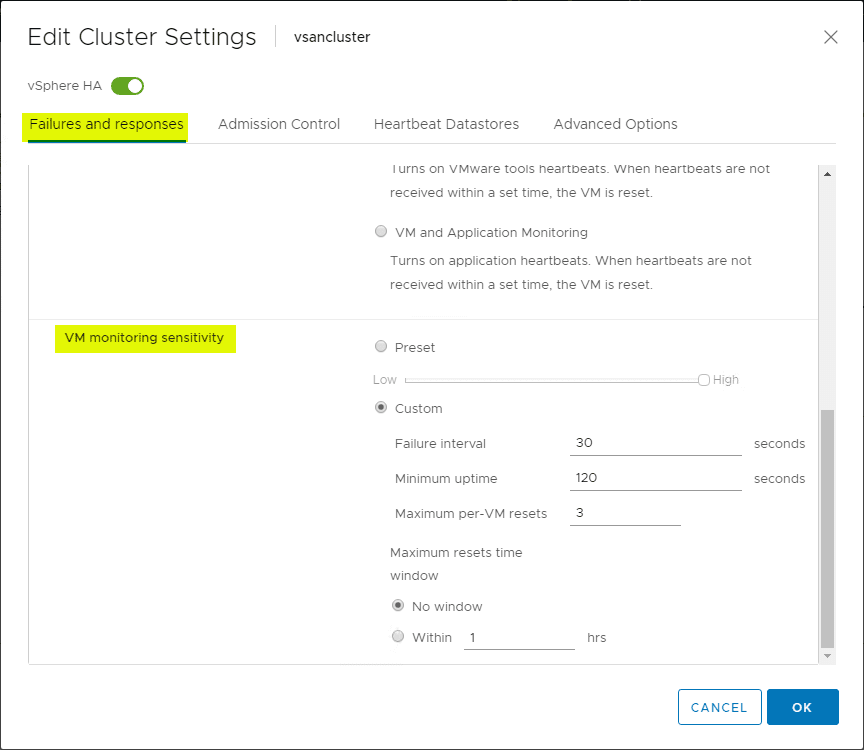
Another interesting setting is the Maximum per-VM resets option. The purpose of this setting is to avoid continually resetting a particular VM for possibly non production impacting errors. This setting by default is set to allow only three resets of a virtual machine in a certain configurable time period.
Once the Maximum per-VM reset limit is reached, vSphere HA will no longer attempt to reset the VM until after the specified time has transpired. A note about what defines reset statistics. When a VM is powered off, these statistics are reset. Also, a vMotion to a different ESXi host will clear these statistics also.
Thoughts
Using the VM and Application Monitoring of VMware vSphere HA is a great way to extend the power of HA in your vSphere environment. In this way, you have a means to monitor your individual VMs and application health which can also impact business-continuity outside of an all-out host failure.
Using VMware vSphere HA VM and Application Monitoring is an easy feature to take advantage of since it is a few simple settings found in the settings of vSphere HA at the cluster level.
Google is updating how articles are shown. Don’t miss our leading home lab and tech content, written by humans, by setting Virtualization Howto as a preferred source.
About The Author


From where can we pick any application core process (on which application is dependent) which we want to monitor ?