


I have shared quite a bit of content on the tools I use in my current monitoring stack. However, I haven’t really shared the details of what I actually “alert” on. We all know we need to be monitoring our home labs and services we are serious about. But, what do we actually alert on? If there is one lesson I have learned over the years of running a home lab, it is this: problems there, like in production, are almost never as stressful when you know about them early. In this post, I want to walk through the alerts I personally refuse to live without, what I intentionally ignore, and why push alerting has become one of the most valuable upgrades in my home lab.
Basic difference between monitoring and alerting
First of all, are monitoring and alerting one in the same? No. We can monitor many things, but generally speaking, the reason you monitor services, apps, etc is to make sure they are reachable and that they are running within the thresholds that have been determined to be normal for that app or service.
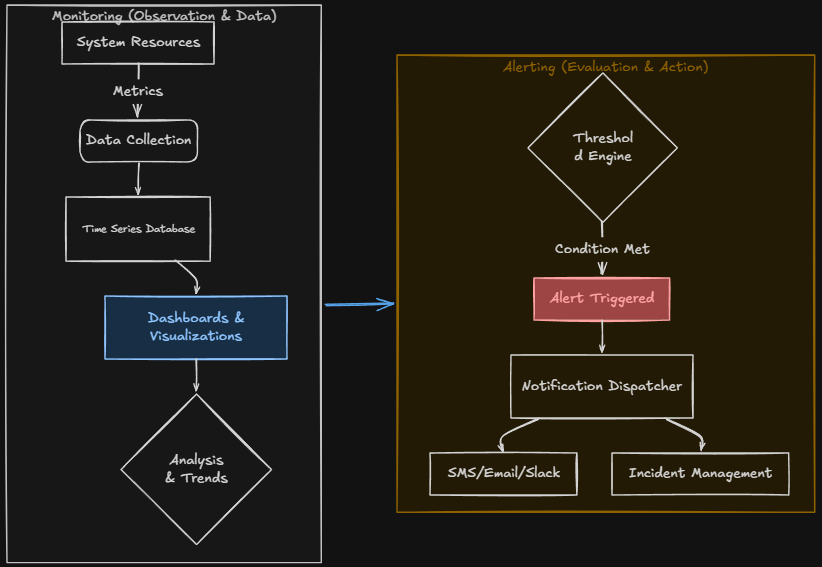
Since most of us aren’t glued to our monitoring dashboards 24×7 for apps we have deployed in the home lab, we have to rely on alerting as part of effective monitoring. Alerting refers to actually getting notified when anomalies or outages happen. So, alerting is a super important part of monitoring in my opinion.
Why push alerts for me?
But, why push alerts? Isn’t alerting using something like e-mail alerting good enough? Like many, I have used e-mail alerts for decades, both in production environments, and in the home lab. There are several reasons though that I am no longer using email notifications in the home lab.
First of all, e-mail services are getting harder and harder to use without rigorous configurations that help to make sure your e-mail is viewed as legitimate. The war on SPAM is never ending. The big players in e-mail have introduced so many rules and restrictions with sending emails that it is getting super hard to use it as a platform for reliable notifications. Even when you do things right, often, emails from the home lab may get tarpitted or rate limited, especially if you have an outage and your environment is spewing lots of alerts.
For me push alerts have become the solution to this issue. I use a combination of Mailrise and Pushover for the majority of my alerting and Ntfy as well. Mailrise and Ntfy are the relays that deliver the push notifications to Pushover, and then Pushover is the actual service that delivers the notifications to your devices. Mailrise is a proxy tool that “listens” on normal SMTP ports for devices and services that may only still be able to notify to email and then it translates this to modern notification service solutions like Pushover.
I did an entire video on this setup here:
What I like about Pushover is that it has basically a $5 perpetual license that will get you a lifetime of messaging.
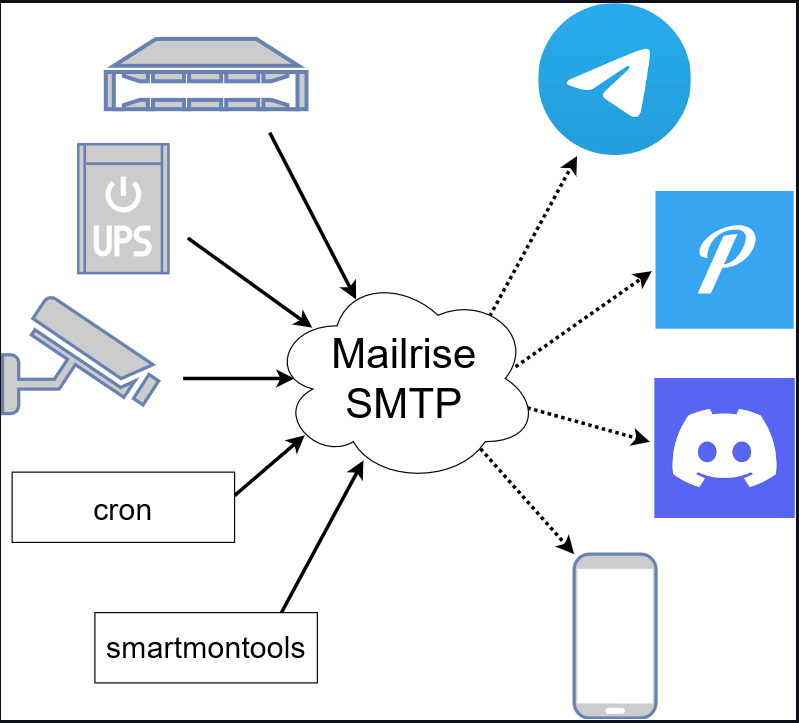
By combining these tools, you can have instant push alerts delivered to your phone, desktop, and other devices to notify you that something is down or not working. Granted, Pushover and other push alert services also have some mechanisms in place that help prevent just a flood of messages, but you aren’t having to fight against tons of requirements just to get reliable messaging through.
Ok, now that you know what I use for actually getting alerts delivered, what do I actually alert on in my home lab? Let’s walk through the various pieces and parts of the environment and see what I am actually doing to give you some ideas in your own environment.
What I alert on in my hypervisor
The hypervisor layer is one of the most important places to configure your alerting. The reason for this is that if your infrastructure layer has issues, everything above it will become unstable. This is true whether you are running Proxmox, VMware, Hyper-V, or another platform.
I am running Proxmox VE Server as my hypervisor of choice in 2026. What alerts do I care about at this level of my self-hosting infrastructure? These are the alerts I generally care about getting related to my Proxmox environment:
- Host offline
- Cluster quorum problems
- Storage nearing capacity
- Backup failures
- Replication failures
- High availability service failures
- Hardware warnings
- Unexpected reboots
- Network failures
For Proxmox specifically, I pay close attention to cluster health warnings or any node specific warnings, like a node being offline or not communicating. Also, storage alerts are critical, especially for shared storage. Nothing will ruin a day faster than discovering a storage pool at 100% and VMs failing or crashing.
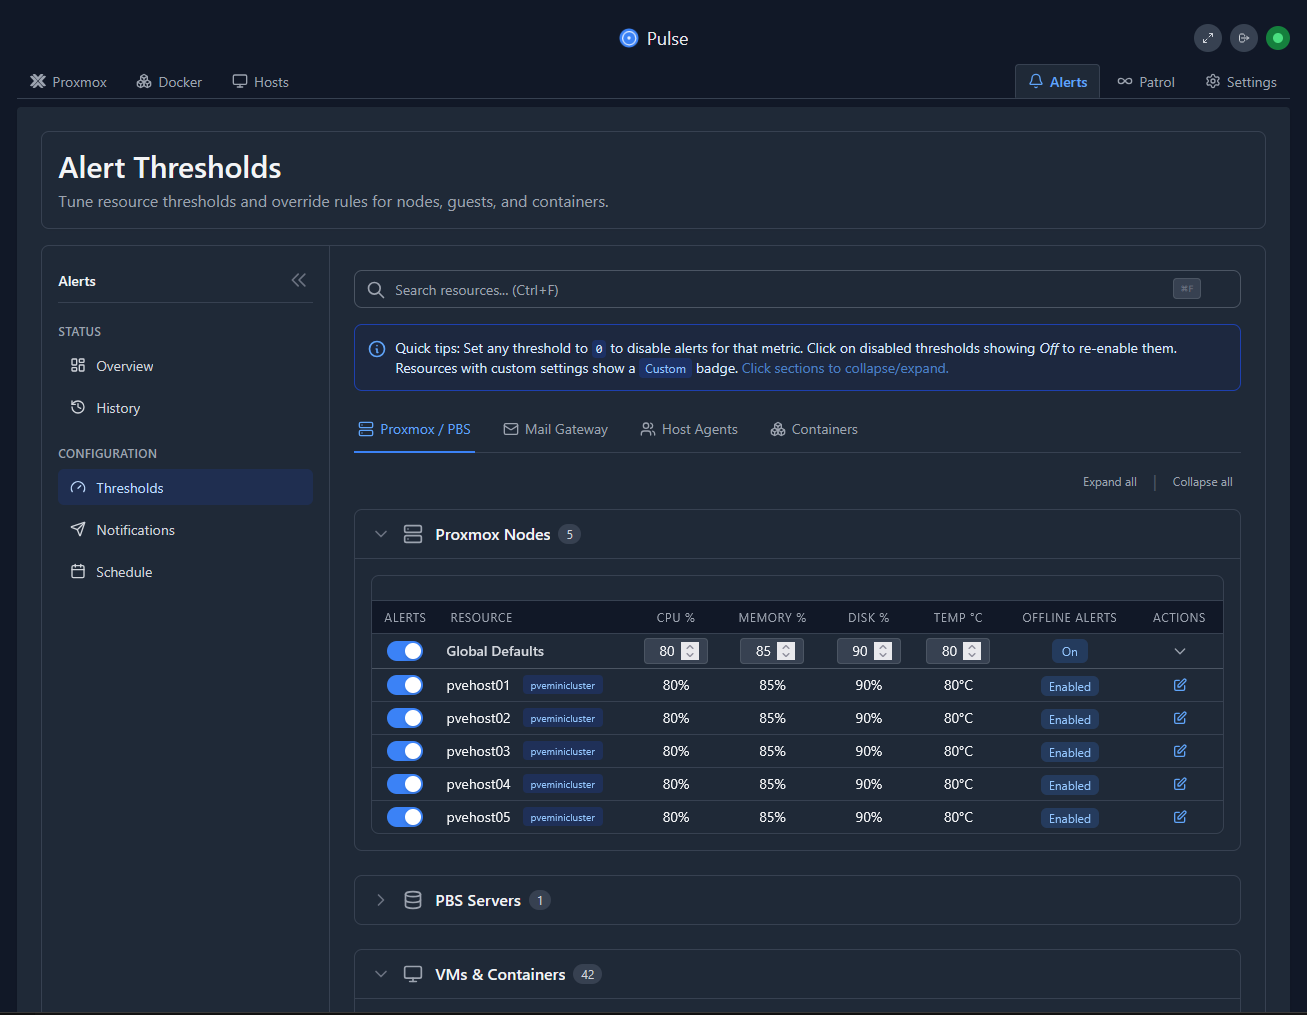
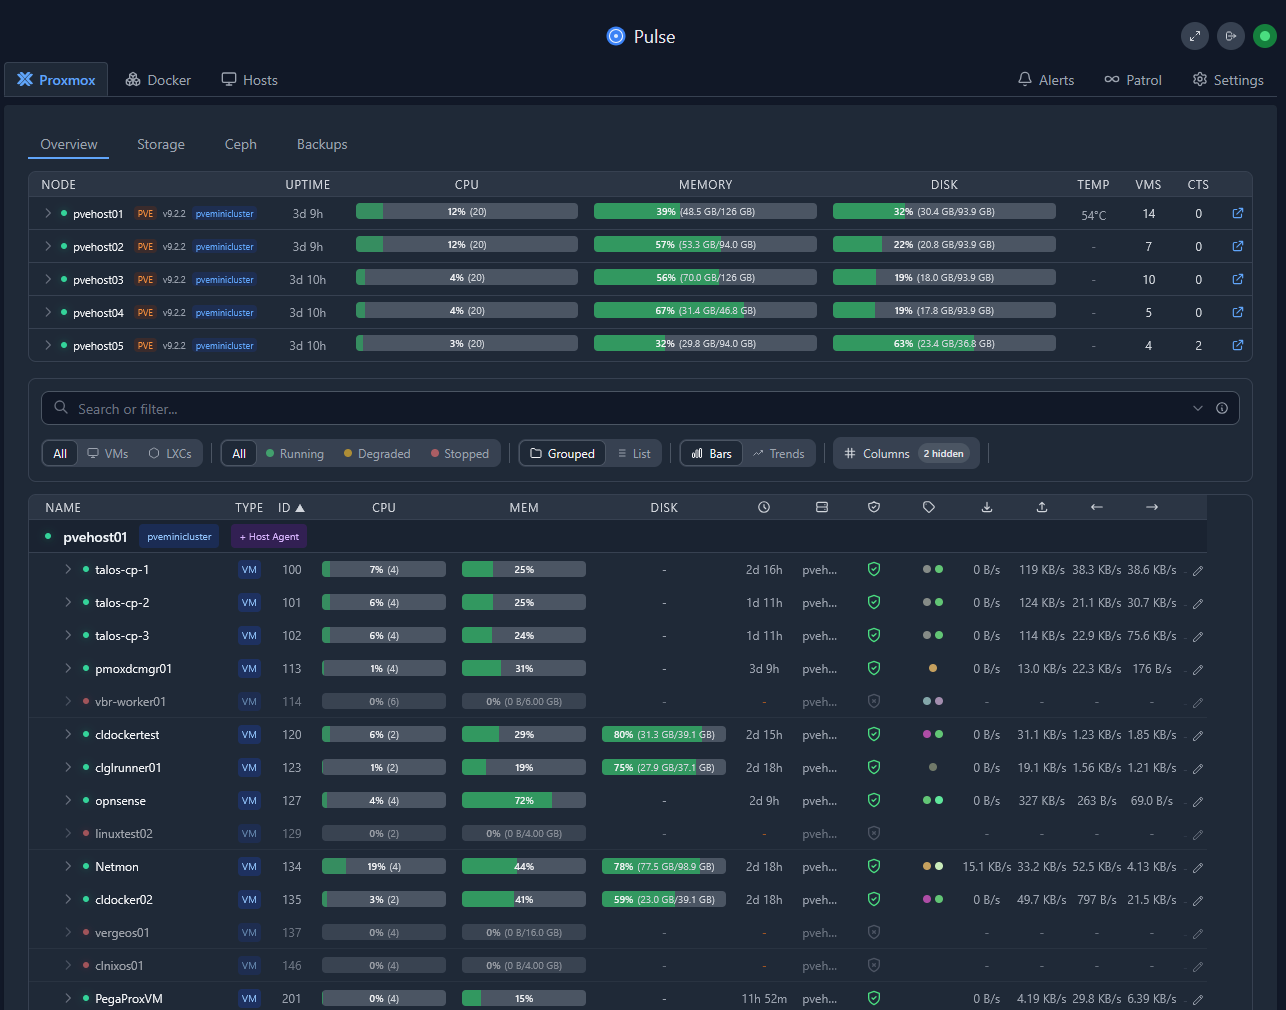
Pulse, under the Alert > Thresholds configuration, allows you to setup your thresholds on which you can trigger alerts:
Alerting tools
What specific tools am I using related to the Proxmox hosts themselves? There are three in my environment that are critical to my alerting in this space. These are:
- Pulse – This one keeps an eye on just about everything, including monitoring hosts (temps, connectivity, etc), and down to the VM, LXC, and Docker level.
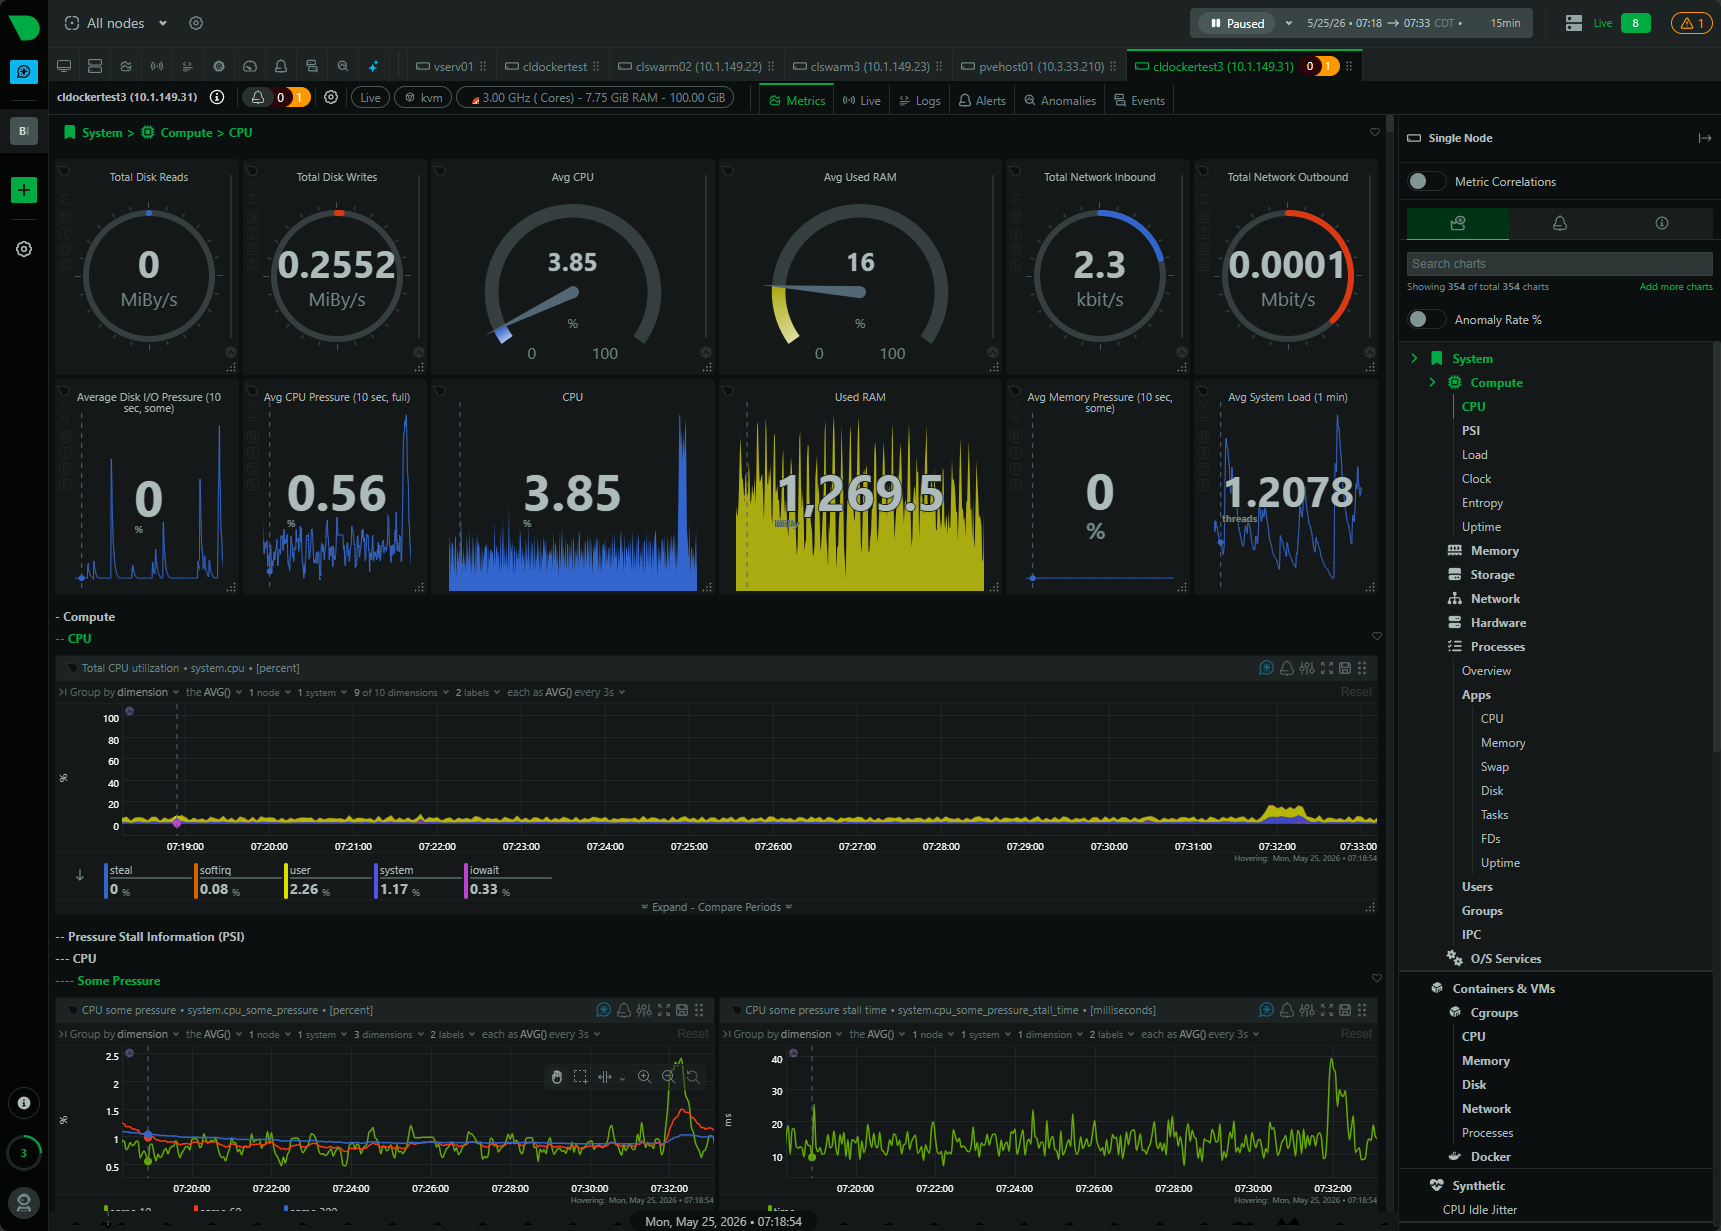
- Netdata – Netdata is my outside of my home lab environment monitoring. Having a cloud monitor helps me to make sure that if my actual monitoring infrastructure goes down that takes down Pulse, etc, I still have a way to get notified that something isn’t right. But with the node agents I have loaded it can also monitor SMART data, VMs, etc.
- ProxMenux – I use ProxMenux for monitoring a lot of the hardware in my environment. It monitors temps, SMART data, and other things along the lines of hardware so you know if something has failed from that layer.
What I alert on in Docker
For me also, monitoring my Docker environment is super important. I am running more apps and services in containers these days than I am virtual machines in my home lab. So, monitoring these containers is especially important.
Docker environments also can fail differently than traditional VMs. Containers can fail quickly and quiety, until you have something notify you that a service is down, etc. Containers can also get into restart loops and become unhealthy. Storage can fill up on container hosts or logs can grow to be enormous behind the scenes without being obvious.
What are some of the Docker alerts that I care about in my environment?
- Container stopped unexpectedly
- Container in “unhealthy” state
- Disk utilization thresholds
- Reverse proxy failures (caught usually with other alerting such as URL monitoring)
- SSL certificate expiration (URL monitoring, etc)
- Excessive restart loops
- Failed updates
- Internal service downtime
- General errors and warnings in logs (I get these with Loggifly)
Alerting tools
What do I use to monitor my Docker containers in the home lab? As always, it is a combination of tools and alerting.
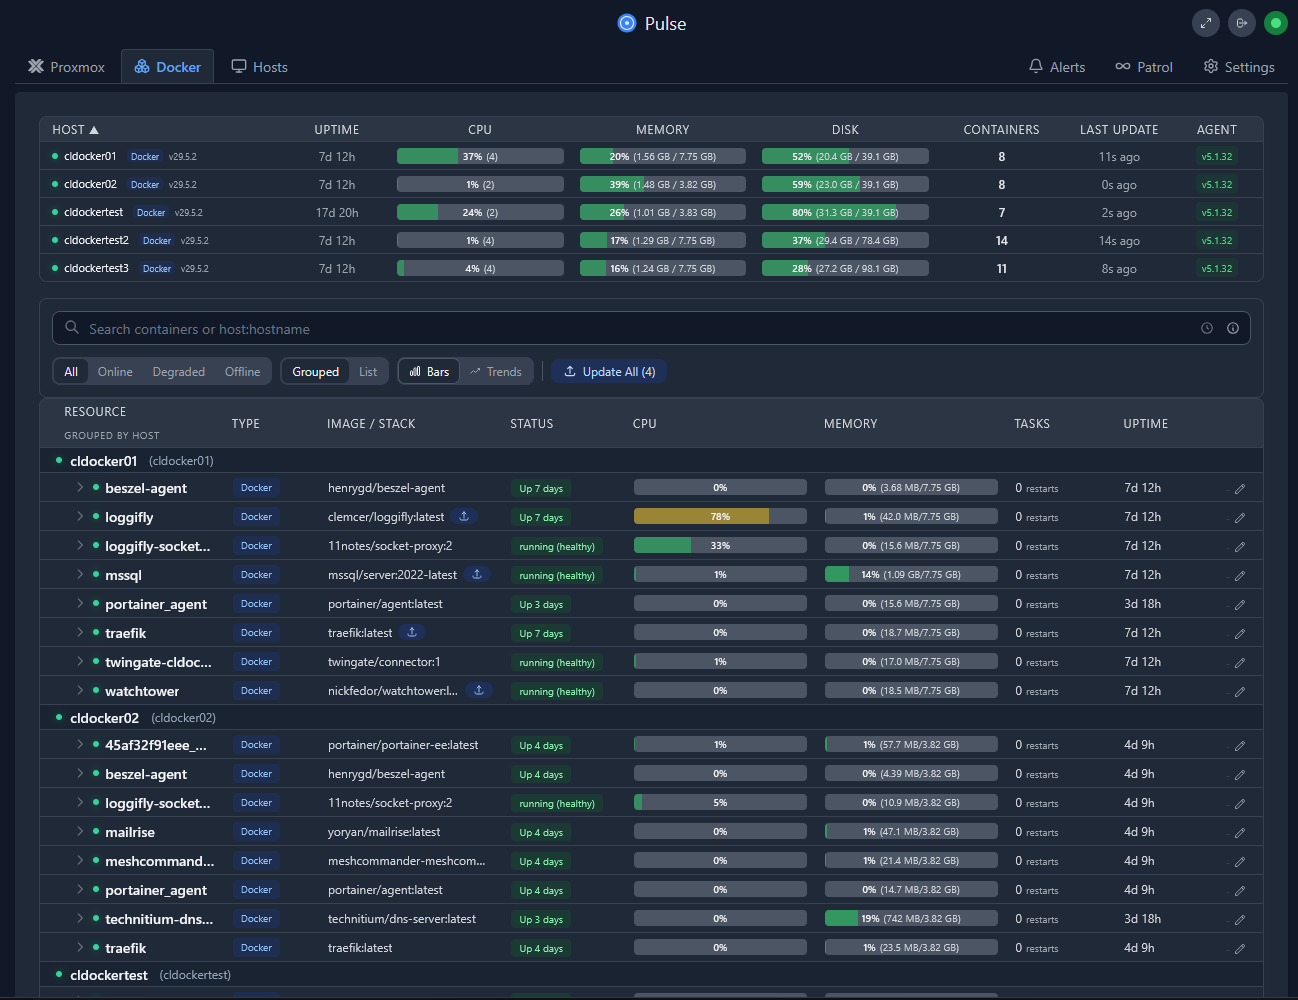
- Pulse – General container monitoring
- Netdata – Docker host monitoring which monitors containers & health
- Loggifly – This is a really great little tool that can be used to scrape your Docker logs to see if there are certain keywords appearing in your containers, like “warning”, “error”, or anything else you want to key in on
- PRTG & Uptime Kuma – Here I use a combination of things. I am currently using PRTG for URL monitoring, but looking at transitioning this off to open source tools like Uptime Kuma. If your URL is down, then you know the underlying infrastructure is having some type of issue.
Below is a look at the dashboard in Netdata for a Docker host:
Pulse also has excellent visibility and monitoring specific to docker:
What I alert on in Kubernetes
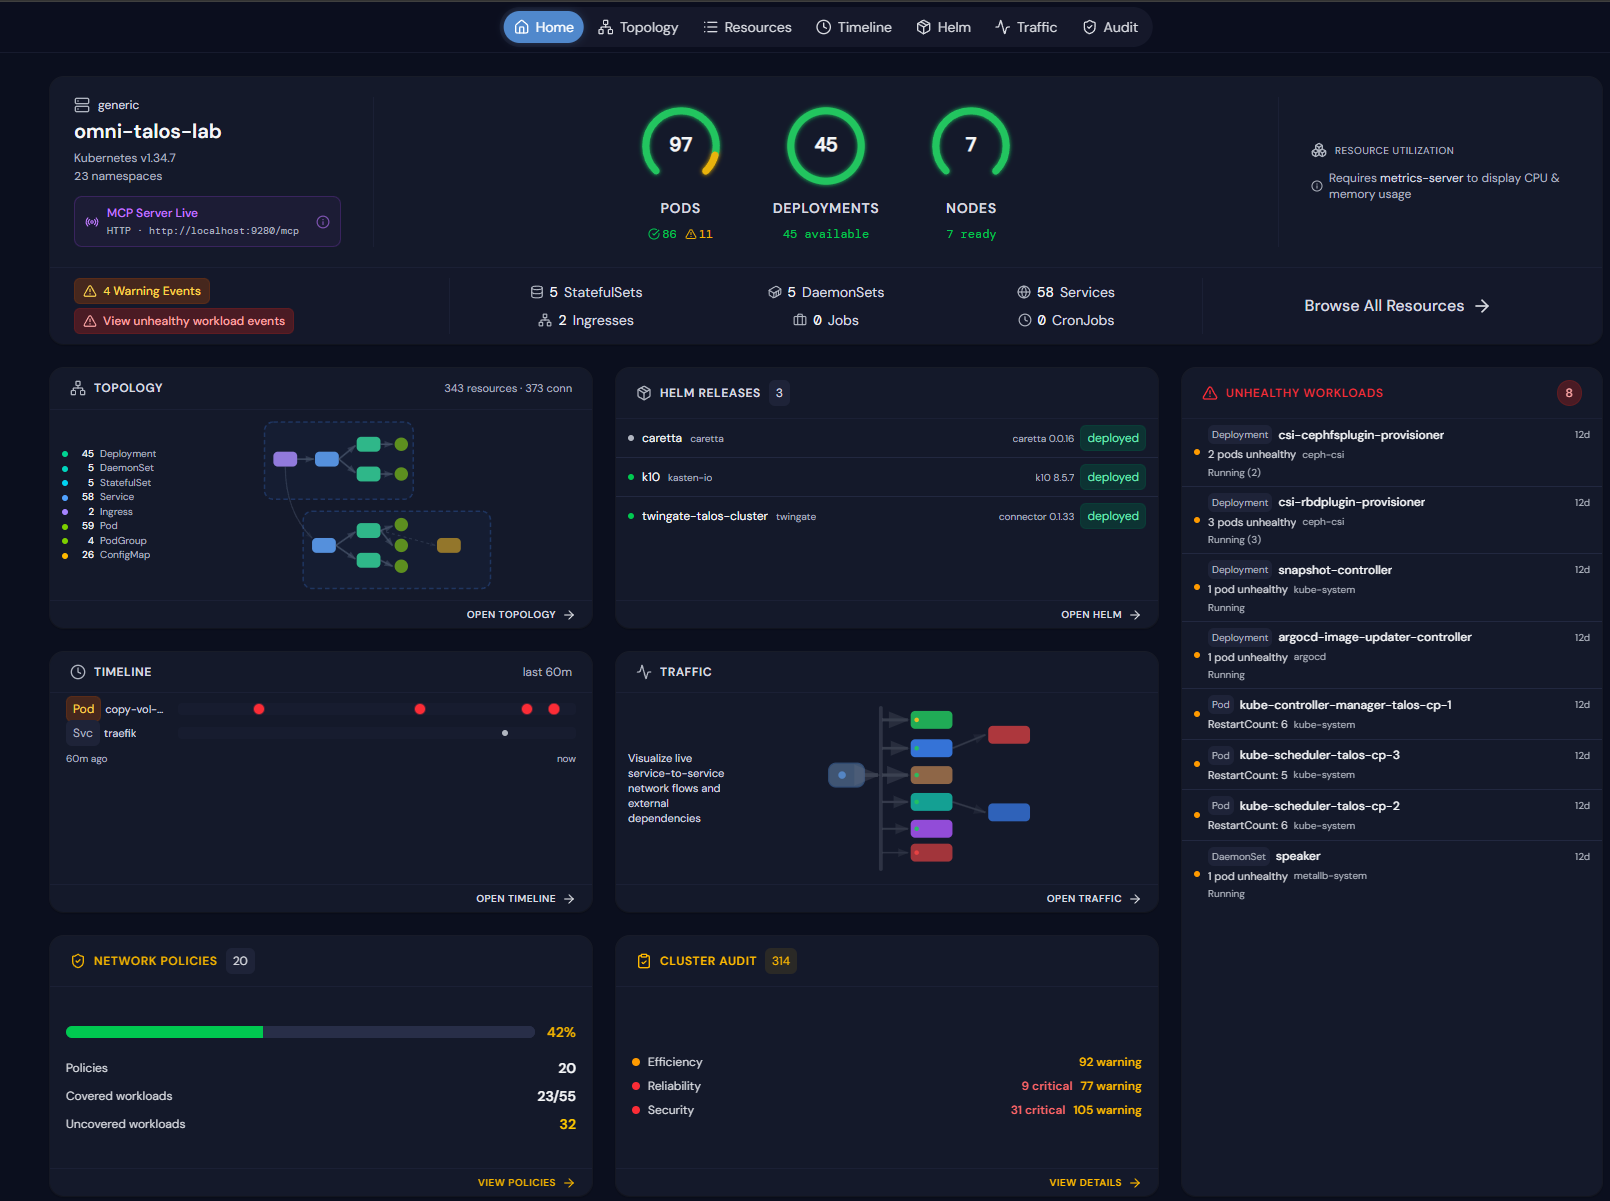
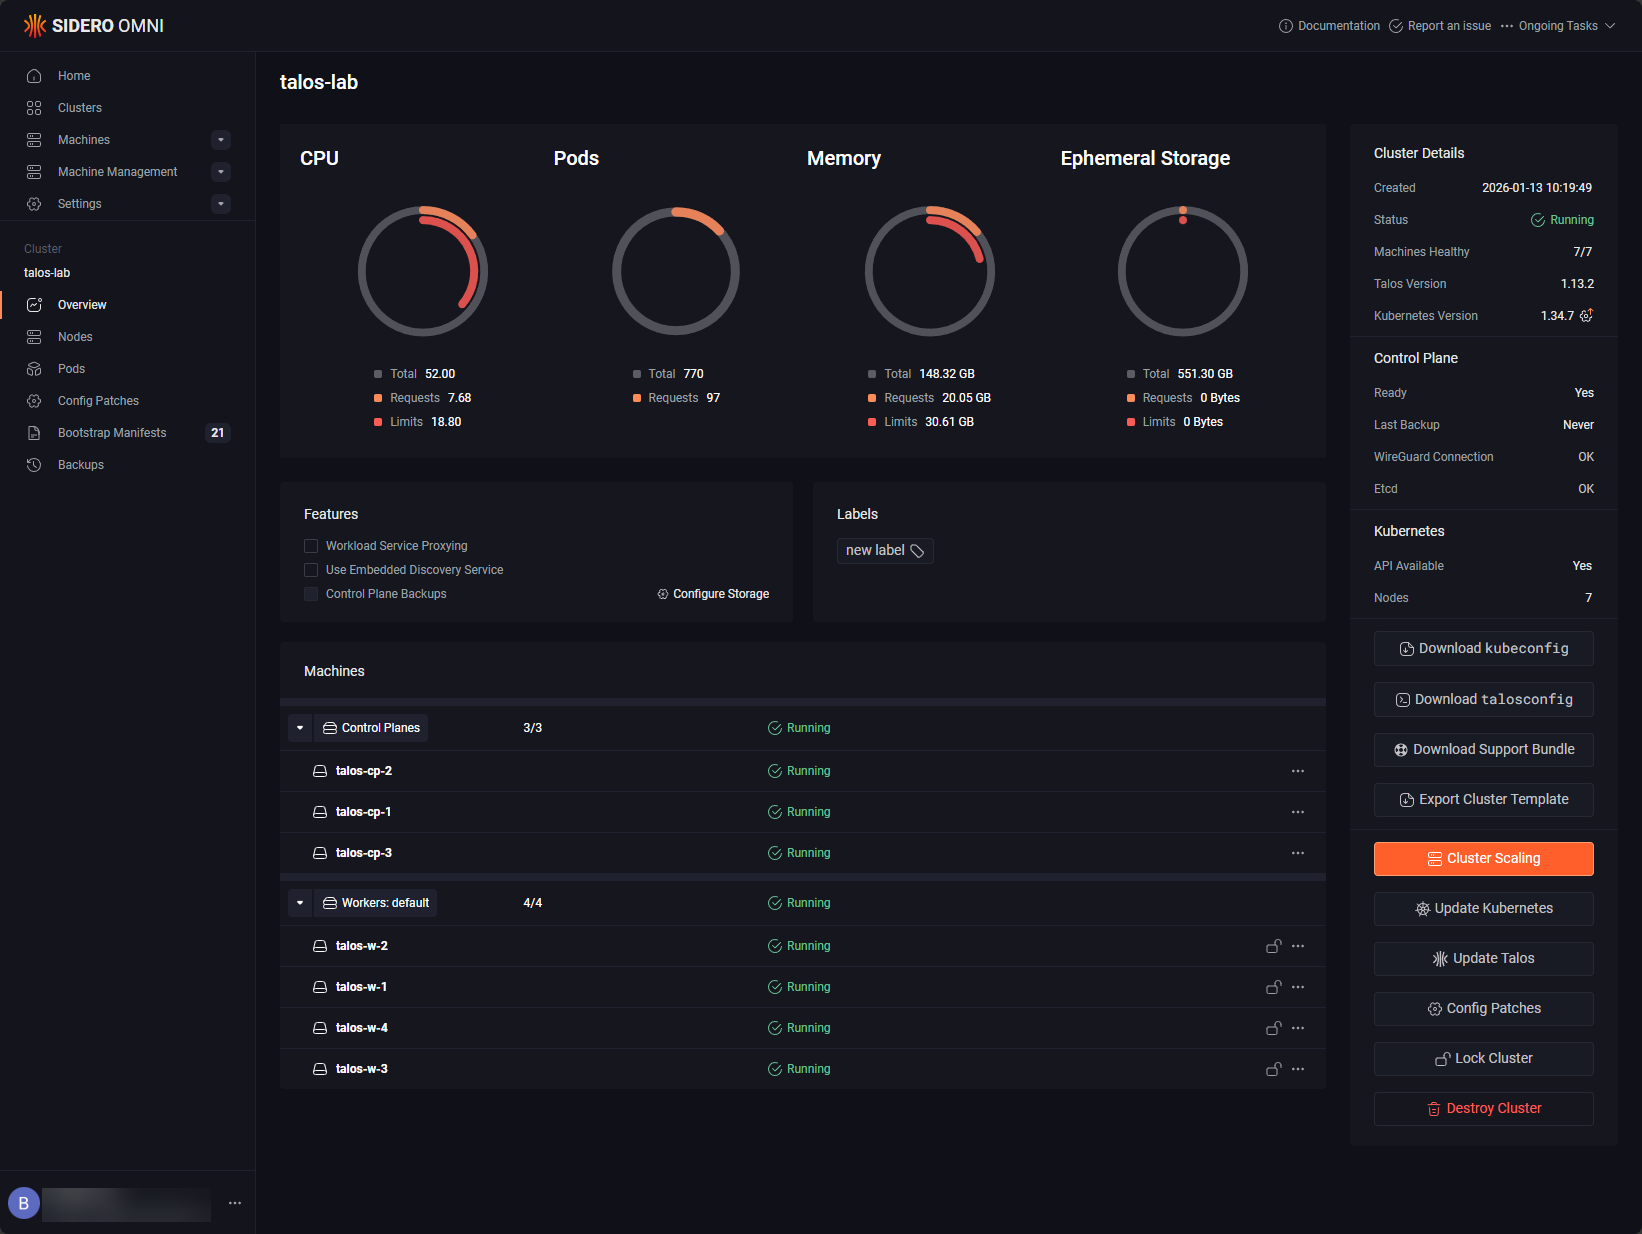
Kubernetes adds another layer of complexity because its workloads are dynamic and self-healing. But again, there are some general things here that I do. Like monitoring my underlying Kubernetes nodes. For me this is Talos Linux running Kubernetes on top of my Proxmox environment. I have (3) control plane VMs and (4) worker nodes that run in my environment.
So, you can do some smart things here like monitoring CPU and memory on your Kubernetes nodes (control and worker nodes). This will tell you if you have pressure on any of the nodes in the environment which will start to degrade your app performance. Of course this also means monitoring the uptime of those Kubernetes nodes.
Below is the tool, Skyhook Radar. It provides great visibility on your Kubernetes clusters, is a single binary, and super easy to run.
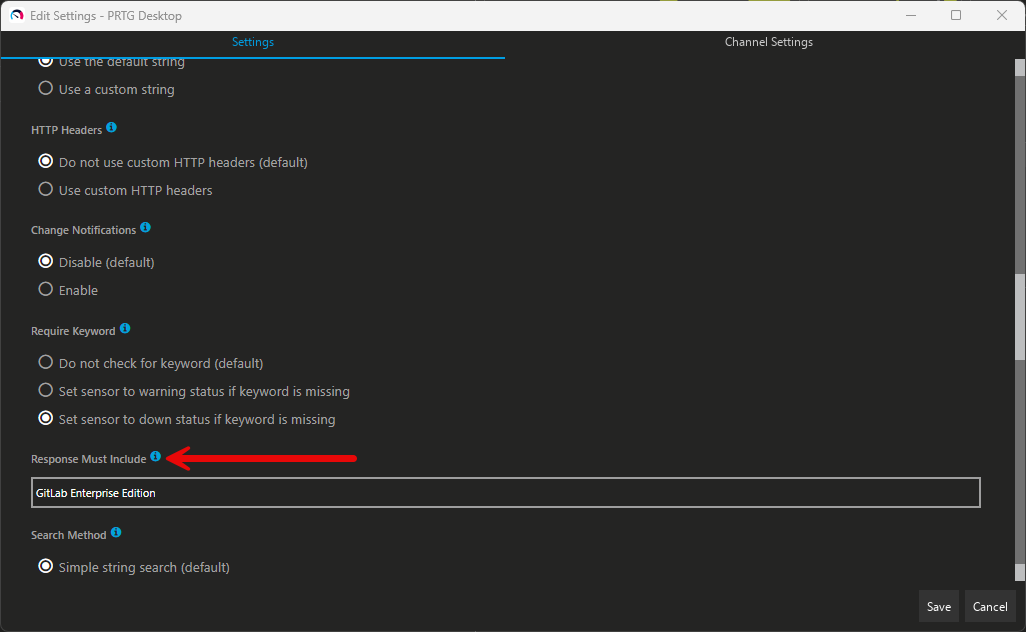
Also, of course with Kubernetes, a lot of the workloads I am running there are apps and services that have a web URL that I can monitor. So, if the URL goes to a 404 or something else, I know there is an issue there. I also do key phrase scraping in my web monitoring so I know if a word exists or not. So if the URL returns a phrase or doesn’t return a phrase that would indicate the service is healthy, I know quickly. This helps with partial type failures where the website is technically reachable but obviously has something going on with it.
Below is a look at the settings on my PRTG instance I have running which checks on my GitLab instance for the key words “GitLab Enterprise Edition”:
What are some general things that you can alert on with Kubernetes?
- Node not ready
- Persistent volume failures
- Pod crash loops
- Resource exhaustion
- Failed workloads
- Ingress failures
- Certificate expiration
- Backup failures
- Storage degradation
Alerting tools
What are the tools that I use to alert on my Kubernetes stack? Again, a combination of things here. I of course monitor my Proxmox nodes using the stack I mentioned at the outset, but this also helps with monitoring Kubernetes:
- Pulse – monitors the Proxmox hosts, but also the Talos Linux VMs to help identify issues with those specific VMs
- Talos Omni – gives me Talos specific monitoring and dashboarding capabilities
- URL monitoring – PRTG and Uptime Kuma
- Netdata – offsite monitoring of my Proxmox nodes and VMs
What I alert on in storage and disks
Storage is super important with your monitoring as this is the backbone of all your data. So I monitor a combination of things here. Of course, monitoring the Proxmox nodes themselves is important so that if I lose a node, I will know quickly.
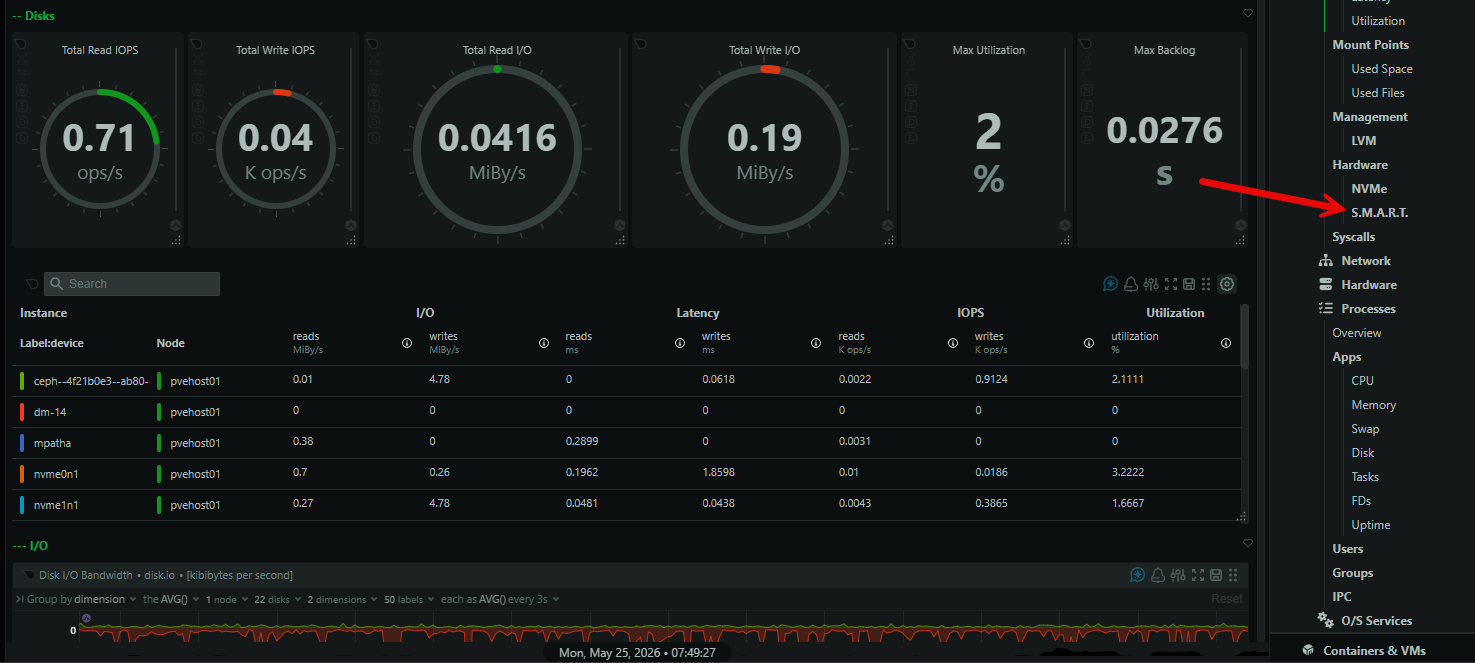
But, also, I of course want to monitor the SMART data coming from the physical disks. This helps to give visibility on issues that are related to disks starting to fail or getting unrecoverable failures. This helps to cover from a hardware perspective.
Netdata monitors your disk’s SMART data which I use as another way to have visibility on this:
Also, I run Ceph HCI storage with Proxmox. So making sure I have alerting setup with Ceph allows me to have that layer of visibility as well so that I can get alerted on specific Ceph events. Even things that I trigger will send an alert, like setting an OSD to “noout” or turning off rebalancing if I know I am going down for a maintenance period. I get alerted for these types of events which are very helpful to have visibility at the Ceph layer.
Alerting tools
What tools do I use here? Many of the aforementioned ones, but here is how I am using them:
- Pulse – general Proxmox node monitoring. This monitors the host and also SMART data
- ProxMenux – another layer of hardware monitoring
- Netdata – offsite monitoring of SMART data
- Ceph alerting – alerts on various Ceph health statuses and messaging
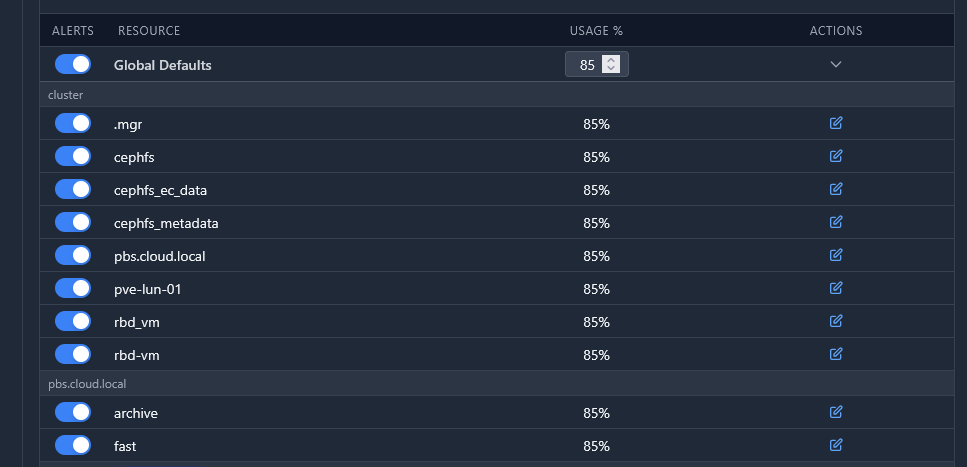
Storage usage alert thresholds setup in pulse:
What I alert on for internal websites and services
You have seen me already mention this above. But I definitely monitor internal websites and services that are exposed on a URL. This helps me to monitor at the actual application level. If everything is healthy, your URLs should be reachable and able to be accessed.
As I mentioned under the Kubernetes section, I also look at key phrases on websites that I am checking. This helps to avoid the situation where technically “something” is answering on the port, but the web page that is displaying, is actually displaying an error and not the application. My personal stance is that you need to have both a basic port check to make sure the port is open and available but also have an HTTP advanced check of some sort that looks at elements on the page to validate the page is good from an app level.
What are some types of URLs that I check?
- Internal dashboards
- Reverse proxy endpoints
- Authentication services
- Password managers
- Git hosting platforms
- RSS services
- Internal web apps
- APIs
Making sure that certificates are good is also another check that you can make on your web URL checks. For me this also helps to validate that I don’t have issues with my Let’s Encrypt certificates. My advanced HTTP checks of web pages will also fail if it presents with a certificate warning since it won’t match the keyphrase that it expects.
Alerting tools
The following are tools that I use for alerting on URLs and web resources that I am running in my home lab. These include the following:
- PRTG – this is what I am currently using for checking my web addresses
- Uptime Kuma – a utility that is open source and allows you to monitor web URL endpoints, certificates, and more advanced web page checks.
Wrapping up
Hopefully, these details on what I am managing with each critical system in my home lab infrastructure will give you ideas of maybe some things to monitor and what tools I am using to do it. But as I have shown here, monitoring is only part of the story. Alerting is absolutely needed to have trustworthy monitoring as it is actually what lets you know that your monitoring is doing its job. The alerts allow you to proactively know about something being down or degraded before you have to find out the hard way and just stumble onto things that aren’t working. How about you? What are you using for alerting in your home lab? Are you using push notifications? What services are you monitoring, and what tools are you using for monitoring?
More in this topic



Google is updating how articles are shown. Don’t miss our leading home lab and tech content, written by humans, by setting Virtualization Howto as a preferred source.
About The Author

I found this article very useful with lots of practical advice. Proactive alerting is essential to any continuous operation, especially when the complexity of modern systems makes it difficult to see the trees from the forest.
While not emphasized in this article, proactive alerting is also essential for maintaining a sound security posture. The sooner you become aware of a problem, the more likely you will be to prevent a disaster.
eChuck,
Thanks for the comments and thoughts here! Also, your comment about security is on point here. I didn’t delve deeply in this aspect as you mention, but it is definitely a great way to keep pulse on your security posture and activities that may not be expected.
Brandon
This is quite a comprehensive article on homelab alerting. Thank you for the information and perspective.
I especially agree with your point about needing more than dashboards for understanding the real-time state of one’s self-hosted services. Which is exactly where alerts come into the picture.