I have been through a lot of the Kubernetes dashboards in my home lab and now that I am running my home lab “production” workloads on Kubernetes, I am keenly interested in cool projects I see come along. When I saw that Skyhook open-sourced their K8s dashboard, called Radar, this was definitely a tool I wanted to get in the lab and try out. At a high level, Radar is a tool that is an alternative to other tools like Lens and other dashboard type tools for Kubernetes. After spending some time with it, I can say it feels like a tool that is not just another dashboard but has something very good to offer in this space.
What is Radar?
Radar is now a free and open source dashboard tool that gives you visibility to what is happening in your Kubernetes cluster. It has a lot of great strengths as a tool I think. One of the things to note is that it is a “local-first” solution. You don’t have to install anything in your Kubernetes cluster. There is no special account required or dependency on calling back to a cloud environment (so works great if you have an airgapped environment). It’s also really fast as well and runs from a single binary.
It gives you some really cool visibility to things like:
- Topology – Topology views you can export, etc
- Event timeline – See what changes have taken place and what they lead to
- Service traffic – See your services
- Resource browsing – browse resources in your cluster and how they relate
- Helm management – see helm packages installed
- GitOps support (FluxCD and ArgoCD).
One of the super cool things that Radar has is an MCP server built-in (you can disable also if you want). So you can hook in something like Claude desktop to the Radar MCP server. With the MCP server, your AI gets pre-processed, token-optimized data (in other words you burn less tokens). Your AI also benefits from the topology graphs, health assessments, and deduplicated events, and filtered logs.
Why I think many of the Kubernetes dashboards fall short
Most of us have tried many of the dashboards that are out there to view our Kubernetes clusters. A lot of times they fall into two categories I think:
- too simple and don’t provide enough insights and visibility
- too heavy and complicated, pay only offerings, etc
Examples of too simple might be the official Kubernetes dashboard. It is as simple as they get, but doesn’t really scale very well in day to day use. Then you can go all the way up to full observability stacks with Prometheus and Grafana that can give you deep visibility but comes with a lot of complexity and upkeep.
The Lens dashboard is a good example at one of the best that strikes a good balance. I like Lens and also Aptakube which I have been using daily. However, a lot of these tools can also feel heavy at times or require more configuration to really stand out.
Radar is a solution that feels like it is trying to fix that gap in our tooling to help us have an easy and lightweight solution to get a LOT of visibility and troubleshooting tools at our fingertips.
Installing Radar
The process to get Radar installed and up and running in your environment is super easy. Since it is a single binary and there isn’t anything to install in the Kubernetes cluster itself, the barrier to entry here is minimal.
It even works on Windows! Imagine that. See my screenshot below of using PowerShell to install it in Windows:
irm https://raw.githubusercontent.com/skyhook-io/radar/main/install.ps1 | iex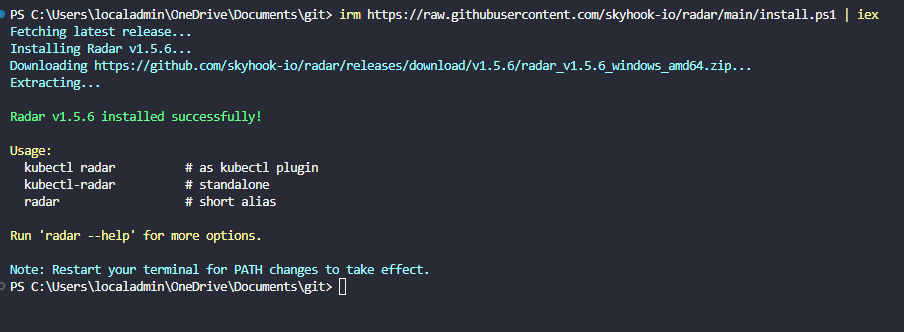
Generic install command:
curl -fsSL https://raw.githubusercontent.com/skyhook-io/radar/main/install.sh | bashOther installations are similar for Debian specific:
sudo apt install ./radar-desktop_*.debHomebrew:
brew install --cask skyhook-io/tap/radar-desktopAfter you install Radar, you can easily run this with a single command:
kubectl-radar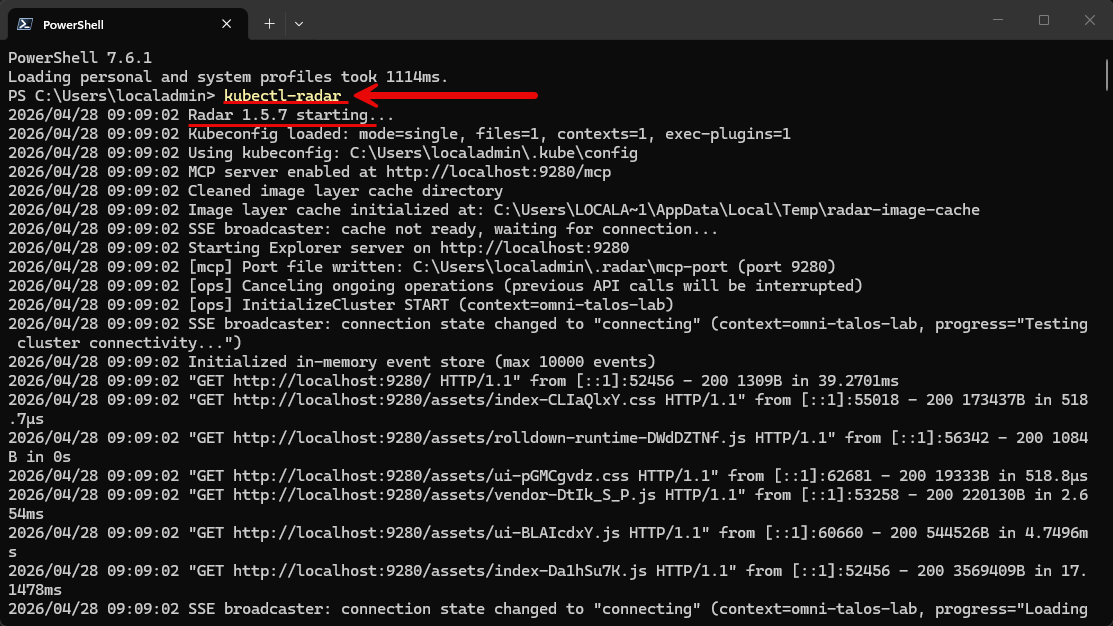
For me in the talos lab that I am running, it will open the SSO page to grant access to the cluster via kubectl. After this, you will see the Radar dashboard launch.
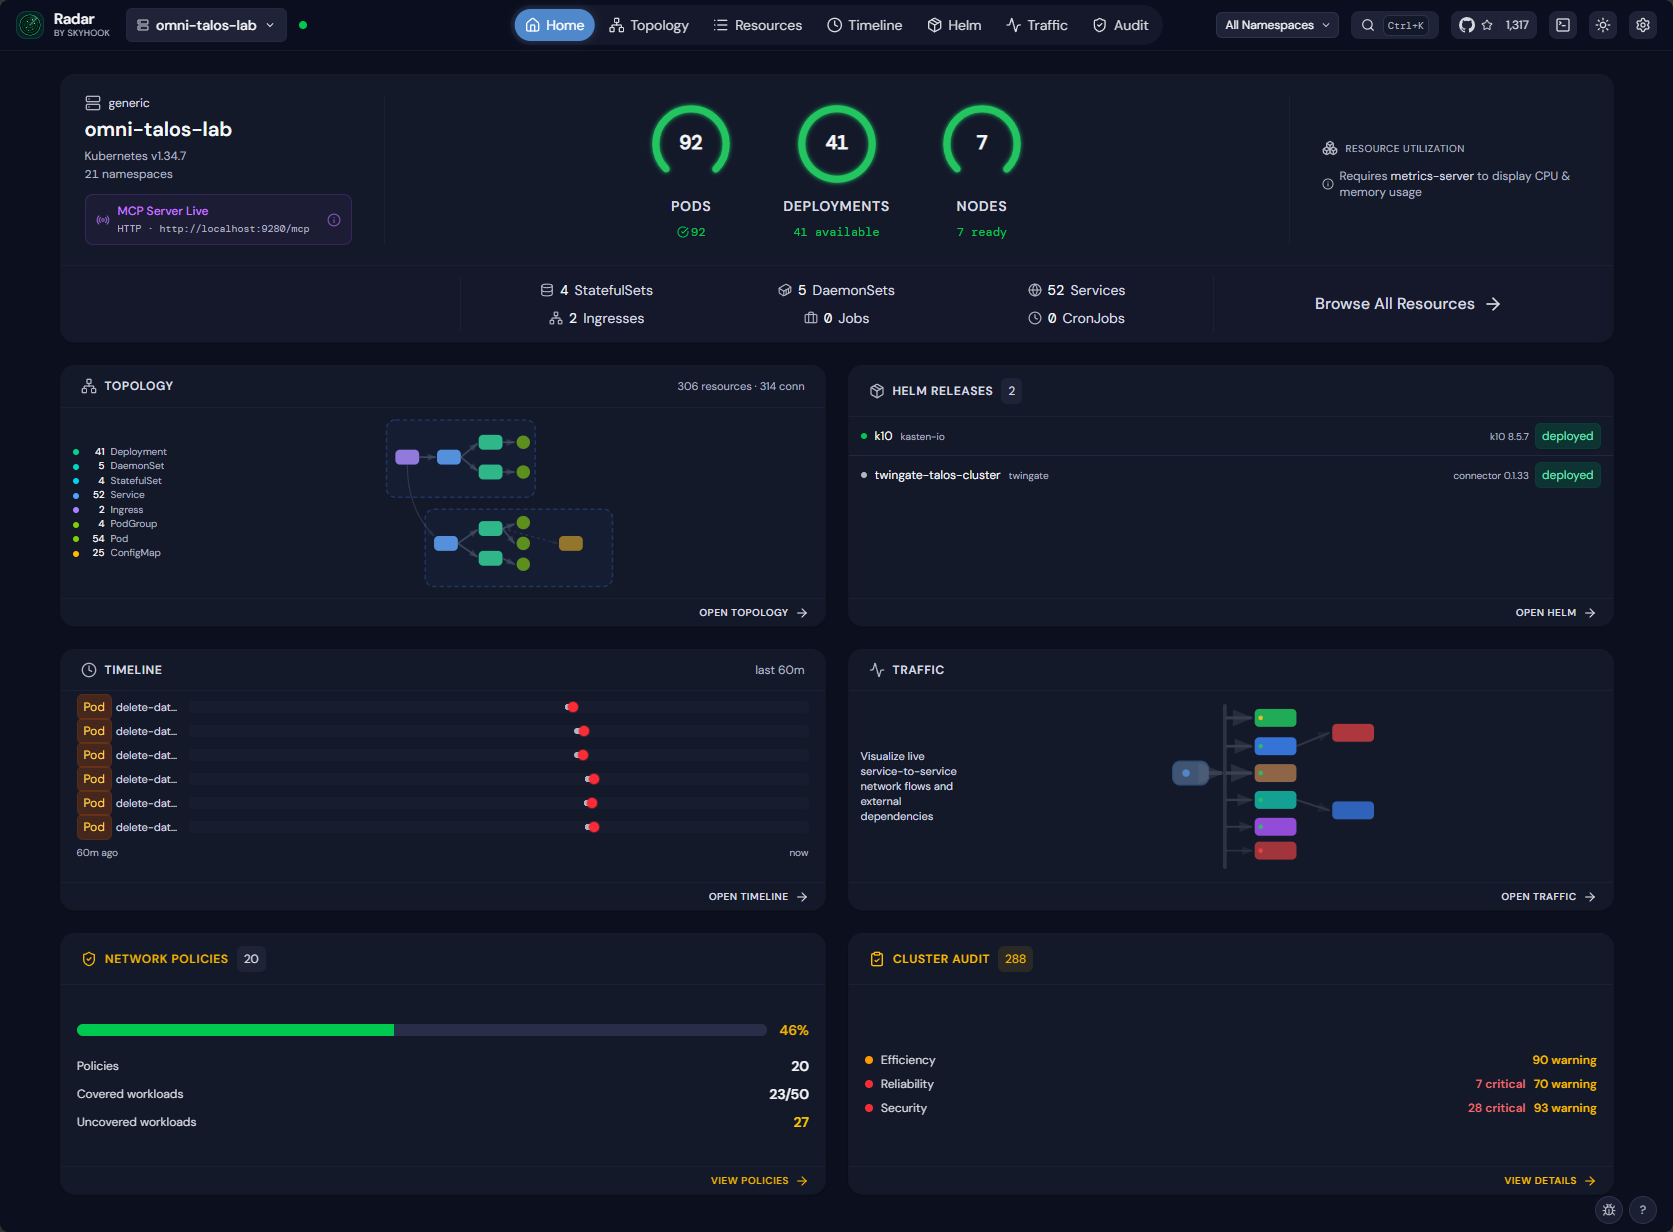
The user interface feels modern and fully featured
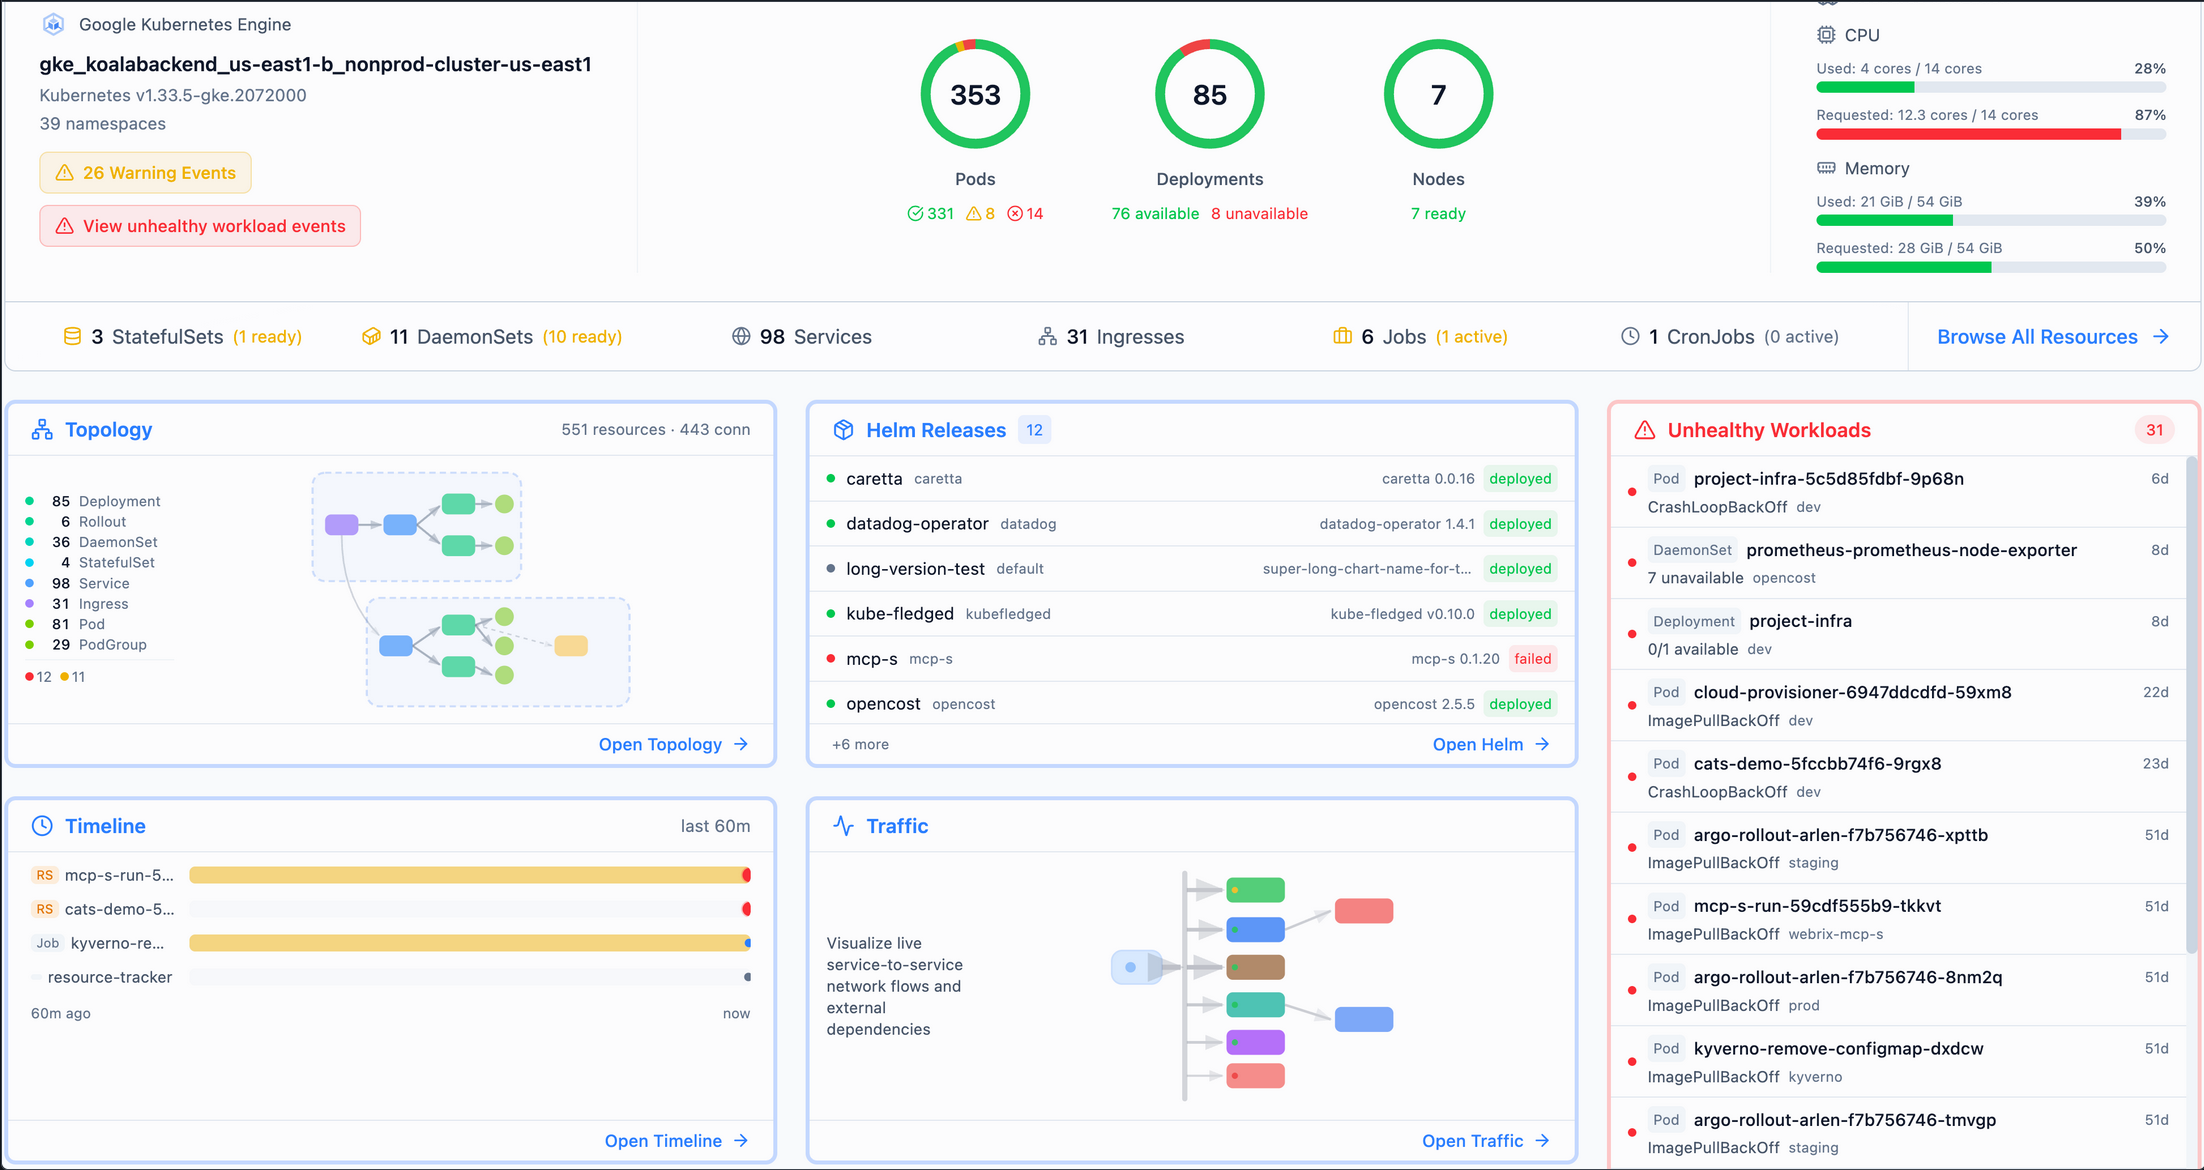
There are several things I noticed immediately about the Radar dashboard. It was super informative as soon as I launched it. With the Topology map, you get a really good overview of the applications in your cluster and how they are “wired” together. In this view below, we see everything.
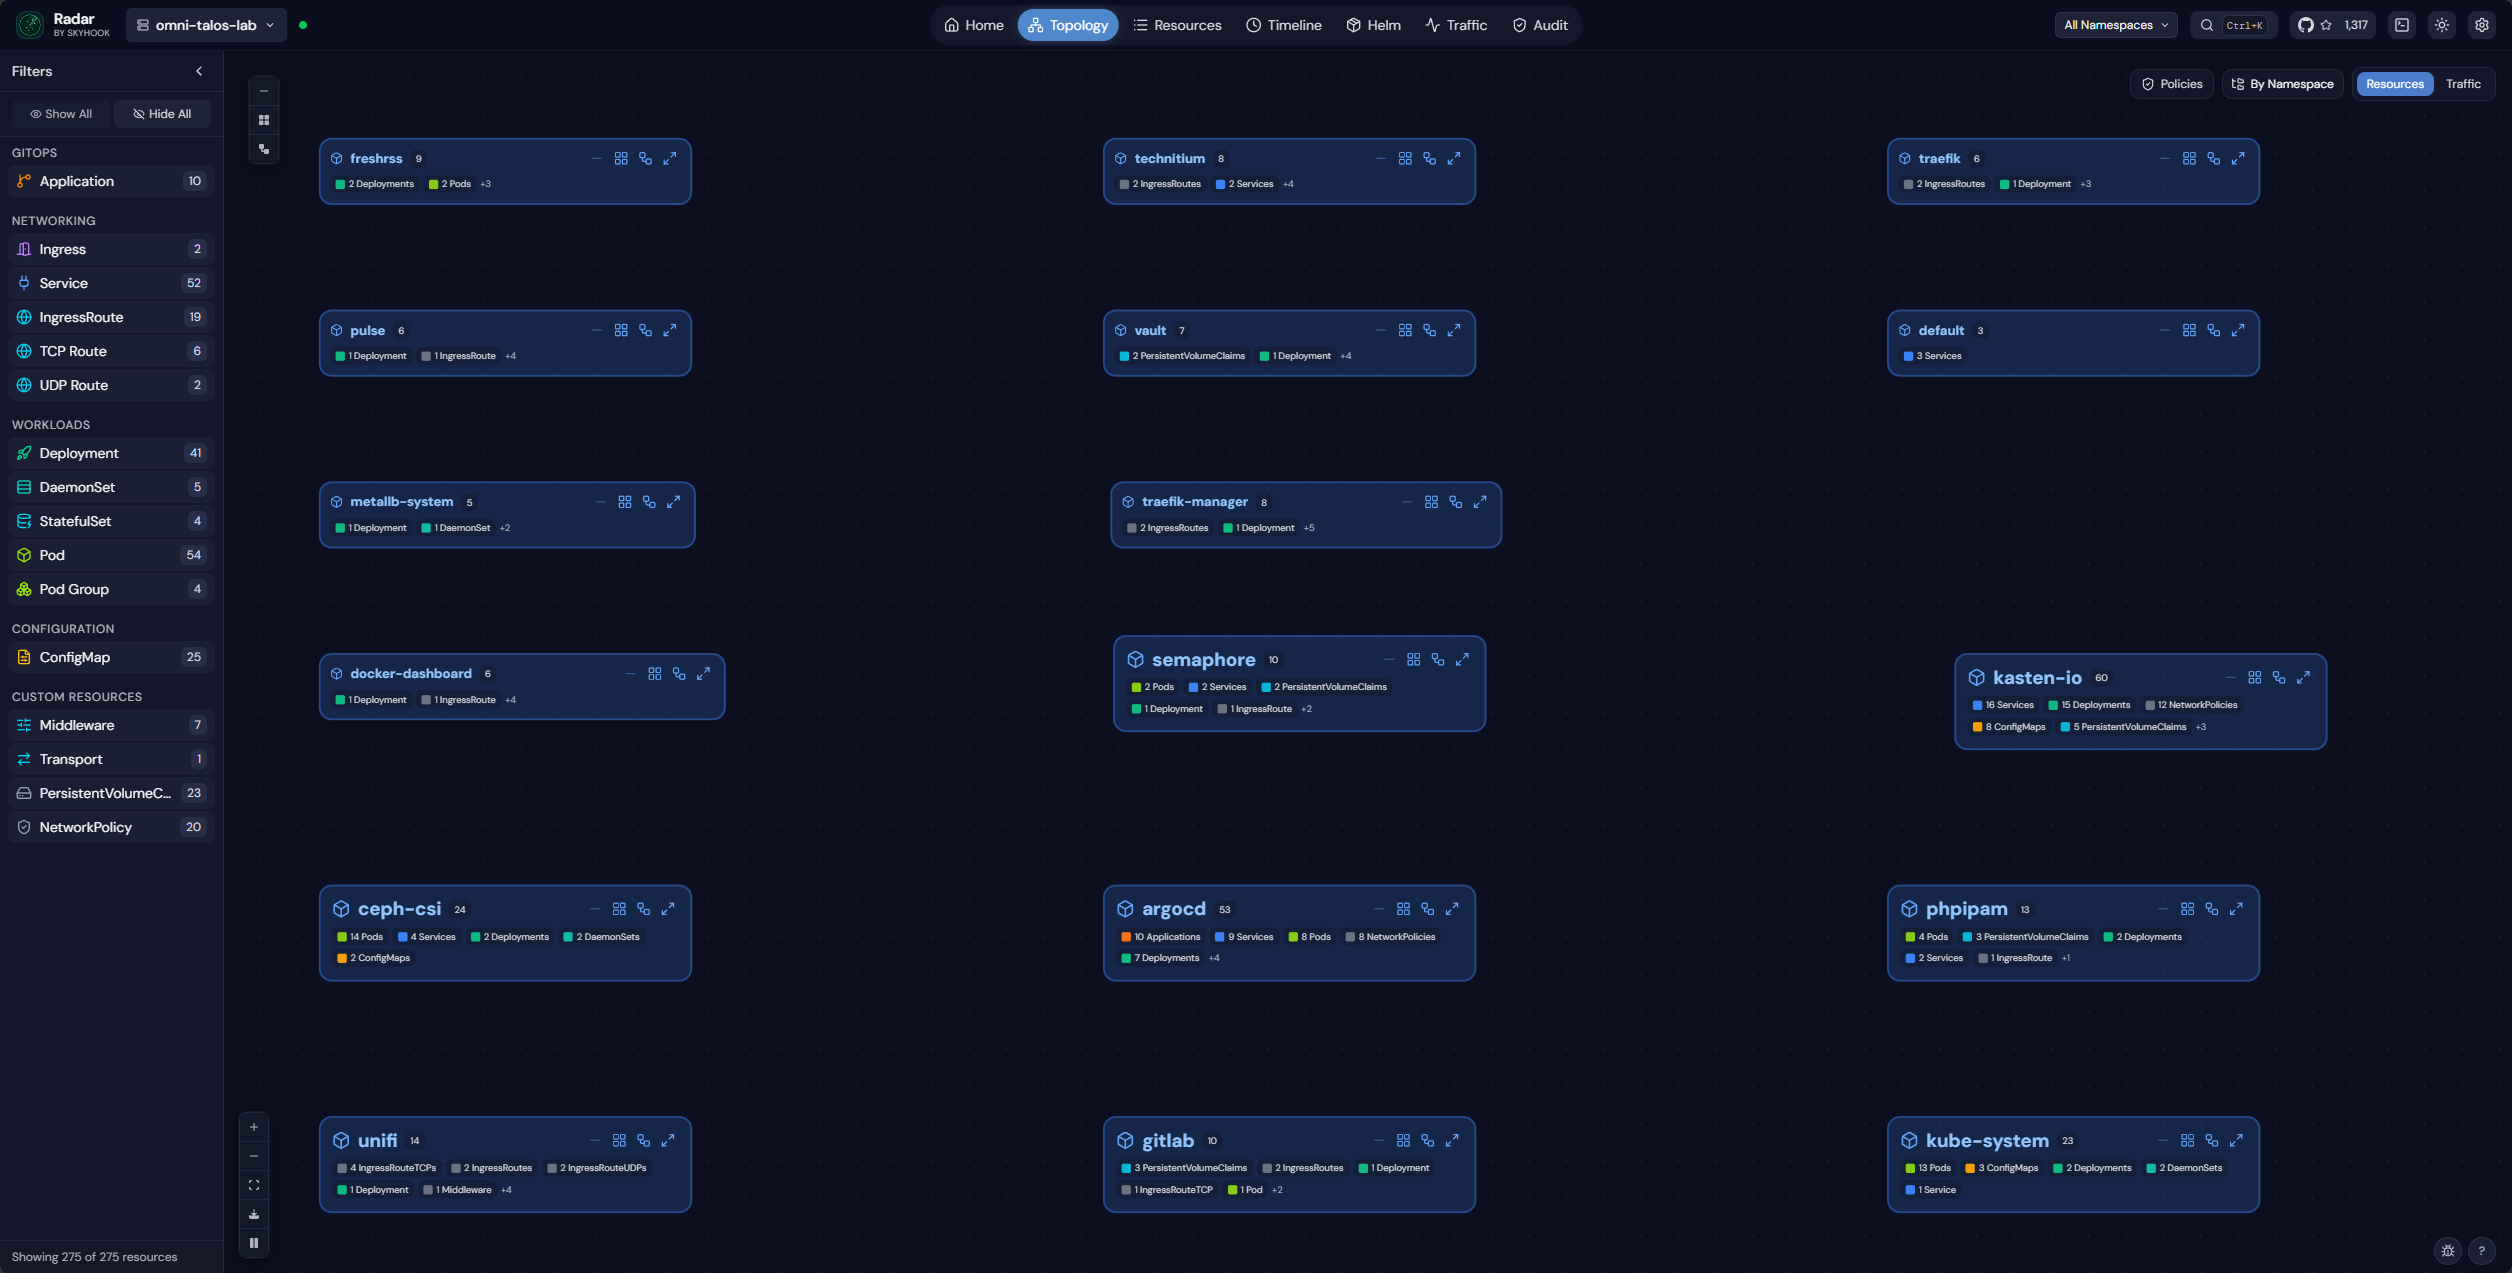
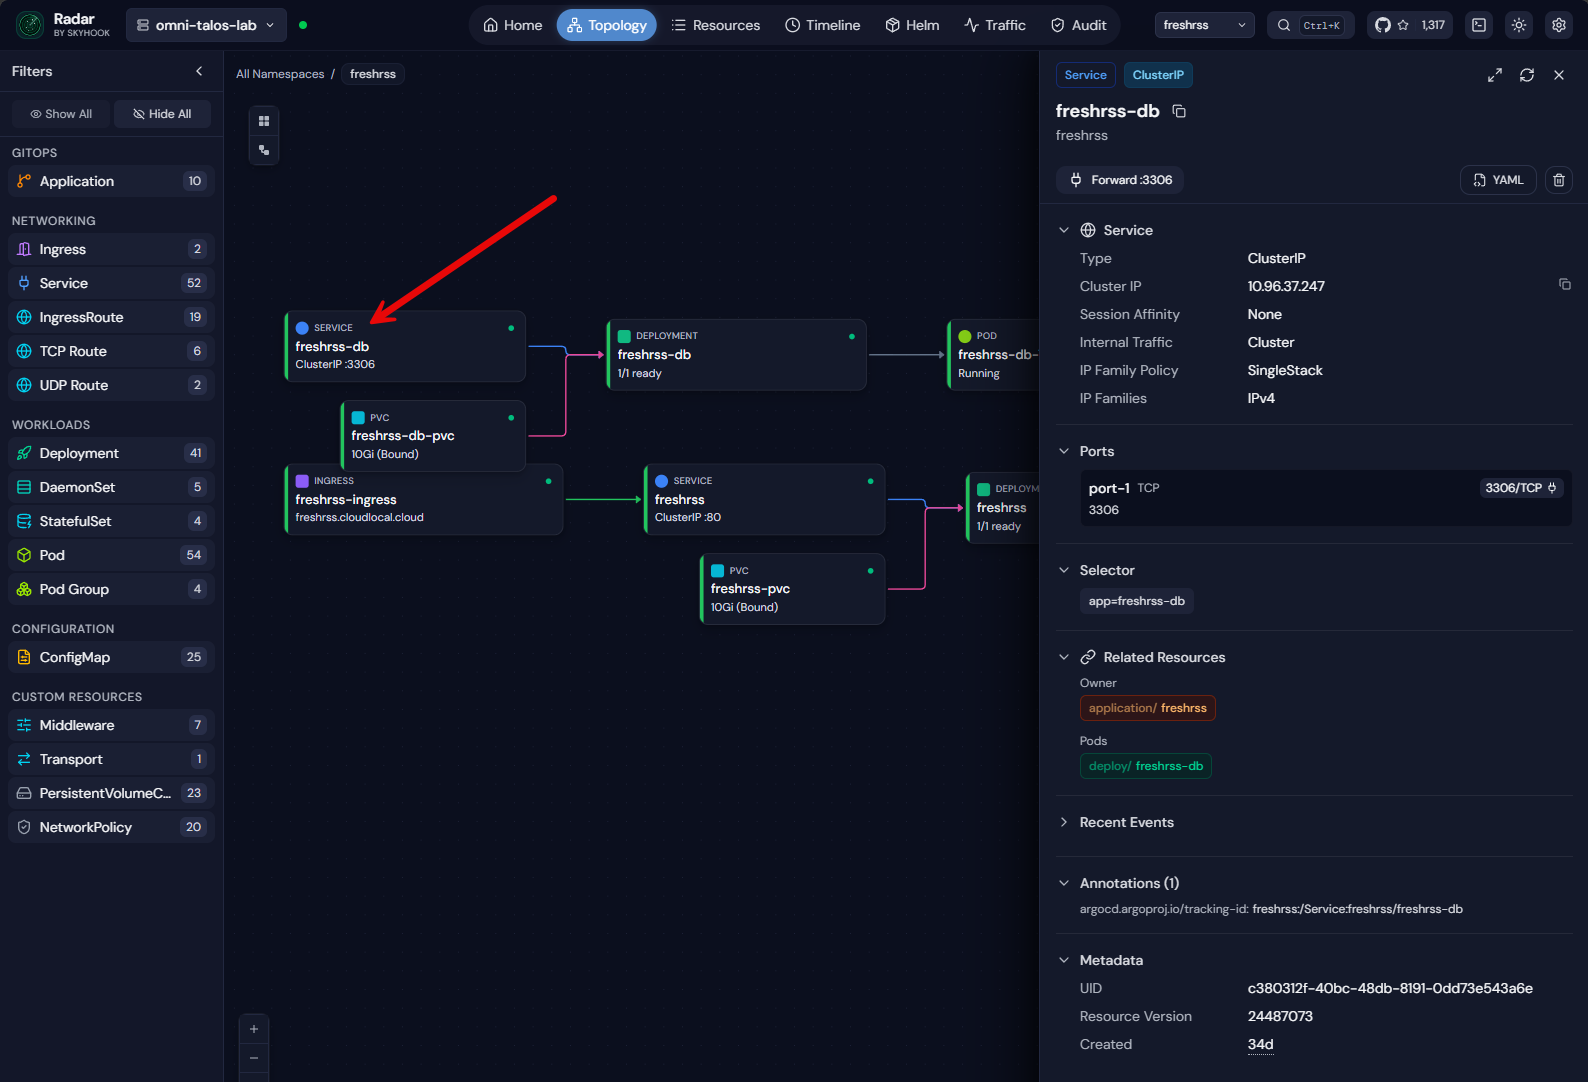
But, then, you can drill into a specific app. Here I have drilled into the FreshRSS app:
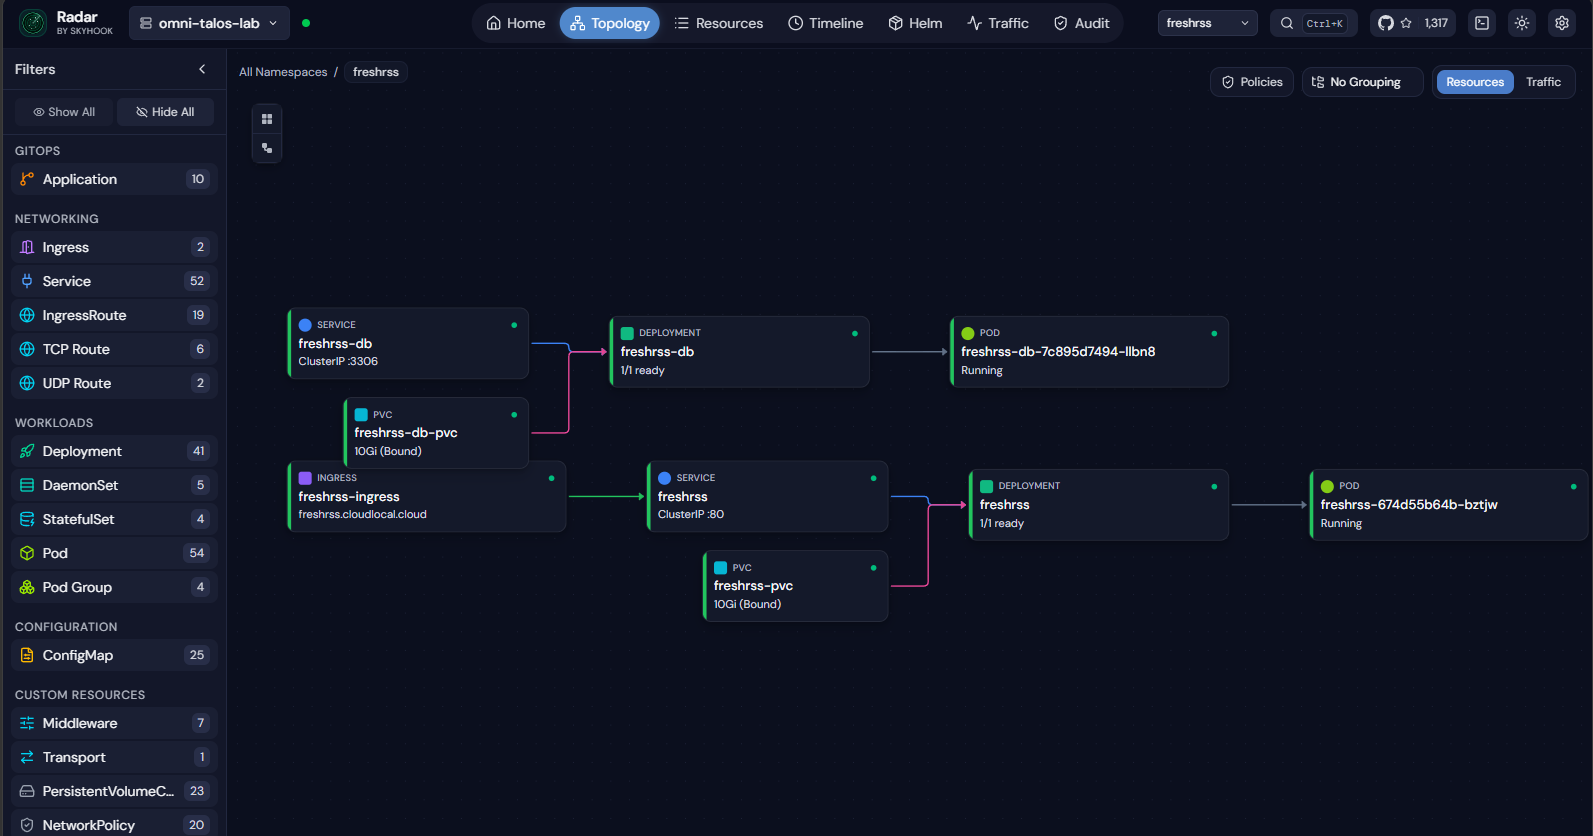
Here I have clicked on the freshrss-db service and you see the blade open from the right-hand side that shows the details of the service. You can see ports forwarded, selectors, related resources, recent events, annotations, metadata, etc.
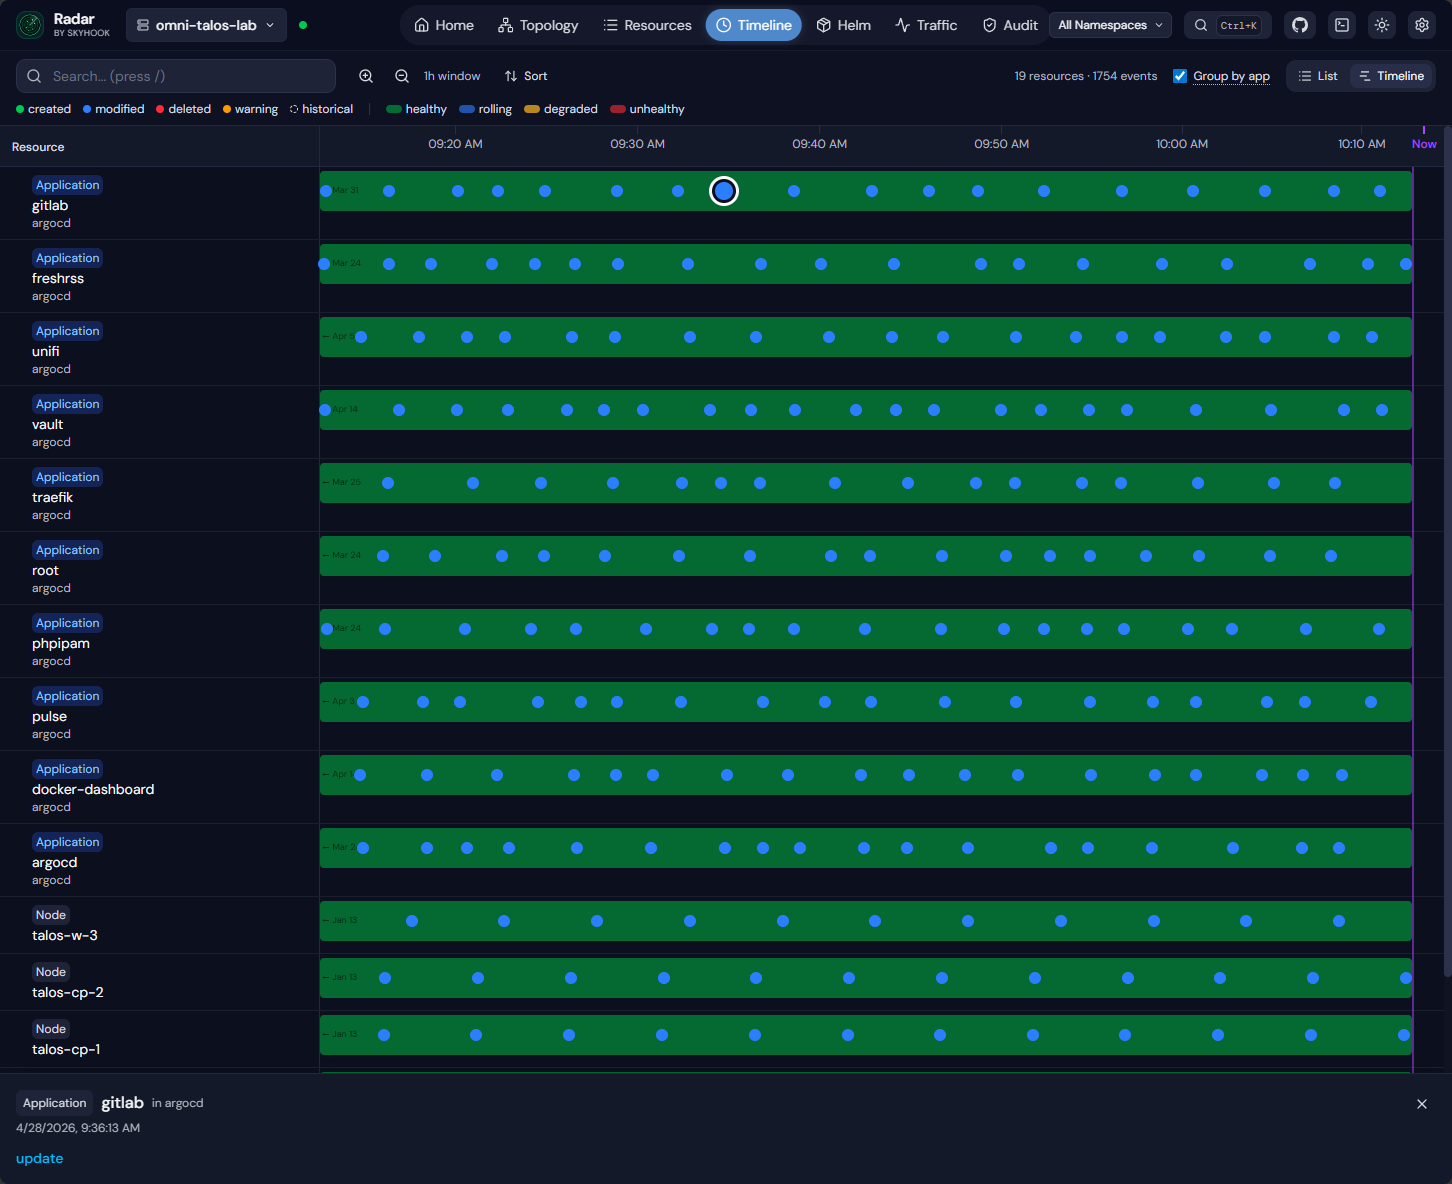
One of the really cool things this tool has is the Timeline. This is a great way to see root cause or put together when things happened and how they are connected. The bubbles are clickable events that you can drill into.
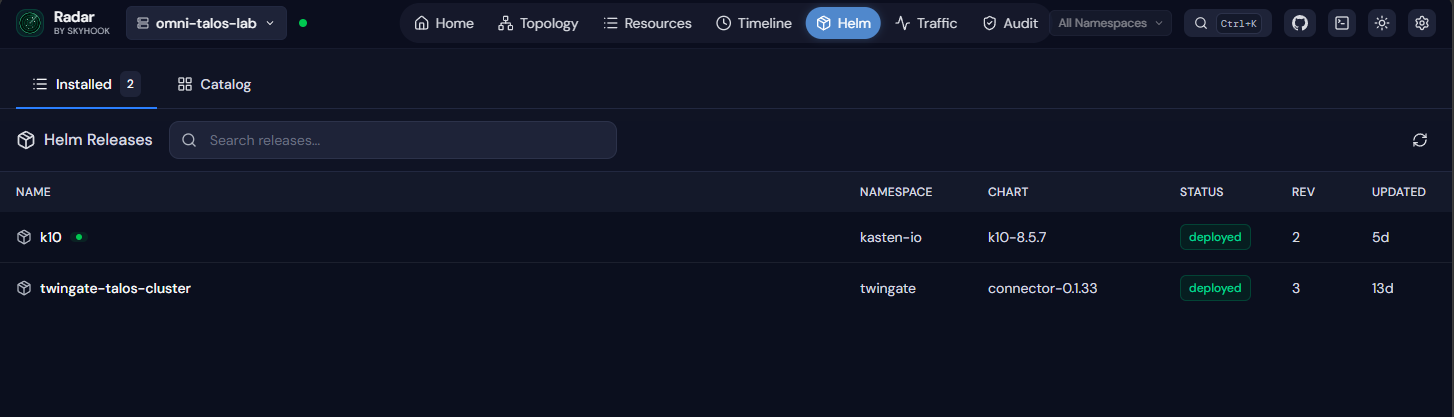
Another aspect of the tool is visibility on Helm resources.
Seeing network traffic in your Kubernetes cluster using Radar
It also has a slick way to see network traffic and have that visibility into the Kubernetes cluster. When you click on the network traffic menu, it will prompt you to install caretta for network visibility. Caretta is an eBPF-based network observability tool.
On the step 2 for Values, you can review the configuration values.
Then finally review the installation and summary. Click Install.
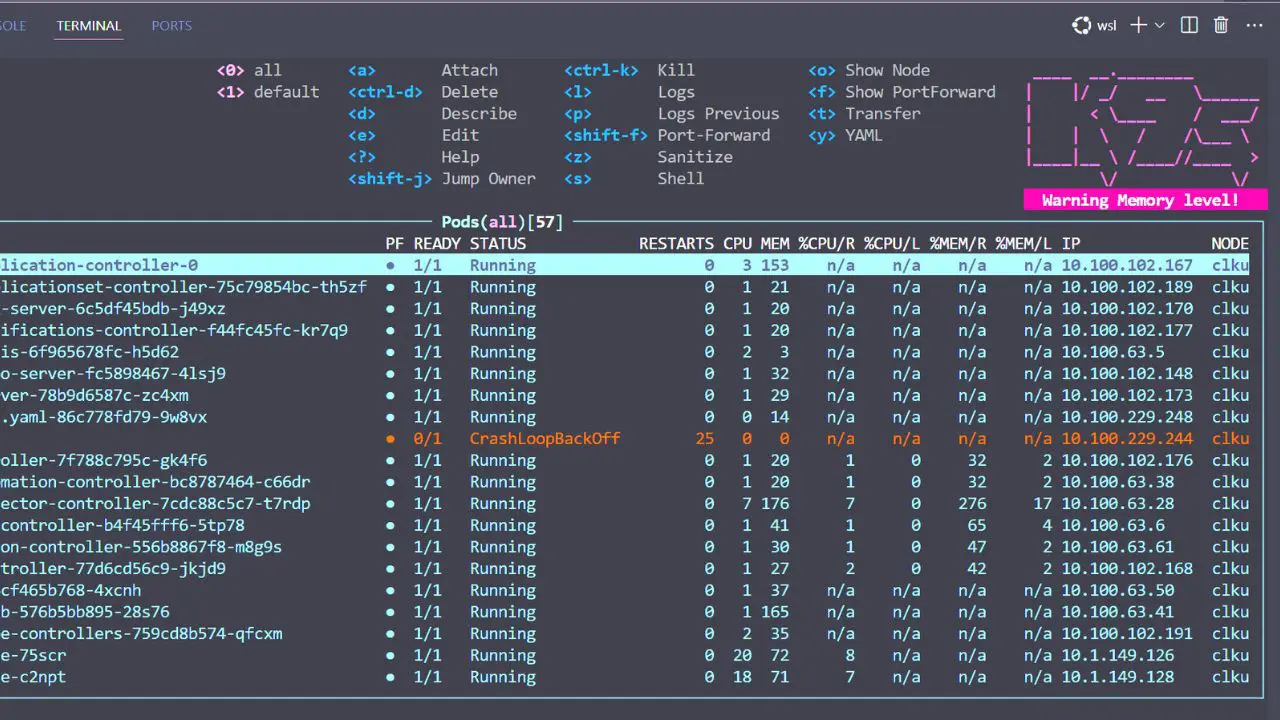
I am currently having an issue with the Caretta install that I believe is related to my Talos Linux environment where I believe the Talos kernel doesn’t have the inet_sock_set_state tracepoint compiled in or syscall tracepoints are disabled.
Caretta requires specific kernel tracepoints to function. The error I received with my pods as they went into CrashLoopBackup, shows it can load eBPF objects and attach kprobes, but fails when trying to attach to the syscall tracepoint that doesn’t exist or isn’t exposed in the kernel. Again, I need to do more research on this, but is probably related to the hardened Talos Linux kernel.
Where radar fits in a home lab
I think the Radar Kubernetes dashboard goes really well with any other tools that you might be using in your Kubernetes home lab. You might still rely on other tools for scripting or automation, or your monitoring stack for metrics and alerts. But I think for day to day visibility and interaction with your cluster, Radar can be your primary dashboard if you choose it to be with a lot of great features.
I love the timeline feature and visibility into the various components in your cluster. It helps surface issues without you having to dig through logs or running multiple commands to sift your way through.
Pros and cons
Note the following pros and cons for using Radar for Kubernetes visibility:
| Pros | Cons |
|---|---|
| Very easy to install and use | Still a relatively new project |
| No cluster side components required | Not a full replacement for monitoring and observability stacks |
| Fast and responsive interface | Some advanced features depend on specific networking tools |
| Strong visualization capabilities | Smaller ecosystem compared to more established solutions |
| Works with any kubeconfig | |
| Includes tools for Helm and Git |
Wrapping up
I think Radar is definitely an open source (now) solution that you should put on your list of solutions to try if you are testing and running Kubernetes in the home lab. It provides some really cool features and capabilities that I don’t see in other products like the “timeline” feature. I also like the fact it has an MCP server built in and they have designed it in a way that it is easy to hook into your favorite AI desktop application. Is this a solution you have heard about before? Curious if any readers have tried it out as of yet, and what your thoughts are on it. Please let us know in the comments.
Google is updating how articles are shown. Don’t miss our leading home lab and tech content, written by humans, by setting Virtualization Howto as a preferred source.
About The Author

Wow, amazing, I don’t know how this one “slipped in under the radar”. Very nice dashboard. Very simple installation and it has one thing I’ve wanted for a while to demonstrate in trainings – a graphical representation of resources … which doesn’t do those “force directed” graphs that many tools used.
Thanks Brandon for the (latest) heads up on a great tool.
Michael,
Thanks so much. I am finding Radar to be a great little tool as well between the graphical representation of resources as you mention as well as the timeline feature. Thanks again for the comment and glad you are enjoying the tool!
Brandon
Excelent tool, I want to know if I have my cluster on my Linux VM, Can I deploy radar on my windows laptop and connect that with my Linux VM to manage my Kubernete Cluster?
Diego,
Sure thing, it just reads your kubeconfig so if you have your kubeconfig pointed to the cluster locally it should be good to connect up without any issues. The tool is easy to deploy as well as you see in the post, works on Windows very well.
Brandon