Keeping visibility into your home lab over self-hosted services is a critical task. Let’s look at a new home lab dashboard called CoreControl that provides a free open-source dashboard that is a great solution in the home lab.
What is CoreControl?
First, what is CoreControl? It is a self-hosted system monitoring dashboard that gives you many different basic metrics. These include CPU use, RAM, GPU utilization (NVIDIA), and general system information like uptime and load averages. You can run it locally to provide instant monitoring with very little setup. It is built with the tools FastAPI and Socket.IO. This allows it to stream metrics directly into a modern web UI. This allows self-hosters to monitor their systems without deploying a full stack for monitoring.
View the official GitHub page here: crocofied/CoreControl: Dashboard to manage your entire server infrastructure.
What are some of the features of the solution?
Note the following:
- CPU usage: Monitor individual logical CPU core activity in real time
- NVIDIA GPU stats: View GPU usage, VRAM, and power draw using
nvidia-smi - RAM usage monitoring: memory in use vs available
- System metrics: Hostname, uptime, and load averages
- WebSocket-based UI: Real-time updates via Socket.IO
- Dark mode: dark-mode UI suitable for desktop or mobile
- Replaces multiple solutions: I think this could effectively assume the role of multiple applications in the home lab if you are already running Uptime Kuma, a dashboard, and other tools
Great for self-hosted dashboard
You may already be using something like Netdata or grafana and prometheus. But these can be overkill for what you want or need to do.
CoreControl is a great balanced solution for monitoring many different self-hosted hardware and software solutions, such as monitoring GPU statistics, media servers, Proxmox nodes, Docker hosts, and single board computer environments.
Monitoring LLM and AI workloads
If you’re running Ollama, llama.cpp, or Stable Diffusion, you can track GPU VRAM, load, and power draw during inference.
Media servers with hardware transcoding
When streaming content through Plex or Jellyfin, CoreControl can make sure that your GPU is actually being used for transcoding.
Proxmox home lab setups
Install CoreControl on each Proxmox node to get a live view of CPU and RAM usage.
Docker swarm or standalone hosts
Use CoreControl to monitor container hosts and see how many resources are being used without needing Netdata or Glances.
Raspberry Pi and mini PCs
Track performance metrics on low-power devices with a clean and fast dashboard interface.
Installing CoreControl
There are three primary installation options: Docker Compose (recommended), Docker CLI, and native Python. The official GitHub repository provides a working Docker Compose file that simplifies the process.
Docker Compose
CoreControl’s latest version uses a multi-service architecture with separate containers for the web UI, background agent, and a PostgreSQL database. Here’s the recommended docker-compose.yml configuration from the official repository:
services:
  web:
    image: haedlessdev/corecontrol:latest
    ports:
      - "3000:3000"
    environment:
      JWT_SECRET: RANDOM_SECRET # Replace with a secure random string
      DATABASE_URL: "postgresql://postgres:postgres@db:5432/postgres"

  agent:
    image: haedlessdev/corecontrol-agent:latest
    environment:
      DATABASE_URL: "postgresql://postgres:postgres@db:5432/postgres"
    depends_on:
      db:
        condition: service_healthy

  db:
    image: postgres:17
    restart: always
    environment:
      POSTGRES_USER: postgres
      POSTGRES_PASSWORD: postgres
      POSTGRES_DB: postgres
    volumes:
      - postgres_data:/var/lib/postgresql/data
    healthcheck:
      test: ["CMD-SHELL", "pg_isready -U postgres"]
      interval: 2s
      timeout: 2s
      retries: 10

volumes:
  postgres_data:
Save this file as docker-compose.yml, then bring the stack up:
docker compose up -d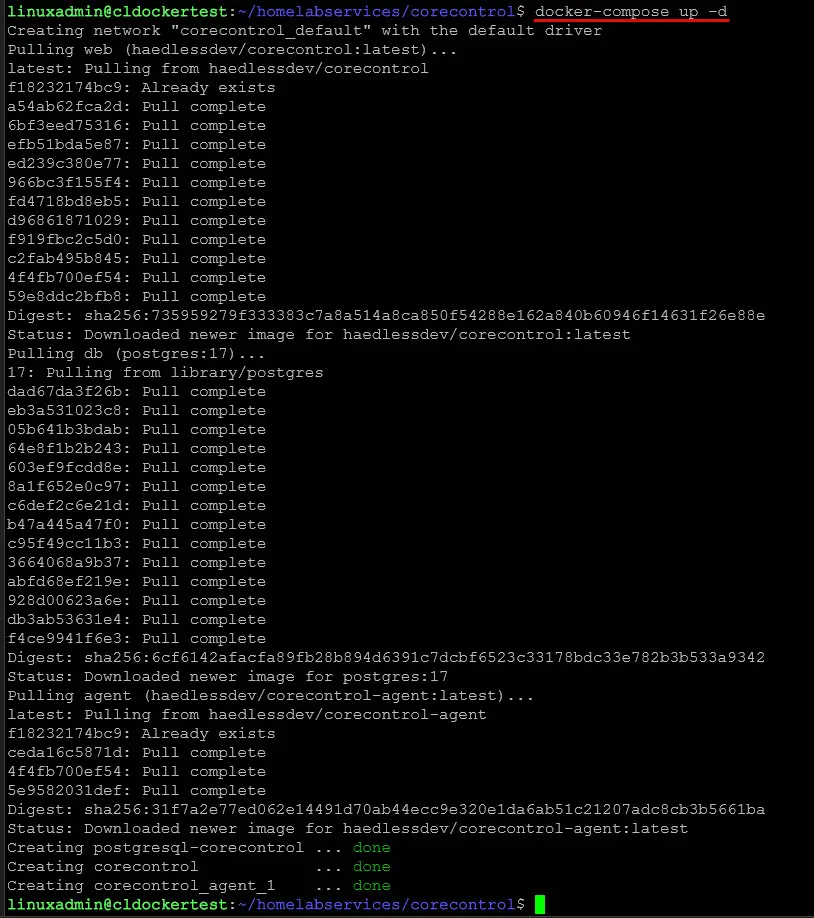
- Open your browser and go to:
http://localhost:3000
Replace localhost with your server’s IP for remote access.
Note: Docker Compose uses
--privilegedmode to access system and GPU metrics.
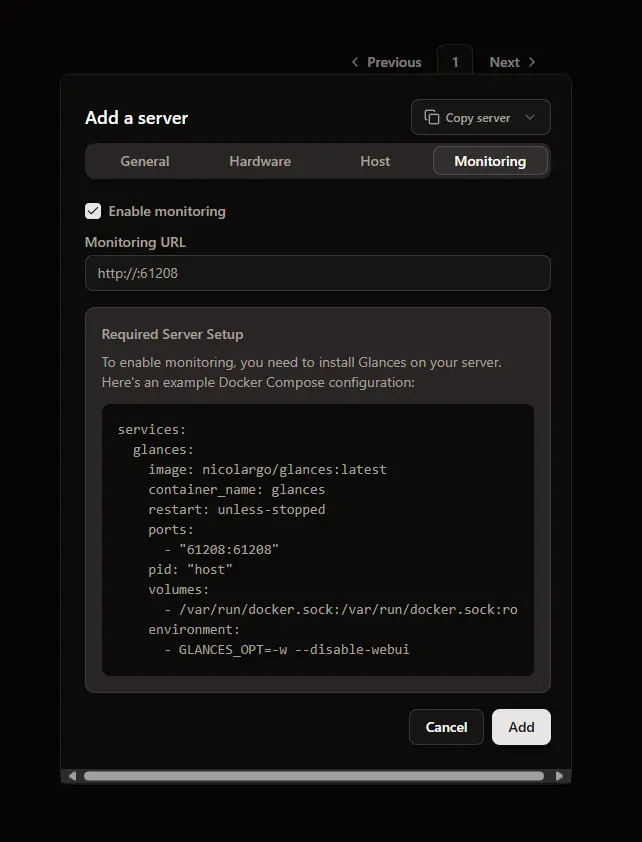
Enabling monitoring with Glances
You can use Glances for monitoring a remote server. When you add a server and go to the monitoring tab, you see the Docker Compose code listed that you need.
Running the docker-compose up -d command for pulling and running the container.

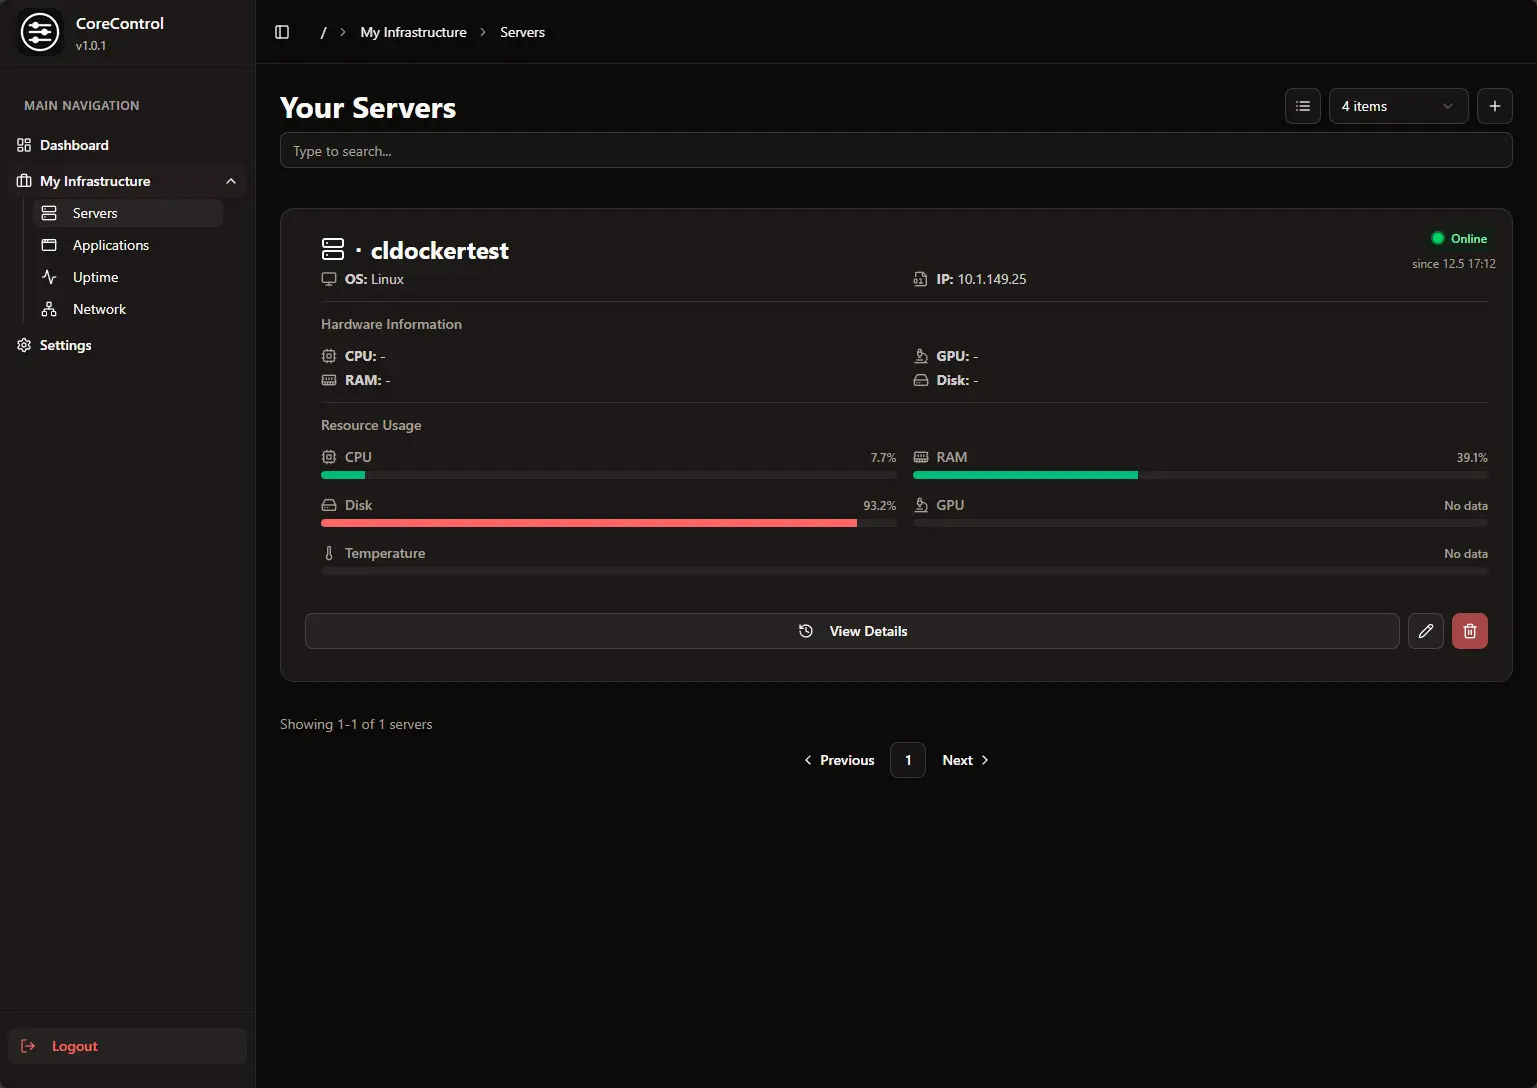
After adding monitoring of a remote server with Glances.
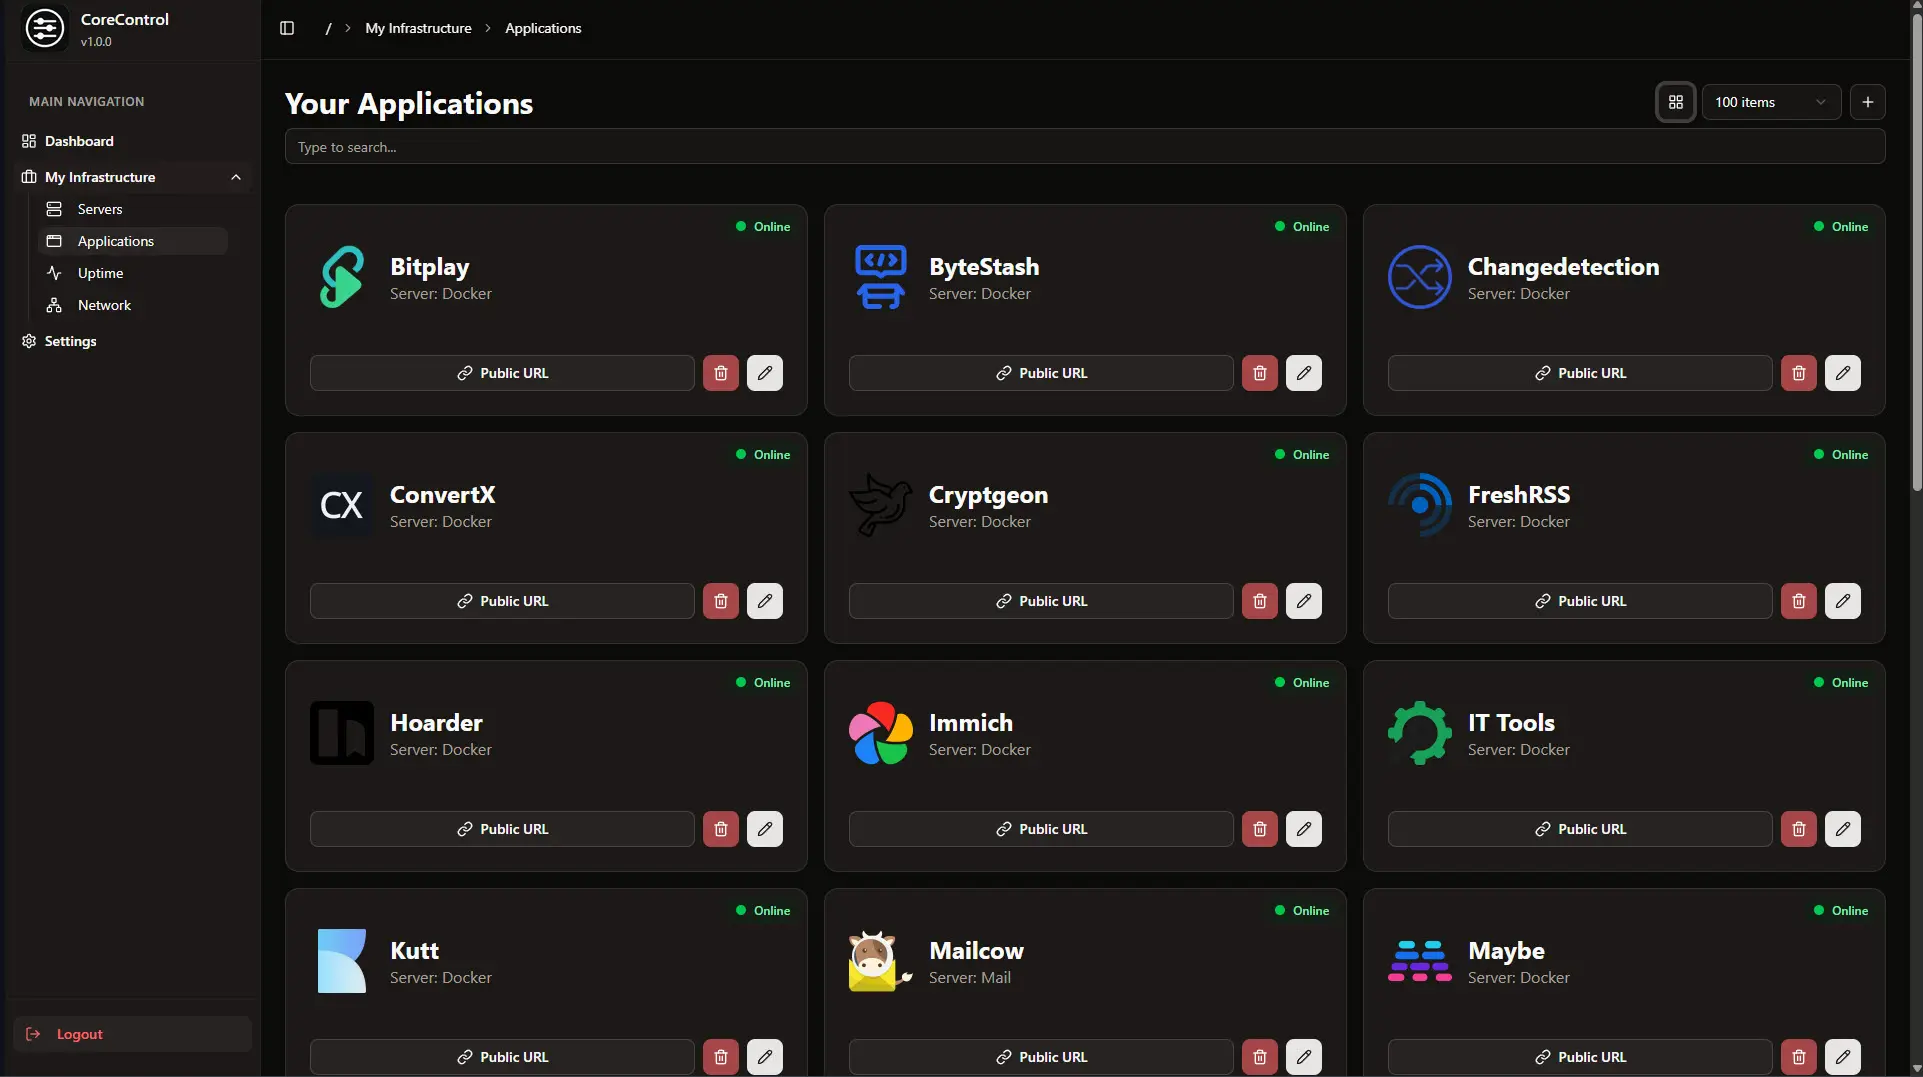
Monitoring applications and network
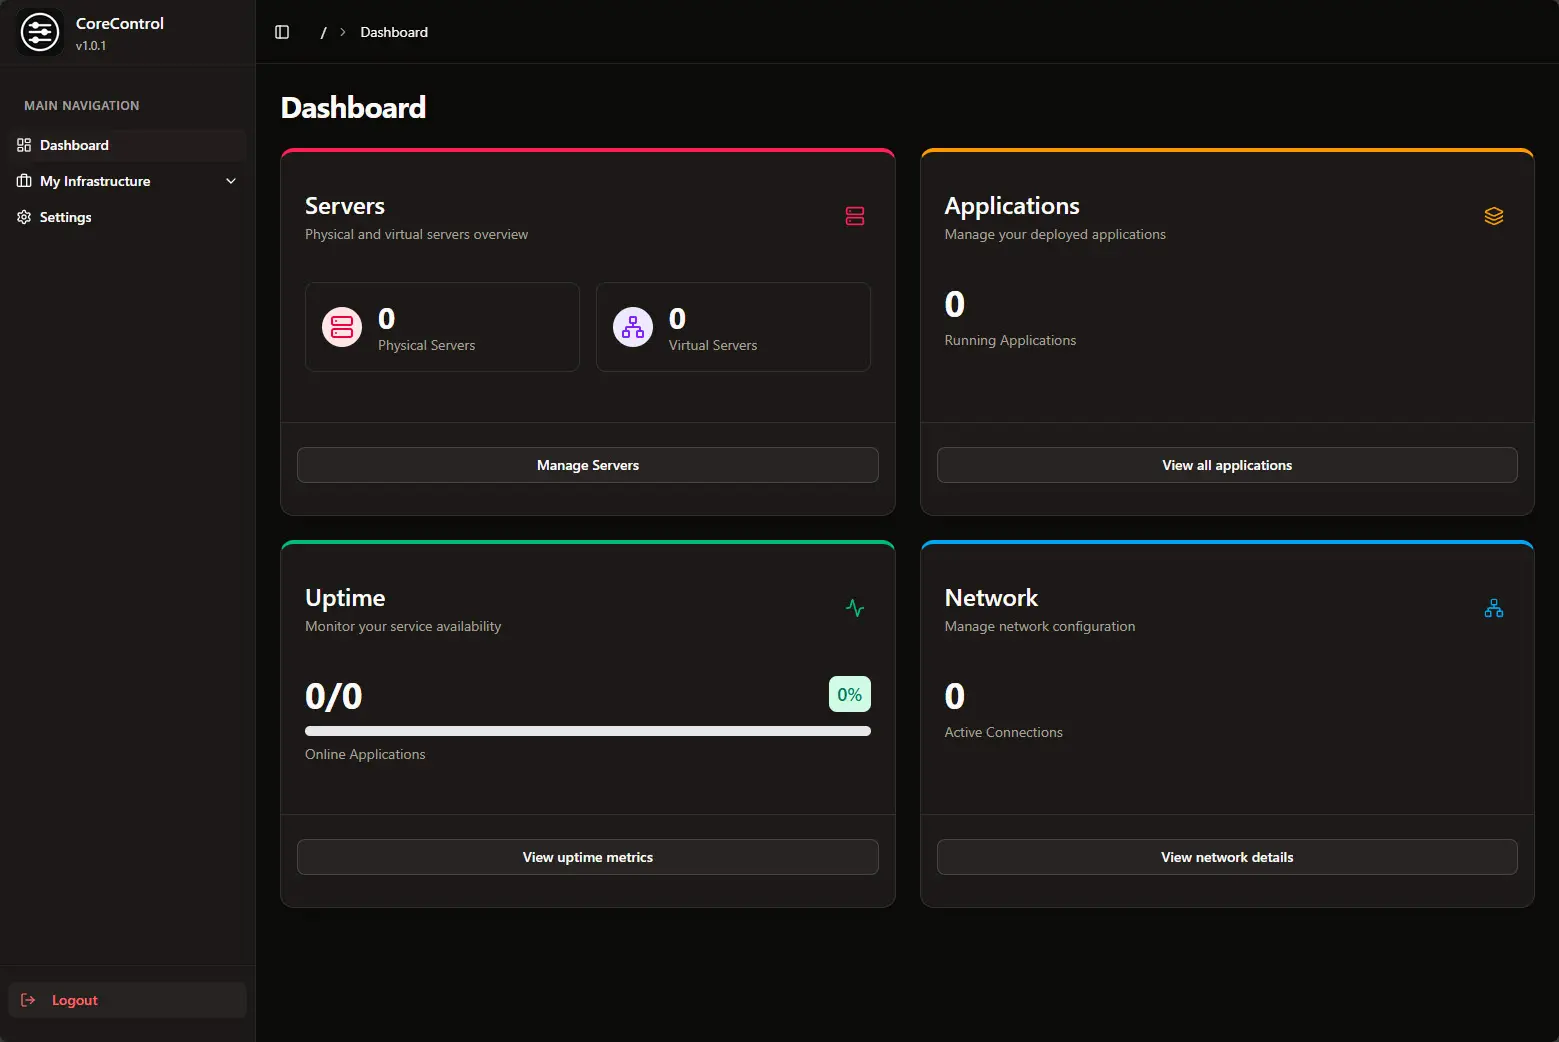
You can add your applications to the dashboard in CoreControl.

It maps your network connections.

GPU Monitoring
CoreControl supports NVIDIA GPUs out of the box via nvidia-smi. To enable GPU monitoring:
- Make sure NVIDIA drivers are installed
nvidia-smimust be accessible on the system path- If using Docker, the container must have access to the GPU (requires privileged mode or NVIDIA runtime)
This makes CoreControl helpful for LLM inference, media encoding, and GPU-intensive workloads.
CoreControl comparison with other tools
| Feature | CoreControl | Netdata | Prometheus + Grafana |
|---|---|---|---|
| Real-time updates | Yes | Yes | Config required |
| GPU support (NVIDIA) | Native | Advanced | Exporters needed |
| Setup complexity | Very Low | Medium | High |
| Multi-node aggregation | Manual | Yes | Yes |
| Long-term metric storage | No | Yes | Yes |
| Self-hosted | Yes | Yes | Yes |
Limits
- Linux only (tested on Debian/Ubuntu)
- NVIDIA-only GPU support
- No built-in alerting or historical data
- No built-in multi-node view (though you can run multiple instances behind a reverse proxy)
- Little documentation The Github page for the project is very weak on the documentation side. There are lots of screenshots but not much explanation of things.
Wrapping up
CoreControl is a great new solution that looks to have a lot of potential for the home lab and self-hosters. I like that it is simple and easy to stand up with Docker Compose code. It also assumes the role of several different self-hosted solutions that you may be running. It can help monitor GPU stats if you are delving into self-hosting your own LLMs and want to keep an eye on your GPU stats and resource usage.
Google is updating how articles are shown. Don’t miss our leading home lab and tech content, written by humans, by setting Virtualization Howto as a preferred source.
About The Author