This blog post looks at the best open-source monitoring tools in DevOps in 2024 for continuous monitoring tools, many of which you can run in Docker on-premises in prod or your home lab.
Prometheus
Prometheus is a monitoring and also it is an alerting tool that was released originally and built by a company called SoundCloud. It’s now part of the Cloud Native Computing Foundation. It is known for storing metrics and time series data which is what many use it for to keep track of, i.e., data points and key-value pairs.
Pros:
- High scalability and a powerful query language (PromQL) for data analysis.
- Active and large community providing a wealth of plugins and integrations.
- Provides a multidimensional data model and time series data identified by metric name and key/value pairs.
Cons:
- Complex setup and steep learning curve for new users.
- Long-term storage solutions require additional components.
- Relies heavily on community for support and documentation, which can vary in quality.
Learn more about Prometheus here: Download | Prometheus.
Grafana
Grafana is a great open source solution for helping you visualize data that is pulled from various sources. Many use it in conjunction with Prometheus and other solutions along with time series databases. Grafana provides dashboards which makes everything easier to see than reading numbers and dots. You can see your data in charts and graphs. There is even a large community of freely downloadable dashboard and data you can import and start using without reinventing the wheel.

Pros:
- Rich visualization options with customizable dashboards.
- Broad support for various data sources and mixed data sources within the same dashboard.
- Active community support and continuous addition of new features.
Cons:
- Can become resource-intensive with complex dashboards or large data volumes.
- Initial setup and data source configuration may be challenging for beginners.
- Dashboards and visualizations require manual setup, which can be time-consuming.
Learn more about Grafana here: Download Grafana | Grafana Labs.
Nagios Core
Nagios is a name that has been around for quite some time in the monitoring world space. It is open sorce and allows for monitoring many different environments and infrastructure both onprem and in cloud envs. These include servers, networks and other things like system health to name a few. You can also setup alerts.
Pros:
- Comprehensive Monitoring: Offers wide-ranging monitoring capabilities for systems, networks, and applications.
- Extensibility: A vast array of plugins available, developed by the community, allows for monitoring almost any service or application.
- Active Community: Benefit from extensive documentation and a supportive community for troubleshooting and enhancements.
Cons:
- Complex Configuration: The initial setup and configuration can be daunting for new users without substantial IT experience.
- UI Outdated: Some users may find the user interface less modern compared to newer tools on the market.
Learn more about Nagios here: Downloads | Nagios Open Source.
InfluxDB
InfluxDB is one that is well known in most circles, for development, devops, and other spaces. It widely is used in the community. It is known to be able to handle a lot of data really well. It is a tool that DevOps teams use that are focused on monitoring application performance, events, and metrics.

Pros:
- High Performance: Optimized for fast, high-availability storage and retrieval of time-series data in fields such as operations monitoring, application metrics, IoT sensor data, and real-time analytics.
- Easy to Use: Offers a straightforward querying language and integrates well with Grafana for visualization.
- Scalability: Scales horizontally to support millions of data points per second.
Cons:
- Complexity in Clustering: Setting up clustering for high availability can be complex and may require enterprise features.
- Storage Management: Managing large datasets over time requires careful planning to avoid performance degradation.
Learn more about InfluxDB here: InfluxDB Time Series Data Platform | InfluxData.
Telegraf
Telegraf is a type of tool that is open source and collects metrics, which is what it is known for, but can do other kinds of data from many different sources. It can then can write these into InfluxDB or other types of storage targets and solutions. It’s part of the TICK stack (Telegraf, InfluxDB, Chronograf, and Kapacitor).
Pros:
- Versatile Data Collection: Supports a vast array of input plugins for collecting metrics, events, and logs from systems, databases, applications, and services.
- Minimal Resource Usage: Efficiently uses system resources, ensuring minimal impact on host performance.
- Extensible Plugin System: Users can extend Telegraf’s capabilities with custom plugins, allowing for flexible and tailored data collection strategies.
Cons:
- Complex Configuration for New Users: While versatile, setting up and configuring Telegraf with specific plugins and outputs can be daunting for beginners.
- Dependence on Other Tools for Visualization: Requires integration with tools like Grafana for data visualization, as it does not provide built-in UI for monitoring data.
Learn more about Telegraf here: Telegraf | InfluxData.
Graylog
Graylog is one that I have spun up before and really like to use. It is simple and easy to get a feel for as an open-source log management tool. You can use it to capture, store, and analyze things across an environment for troubleshooting, etc. It can parse through large amounts of data that is collected and gives you data that is meaningful and stores the data to review later if needed.

Pros:
- Powerful Search Engine: Allows for fast and efficient querying of log data, facilitating rapid issue diagnosis and analysis.
- Comprehensive Alerting Mechanism: Enables real-time alerting based on log data patterns, helping identify issues as they occur.
- Scalable Architecture: Designed to handle large volumes of data, making it suitable for both small and large-scale deployments.
Cons:
- Initial Setup Complexity: Setting up Graylog and configuring it to collect logs from various sources can be complex and time-consuming.
- Resource Intensiveness: Can be resource-heavy, especially in larger deployments, requiring significant storage and computing power.
Learn more about Graylog here: Graylog: Industry Leading Log Management & SIEM.
Icinga
Icinga is an open-source monitoring system that checks the availability of network resources. It can notify users of outages and errors, and generates performance data for reporting. Icinga can monitor large, complex environments across many locations. It has a modular design that allows adding on features and integrating with many other DevOps tools. It is a good choice for infrastructure monitoring that can detect downtime and anomalies.

Pros:
- Flexible Configuration: Offers a DSL (Domain Specific Language) for defining complex monitoring conditions and configurations.
- Web-Based Interface: Provides a comprehensive web UI for monitoring status, managing configurations, and viewing reports and dashboards.
- Integration Capabilities: Supports integration with numerous third-party applications for enhanced monitoring and alerting workflows.
Cons:
- Learning Curve: The flexibility and power of Icinga come with a complexity that can be challenging for new users to master.
- Manual Intervention Required: Some configuration and maintenance tasks may require manual intervention, especially in custom setups.
Learn more about Icinga here: Icinga » Monitor your entire Infrastructure with Icinga.
Collectd
Collectd is a daemon that collects system and application performance metrics at set intervals. You can store the values in a variety of ways. You can gather metrics from many different sources and also gives performance analysis to help predict system load. Collectd can monitor almost every aspect of system performance.

Pros:
- Lightweight and Efficient: Designed to run with minimal system impact, ensuring performance metrics are collected without significantly affecting system resources.
- Extensive Plugin Support: Features a wide range of plugins for collecting data from various services and applications.
- Versatile Data Storage: Snagupports multiple formats and targets for storing metrics, from local files to databases and integration with visualization tools.
Cons:
- Complex Configuration: The breadth of plugins and options can lead to complex configuration files that may be daunting for newcomers.
- Limited Visualization: Primarily a collection tool; relies on external solutions for data visualization and analysis.
Learn more about Collectd here: collectd | The system statistics collection daemon.
Sensu
Sensu is a monitoring solution designed to handle monitoring tasks across services, applications, and infrastructure. It provides a framework for monitoring checks, event processing, and alerting. It is an ideal choice for dynamic and scalable environments. Sensu offers a modern and flexible monitoring approach that supports containerized, hybrid, and cloud environments.

Pros:
- Scalability: Easily scales to monitor thousands of nodes across different environments.
- Extensible: Offers numerous integrations with other tools and services, enhancing its monitoring capabilities.
- Event Pipeline: Features a powerful event pipeline for handling alerts, enabling complex workflows for incident resolution.
Cons:
- Learning Curve: The flexibility and power of Sensu come with a learning curve, particularly in understanding how to best utilize its event pipeline and integrations.
- Setup and Configuration: Initial setup can be involved, requiring a good understanding of the underlying architecture.
Learn more about Sensu here: Sensu | Sensu Go Downloads.
Netdata
Netdata is a tool that I have written about fairly recently but provides things like real-time health monitoring and can troubleshoot performance of different things, including simple to intricate types of systems and applications. It gives insights with web dashboards and metrics updated every second. Netdata is known for its cloud-centric configuration and is fairly plug-and-play.

Pros:
- Instant Visualization: Provides real-time, detailed metrics with instant visualization without the need for configuration.
- Comprehensive Coverage: Monitors a wide range of system metrics, application performance, and network traffic.
- Low Overhead: Designed to run with minimal system resources, ensuring monitoring doesn’t impact performance.
Cons:
- Data Retention: By default, stores detailed metric data in memory, which can limit historical data analysis over longer periods.
- Complexity in Large Environments: While excellent for individual servers, managing Netdata across a large infrastructure can become complex.
Learn more about Netdata here: Netdata: Monitoring and troubleshooting transformed.
LibreNMS
LibreNMS is network monitoring with other features like auto discovery. It can help with visibility on the environment by doing things like automatically identifying network devices. TIt can help to expand monitoring of the network and keeping an eye on key metrics.

Pros:
- Auto-Discovery: Simplifies network monitoring setup by automatically detecting devices and services.
- User-Friendly Web Interface: Offers an intuitive web interface for managing network monitoring, alerts, and configurations.
- Extensive Device Support: Compatible with a wide array of network devices and standards, ensuring broad applicability.
Cons:
- Dependency on SNMP: Heavily relies on SNMP for data collection, which may limit monitoring capabilities for devices with poor SNMP support.
- Interface Clutter: The amount of information available in the UI can be overwhelming, especially in large deployments.
Learn more about LibreNMS here: LibreNMS.
OpenNMS
OpenNMS is a good network monitoring solution that does a good job on many nodes and scales well. It can monitor several types of nodes and hosts and provide details into network performance and issues.

Pros:
- Scalability and Flexibility: Designed to scale and adapt to large and complex network environments.
- Comprehensive Monitoring: Offers detailed monitoring of services, network flow data, and performance metrics.
- Advanced Fault Management: Includes sophisticated tools for fault detection and notifications, enhancing operational awareness.
Cons:
- Complex Configuration: Tailoring OpenNMS to specific needs can require significant effort and expertise in network management.
- Resource Intensity: As a comprehensive solution, it can be resource-intensive, necessary for monitoring highly dynamic networks.
Learn more about OpenNMS here: OpenNMS – Open Source Network Monitoring Platform.
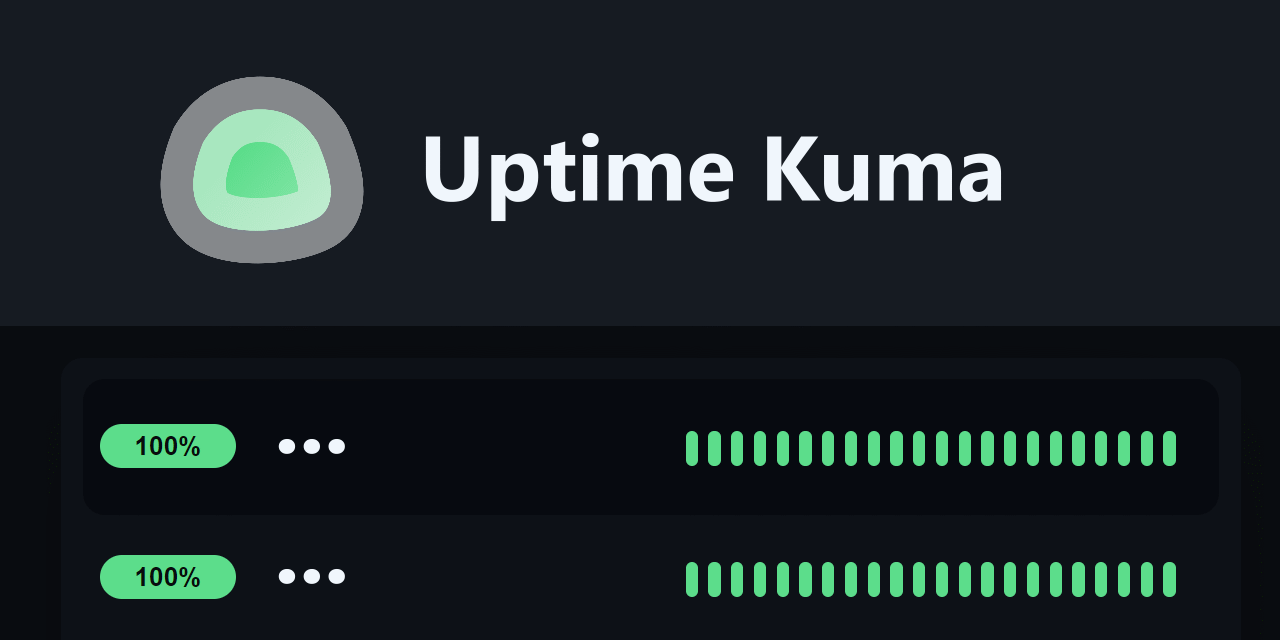
Uptime Kuma
Uptime Kuma is a great solution that I have used for quite some time now. It provides a really easy and helpful solution that is self-hosted and you can run both in your home lab or in production environments. It gives that “up time” information in an easy to read way and can monitor things like web services and Docker containers.
Pros:
- User-Friendly Interface: Offers a clean, intuitive interface for monitoring services and viewing historical uptime data.
- Comprehensive Alerting: Supports multiple notification methods, including email, webhooks, and integrated messaging platforms, ensuring timely alerts.
- Self-Hosted Privacy: As a self-hosted solution, it provides full control over data and monitoring, enhancing privacy and security.
Cons:
- Self-Management: Requires setup and ongoing management by the user, including server maintenance and updates.
- Limited Scalability: While suitable for small to medium-sized environments, it may face challenges scaling to monitor large infrastructures with hundreds of services.
Learn more about Uptime Kuma here: GitHub – louislam/uptime-kuma: A fancy self-hosted monitoring tool.
VictoriaMetrics
This is one that you may not have heard about but is a scalable time-series DB. It is used like InfluxDB for storing large volumes of metrics.

Pros:
- High Performance & Scalability: Handles millions of metrics per second, supporting high ingestion rates and queries with minimal CPU and memory usage.
- Compatibility: Offers Prometheus-like query language and is compatible with Prometheus’ ecosystem, facilitating easy migration or integration.
- Efficient Storage: Uses compression techniques to reduce disk space usage for stored time-series data.
Cons:
- Limited Built-in Visualization: Primarily a database, it requires integration with external tools like Grafana for data visualization.
- Community and Ecosystem: While growing, its community and ecosystem are not as large as some other established projects.
Learn more about Victoria Metrics here: GitHub – VictoriaMetrics/VictoriaMetrics: VictoriaMetrics: fast, cost-effective monitoring solution and time series database.
Thanos
Thanos is related to Prometheus. It is designed scale your monitoring system. It can centralize Prometheus instances without adding to any complexity to the environment. It has a global query view with unlimited retention of metrics.

Pros:
- Global View: Aggregates data from multiple Prometheus servers, providing a unified view across all metrics.
- Long-term Storage: Integrates with cloud storage solutions to provide cost-effective, long-term storage of metrics.
- High Availability: Offers a robust setup with high availability, ensuring metrics are accessible even if a Prometheus instance is down.
Cons:
- Complexity: Setting up and configuring Thanos for optimal use can be more complex than using Prometheus alone.
- Operational Overhead: Requires management of additional components, which may introduce operational complexity.
Learn more about Thanos here: Thanos – Highly available Prometheus setup with long term storage capabilities.
Loki
Loki is a fun one that I have played around with in the home lab environment. You can use this one to aggregate logs from just about anything. You can use it to store and query log information about applications and infrastructure and you can switch between metrics and logs.

Pros:
- Efficient Storage: Designed to minimize storage and operational costs, making log aggregation more accessible.
- Seamless Integration: Works well with Grafana, allowing for efficient querying and visualization of logs alongside metrics.
- Simple and Scalable: Offers a simple operational model, easily scaling out as needed without complex configuration.
Cons:
- Query Language Learning Curve: While inspired by Prometheus, Loki’s query language can take time to learn for new users.
- Focused on Logs: Primarily focused on logs, not a general-purpose data store, which might require additional tools for comprehensive monitoring solutions.
Learn more about Grafana Loki here: Installation | Grafana Loki documentation.
Jaeger
Jaege is a tracing system that is built on the idea of Dapper and OpenZipkin. It can monitor and troubleshoot transactions in complex distributed systems.

Pros:
- End-to-End Tracing: Offers detailed tracing of requests across distributed services, essential for microservices architecture.
- Rich Visualization: Includes a web-based UI for tracing transactions, understanding service dependencies, and performance bottlenecks.
- Integration and Extensibility: Supports integration with various storage backends, including Elasticsearch and Cassandra, and can be extended for additional use cases.
Cons:
- Complexity in Large Systems: While powerful, deploying and managing Jaeger in very large systems can be challenging.
- Overhead: Instrumenting applications to send traces to Jaeger can introduce additional overhead, especially if not carefully managed.
Learn more about Jaegar tracing here: Jaeger: open source, distributed tracing platform (jaegertracing.io).
Cadvisor
Cadvisor (Container Advisor) is an open-source tool developed by Google. It provides analyzing data and monitoring for running containers. It automatically collects, brings together, and processes, and exports information about running containers.

Pros:
- Container-Specific Metrics: Designed specifically for container monitoring, providing detailed metrics on CPU, memory, filesystem, and network usage.
- Easy Integration: Works seamlessly with container orchestration tools like Kubernetes, enhancing its monitoring capabilities.
- Lightweight and Simple: Easy to deploy as a container itself, offering a straightforward way to start monitoring container performance immediately.
Cons:
- Limited Historical Data: Primarily focused on real-time metrics, it may not retain detailed historical data
Learn more about cAdvisor here: GitHub – google/cadvisor: Analyzes resource usage and performance characteristics of running containers.
Zipkin
Zipkin is an open-source distributed tracing system that helps gather timing data. It can collect and lookup this data through using the UI and helps developers with tracking a request’s path through services and identify where delays are happening.

Pros:
- Deep Visibility: Provides detailed insights into the behavior and performance of distributed systems, helping to pinpoint latency issues.
- Community and Integrations: Has a wide range of community-driven integrations, making it compatible with various programming languages and frameworks.
- Scalable Architecture: Designed to handle high volumes of trace data, Zipkin can scale with your infrastructure as it grows.
Cons:
- Complexity for New Users: Understanding distributed tracing and effectively using Zipkin can be challenging for newcomers.
- Data Volume Management: Storing and managing trace data can become challenging, requiring efficient retention policies and scaling strategies.
Learn more about Zipkin here: OpenZipkin · A distributed tracing system.
OpenTelemetry
OpenTelemetry is an observability framework for cloud-native software. It provides a single set of APIs, libraries, agents, and instrumentation to capture distributed traces and metrics from your application. This helps with performance and observability analysis decisions and actions.
Pros:
- Unified Instrumentation: Offers a standardized way to collect telemetry data across services, reducing the need for multiple monitoring tools.
- Wide Language Support: Provides implementations for the most common programming languages, ensuring broad application compatibility.
- Flexible Export Options: Supports exporting data to numerous observability platforms, allowing teams to use their preferred tools for analysis and monitoring.
Cons:
- Evolving Project: As a relatively new and rapidly evolving project, some features and documentation may be in flux, potentially leading to integration challenges.
- Initial Setup and Configuration: Integrating OpenTelemetry into existing systems and configuring it for optimal data collection can require significant effort.
Learn more about OpenTelemetry here: OpenTelemetry.
Zabbix
Zabbix is a well-known tool in the network and application monitoring space that is free and open-source solution. It can be used for monitoring the performance and availability of servers, network devices, and applications.

Pros:
- Versatility and Extensibility: Can monitor virtually anything within a network, including servers, network devices, and applications, using a variety of methods, from SNMP and IPMI to custom scripts.
- Advanced Alerting System: Features a highly configurable alerting function that can notify administrators of potential issues via various channels, including email, SMS, or custom scripts, ensuring rapid response to incidents.
- Rich Visualization Options: Offers a wide array of data visualization options, including graphs, charts, maps, and screens, making it easier to understand the state of the monitored environment at a glance.
- Scalability: Designed to scale from small environments to large, distributed networks with thousands of devices.
Cons:
- Complex Configuration: The extensive feature set and flexibility come with a steep learning curve. Configuring Zabbix for specific monitoring needs can be complex, especially for beginners.
- Resource Intensity for Large Deployments: In very large and complex environments, Zabbix can have resource-intensive requirements, requiring significant database and server resources to maintain performance.
- UI Can Be Overwhelming: Some users may find the user interface to be cluttered or not as intuitive as other modern monitoring solutions, especially when managing a large number of monitors and alerts.
Learn more about Zabbix here: Download and install Zabbix.
New Relic
New Relic isn’t actually an open-source solution, but makes the list since it has a very generous free tier New Relic enables developers to track and troubleshoot performance of systems. It can provide deep insights into how software and systems are performing across multiple types of infrastructure.
Pros:
- Comprehensive Observability: Provides a unified view across the full technology stack, from the application layer down to the infrastructure.
- Real-time Analytics: Features powerful analytics capabilities, allowing teams to quickly identify issues and understand customer experiences.
- Scalability and Flexibility: Scales to meet the needs of both small startups and large enterprises, with flexible pricing models to match.
Cons:
- Complexity and Learning Curve: The breadth of features can be overwhelming, requiring time to learn how to use the platform effectively.
- Cost: While powerful, New Relic can become costly as usage increases, especially for larger organizations or more extensive monitoring needs.
Learn more about New Relic here: New Relic | Monitor, Debug and Improve Your Entire Stack.
ELK Stack
The ELK Stack combines three open-source products: Elasticsearch, Logstash, and Kibana. Logstash is a server‑side data processing pipeline that ingests data from multiple sources simultaneously and transforms it. It then sends it to a “stash” like Elasticsearch. Kibana lets users visualize data with charts and graphs in Elasticsearch.

Pros:
- Powerful Data Processing: Logstash can process a wide array of data formats from various sources, making it versatile for log analysis and more.
- Advanced Search Capabilities: Elastic stack search offers fast, scalable search, allowing you to quickly find the information you need within large volumes of data.
- Rich Data Visualization: Kibana provides comprehensive visualization tools, making it easier to analyze and gain insights from your data.
Cons:
- Resource Intensive: Can require significant resources, especially as data volume grows, impacting Elasticsearch performance.
- Complexity in Setup and Management: Setting up and optimizing the ELK stack can be complex, requiring expertise in configuration and management.
- Integration Effort: While ELK is powerful, integrating it into existing systems and configuring it to meet specific needs can require significant effort.
Learn more about ELK stack here: ELK Stack: Elasticsearch, Kibana, Beats & Logstash | Elastic.
Wrapping up the best open-source DevOps Monitoring Tools in 2024
When it comes to cost-effectiveness, open-source solutions make a lot of sense in IT. With operations and security they offer tremendous benefits. The list of apps we have considered in the post contains only a few of the technologies available in building out a monitoring solution for companies and cloud providers.
More in this topic


Discuss this in the Community
Google is updating how articles are shown. Don’t miss our leading home lab and tech content, written by humans, by setting Virtualization Howto as a preferred source.
About The Author
