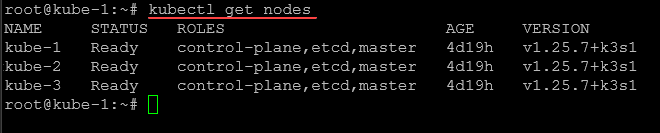
Kube-Prometheus-Stack installation and configuration
The Kube-Prometheus-Stack is a great tool for monitoring your Kubernetes clusters, offering comprehensive visibility into your infrastructure. This blog post covers various aspects of using the Kube-Prometheus-Stack, from getting started with Helm to ensuring optimal configurations and security measures. We will also discuss Kubernetes exporters, using federation for multiple clusters, and developing custom Prometheus rules and Grafana dashboards.
What is the Kube-Prometheus-Stack solution?
The kube with Prometheus operator chart allows you to install the kube Prometheus project stack that allows monitoring your Kubernetes clusters effectively. It provides observability to various aspects of your K8s environment and Prometheus discovers podmonitors .
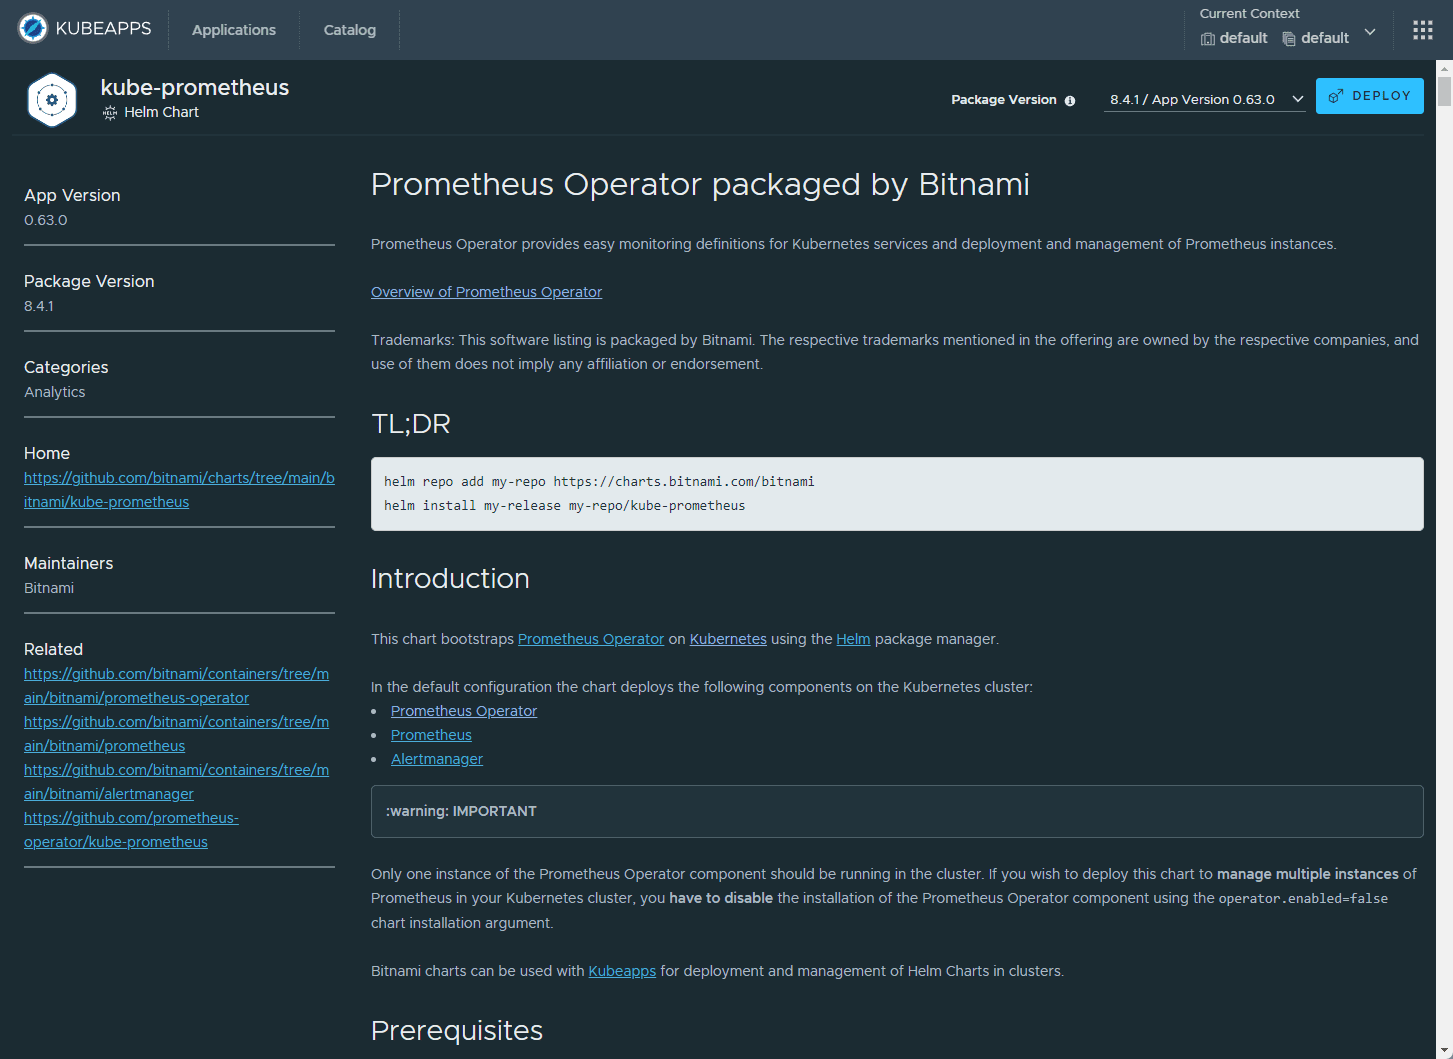
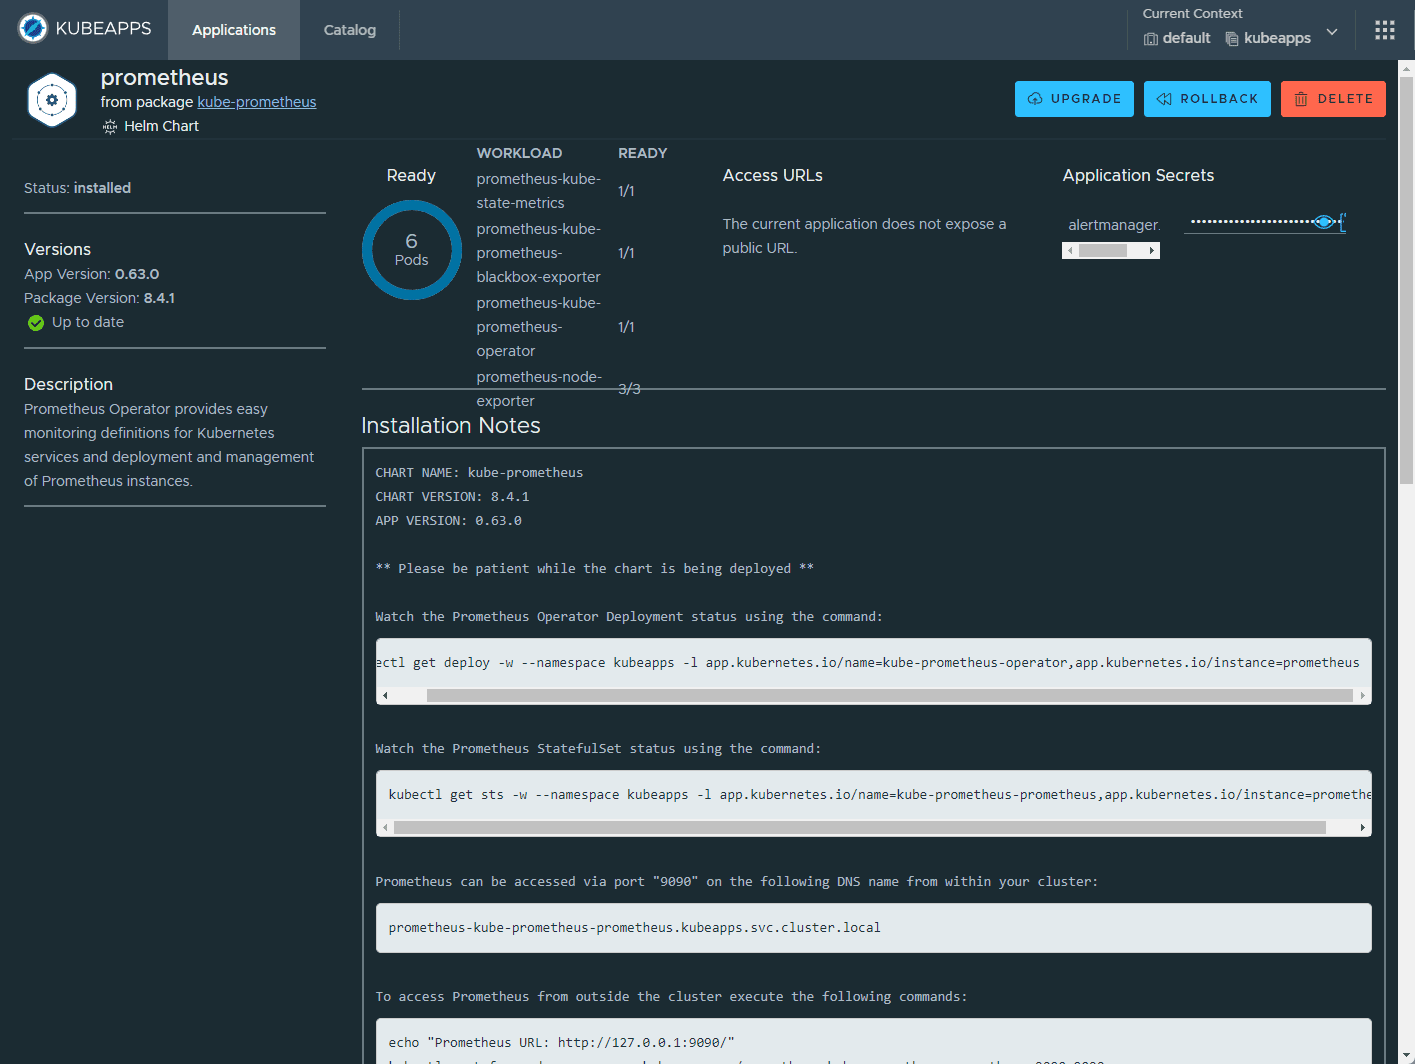
The Kube-Prometheus-Stack is part of the kube-prometheus project, which provides a set of Kubernetes manifests, Grafana dashboards, and Prometheus rules for monitoring Kubernetes clusters. Below, we are using the Kubeapps dashboard to install. You can also perform a helm rollback, delete, etc.
https://raw.githubusercontent.com
When installing the Kube-Prometheus-Stack, you must ensure the raw.githubusercontent.com domain is accessible from your Kubernetes cluster.
You can use Prometheus for alerting and Prometheus rules combined to deliver observability on metrics in your Kubernetes cluster.
Get Helm Repository Info
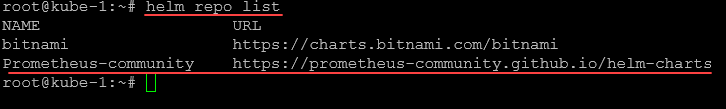
Before installing the Kube-Prometheus-Stack, you need to add the Prometheus community Helm repository to your Helm client:
helm repo add Prometheus-community https://prometheus-community.github.io/helm-charts
helm repo update
This command adds the Prometheus community Helm charts repository and updates your Helm client with the latest charts and versions. To see your helm repos, you can use the helm repo list command:
Minimal recommended Prometheus version
Prometheus LTS refers to specific releases of Prometheus that receive bug fixes for an extended period, providing long-term support.
Every six weeks, a new cycle of minor Prometheus releases begins. After this period, minor releases generally no longer receive bug fixes. If a user encounters a bug in a minor release, they typically need to upgrade to the latest Prometheus release.
Upgrading Prometheus is typically straightforward due to the API stability guarantees in place. However, there is always a risk that new features and enhancements could lead to regressions, which may require another upgrade.
Prometheus LTS releases, on the other hand, receive bug, security, and documentation fixes for a period of one year. The build toolchain is also kept up-to-date. This allows companies that depend on Prometheus to limit the risks associated with upgrading while still being able to rely on a community-maintained Prometheus server.
Tracking installations
You can track major chart version change using the:
helm history command and keeping up with the versions installed and updated.

You can see the chart release and version upgrades prometheus operator.
What are typical Kube-Prometheus use cases?
Kube-Prometheus-Stack is typically used for:
System performance monitoring: Gain insights into the performance of your Kubernetes cluster, including CPU and memory usage, network traffic, and disk space utilization.
Alerting and incident management: Set up alerts based on specific thresholds and metrics to proactively detect and manage incidents in your cluster.
Observability: Enhance your Kubernetes cluster’s health visibility, allowing you to make informed decisions and optimize your infrastructure.
System performance monitoring
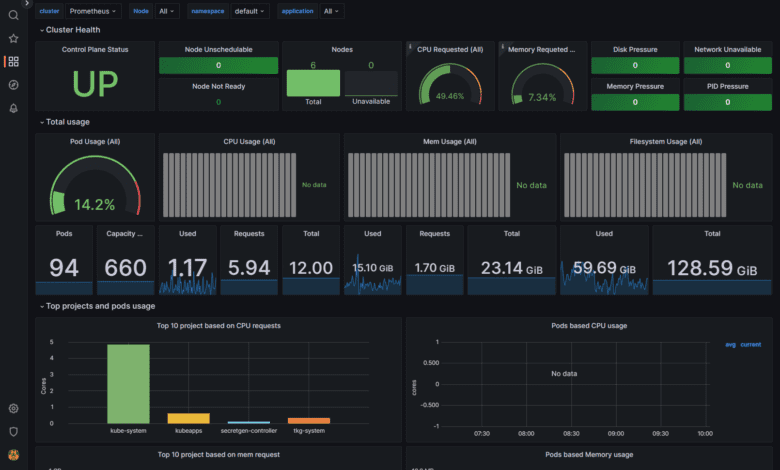
Kube-Prometheus-Stack provides out-of-the-box monitoring capabilities using Prometheus, Grafana, and Alertmanager. It collects metrics from various Kubernetes components and allows you to visualize them using chart Grafana dashboards.
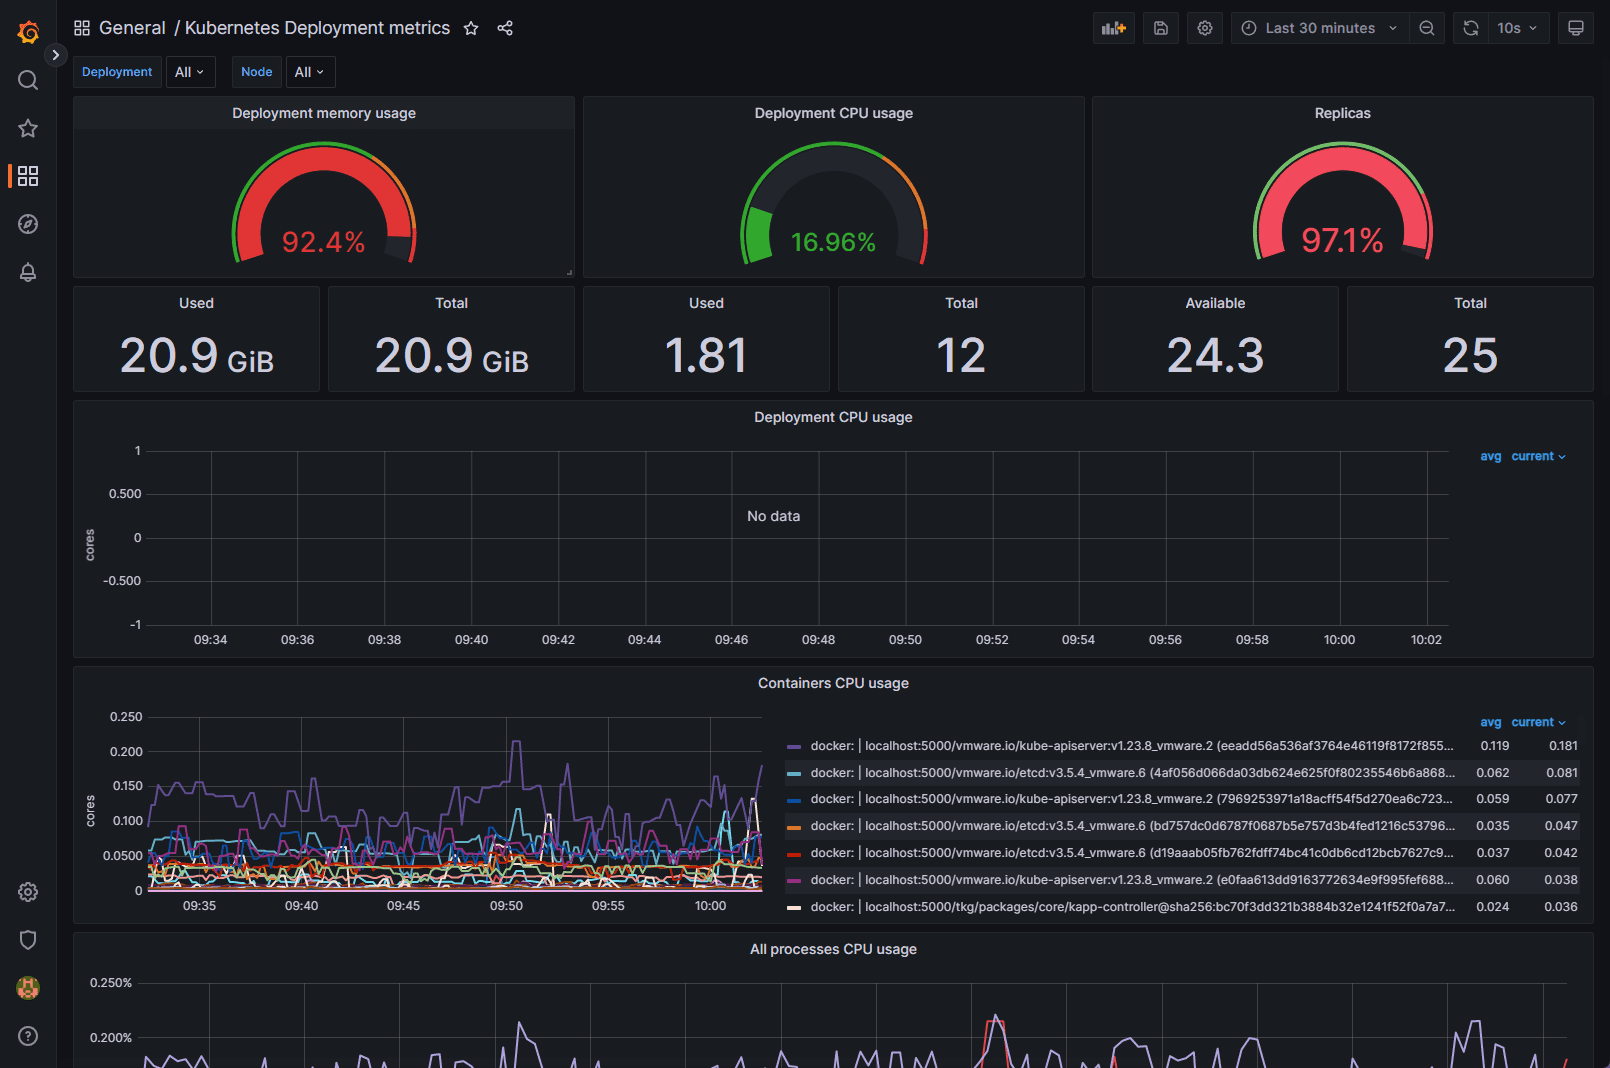
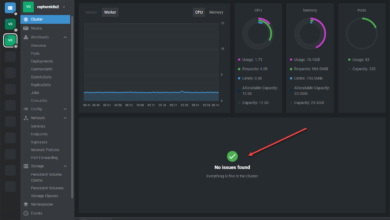
Below is another Grafana dashboard displaying Kubernetes metrics.
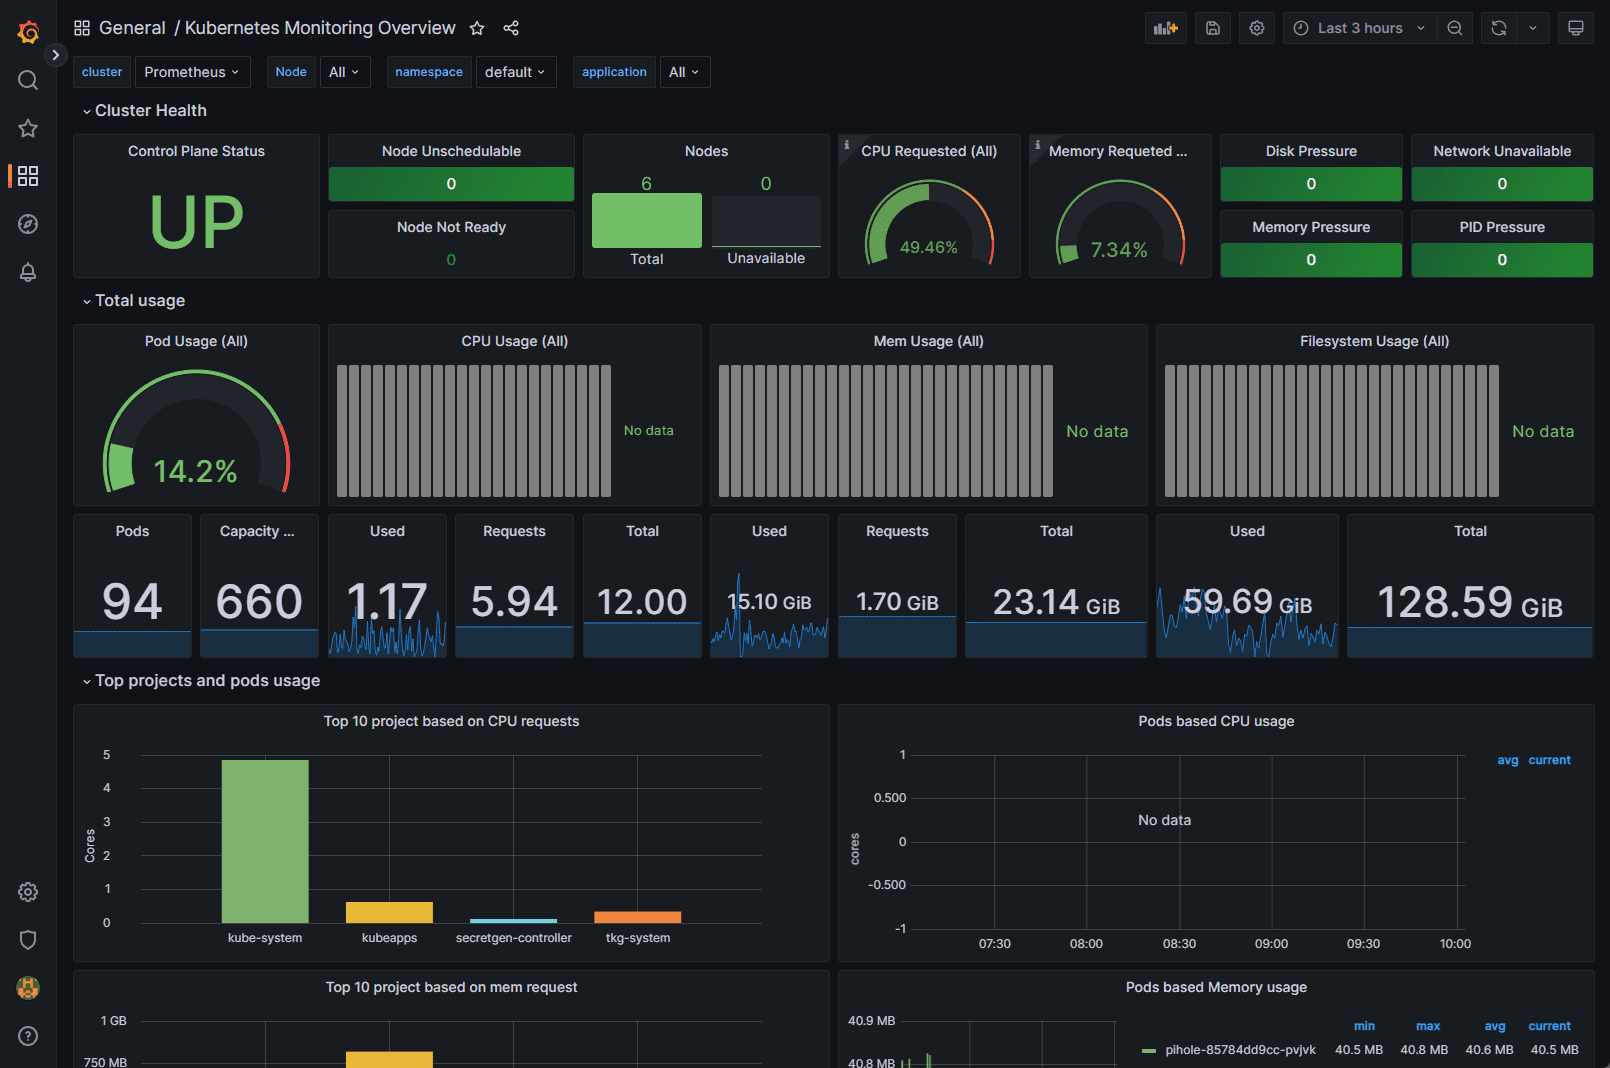
After deploying the Kube-Prometheus-Stack, you can access the Grafana UI to explore and analyze your cluster’s performance metrics. You can also set up custom dashboards tailored to your specific needs.
Ensure each container has a configured CPU limit
It is crucial to set CPU limits for each container to prevent resource contention and ensure optimal cluster performance. You can configure CPU limits in the resources section of the container specification in your Kubernetes deployment:
resources: limits: cpu: <CPU_LIMIT>Replace <CPU_LIMIT> with the desired value, such as 500m for 0.5 CPU cores.
Upgrading Chart
To upgrade the Kube-Prometheus-Stack Helm chart to the latest version, use the following command:
helm upgrade <RELEASE_NAME> prometheus-community/kube-prometheus-stack -n <NAMESPACE>Replace <RELEASE_NAME> with the name of your release and <NAMESPACE> with the namespace in which the release is deployed.
Ensure each container has a configured memory request
Configuring memory requests helps Kubernetes efficiently schedule and allocate resources for your workloads. Set memory requests in the resources section of the container specification:
resources: requests: memory: <MEMORY_REQUEST>Replace <MEMORY_REQUEST> with the desired value, such as 256Mi for 256 MB of memory.
Prevent ConfigMap security vulnerability (CVE-2021-25742)
To mitigate the security vulnerability CVE-2021-25742, which affects ConfigMap usage in Kubernetes, follow these best practices:
Limit the scope of RBAC permissions: Restrict access to ConfigMaps and avoid granting users or service accounts unnecessary privileges.
Use network policies: Implement network policies to isolate and secure communication between pods.
Monitor and audit: Monitor your cluster for suspicious activity and perform regular audits to ensure compliance with security policies.
Upgrading an existing Release to a new major version
Review the release notes for any breaking changes or required manual actions when upgrading to a new major version of the Kube-Prometheus-Stack Helm chart. Perform the upgrade using the helm upgrade command mentioned in the “Upgrading Chart” section.
Ensure each container has a configured readiness probe
Readiness probes help Kubernetes determine when a container is ready to start accepting traffic. Configure a readiness probe in the container specification:
readinessProbe: httpGet: path: /ready port: <PORT> initialDelaySeconds: 5 periodSeconds: 10Replace <PORT> with the appropriate port number for your application.
Uninstall Helm Chart
To uninstall the Kube-Prometheus-Stack Helm chart, use the following command:
helm uninstall <RELEASE_NAME> -n <NAMESPACE>Replace <RELEASE_NAME> with the name of your release and <NAMESPACE> with the namespace in which the release is deployed.
Prometheus Operator
The Prometheus Operator facilitates the deployment and management of Prometheus and related monitoring components within Kubernetes using the core Prometheus operator pod. Its primary goal is to streamline and automate the setup of a Prometheus-based monitoring stack for Kubernetes clusters based on the Prometheus operator version.
When one installs Prometheus operator, some of the features of the Prometheus operator include:
The ability to use Kubernetes custom resources to deploy and manage Prometheus, Alertmanager, and related components.
Simplified configuration for basic Prometheus functionalities such as versions, persistence, retention policies, and replicas using native Kubernetes resources.
Automatic generation of monitoring target configurations based on Kubernetes label queries, eliminating the need to learn a Prometheus-specific configuration language.
The command to install the named Prometheus Operator chart by adding the repo is the following:
helm repo add prometheus-community https://prometheus-community.github.io/helm-charts
helm repo update
To install the Prometheus operator release:
helm install [RELEASE_NAME] prometheus-community/kube-prometheus-stackYou can also run multiple Prometheus instances and manage these from a single Prometheus operator. Just install multiple Prometheus objects to your cluster with different configurations. The Prometheus operator will manage any number of Prometheus instances.
You can watch the Prometheus operator install using the following command:
kubectl get deploy -w --namespace kubeapps -l app.kubernetes.io/name=kube-prometheus-operator,app.kubernetes.io/instance=prometheusa temporary loss of monitoring capabilities during the redeployment process.
Wrapping up
The Kube-Prometheus-Stack is a powerful tool for monitoring Kubernetes clusters. By following the best practices and recommendations listed in the post, you can easily stand up a monitoring solution for your Kubernetes cluster that provides excellent visibility and observability to your Kubernetes infrastructure.