K3s Traefik Dashboard Enable and Configuration
As organizations start to build modern applications and transition from traditional monolithic apps to microservices, many are using containerized workloads running on top of Kubernetes. However, Kubernetes is not a technology for the faint of heart. It can present challenges to organizations, including network configuration and exposing apps and services running the K8s cluster to the outside world. Traefik proxy allows businesses to run containerized microservices quickly and easily. Using K3s, a tiny Kubernetes distribution, you can easily play around with Traefik. Let’s look at the K3s Traefik dashboard enable and configuration and see how you can easily install K3s with Traefik and configure the built-in Traefik dashboard.
What is Traefik?
Traefik is a modern ingress controller that can handle incoming connection requests to various applications and services running in your Kubernetes cluster. It can do the following:
- Modern load balancer – Traefik manages incoming network traffic across your cluster
- API Gateway – It serves as a single entry point for microservices deployments
- Kubernetes ingress – It allows centralizing routing for your Kubernetes deployments
- Service Mesh – You can monitor and route your internal communications
Traefik has both a free and enterprise offering. The enterprise offering includes 24/7 support, as you would expect. It includes even more robust features, including but not limited to the following:
- Ingress management
- Service Mesh: service-to-service communication
- API Gateway
- API Portal
HTTP, HTTP/2, TCP, UDP, Websockets, GRPC - Mirroring
- Canary deployments
- Stickiness
- Active health checks
- Middlewares (circuit breakers, automatic retries, HTTP cache, buffering, response compression, headers)
- Custom middlewares through public and private plugins
- Distributed in-flight request limiting
- Distributed rate limiting (per-IP, per-host, per-header)
- OpenID Connect (OIDC)
- JWT authentication
- LDAP authentication
- Open Policy Agent (OPA)
- oAuth2 authentication
- HMAC authentication
- Automatic HTTPS
- Distributed Let’s Encrypt
- Unlimited Let’s Encrypt certificates
- Multi-cluster Let’s Encrypt agent
- Custom certificates
- Encrypted cluster communication
- Vault (by Hashicorp) support
Learn more about Traefik here:
What is K3s?
If you want to get your hands on Kubernetes and have a very lightweight and easy way to do this, using K3s from Rancher is a great way to spin up a Kubernetes lab easily. K3s is lightweight enough to run on Raspberry Pi devices, and it can also run inside Docker containers using a freely available open-source tool called K3D. K3D enables running K3s inside Docker containers,
K3s with Traefik
One of the cool things about working with K3s and spinning it up with K3D is that it automatically includes the Traefik ingress controller. So, as you provision your K3s cluster using K3D, you will have Traefik ingress by default. K3D and K3s also allow turning off the Traefik ingress controller if you want to use or learn another ingress solution.
K3s Traefik Dashboard Enable and Configuration
By default, when you spin up a new K3s cluster inside Docker using K3D, Traefik is not completely configured. There are a few things you need to do to be able to get to the Traefik dashboard when you spin up your K3s cluster.
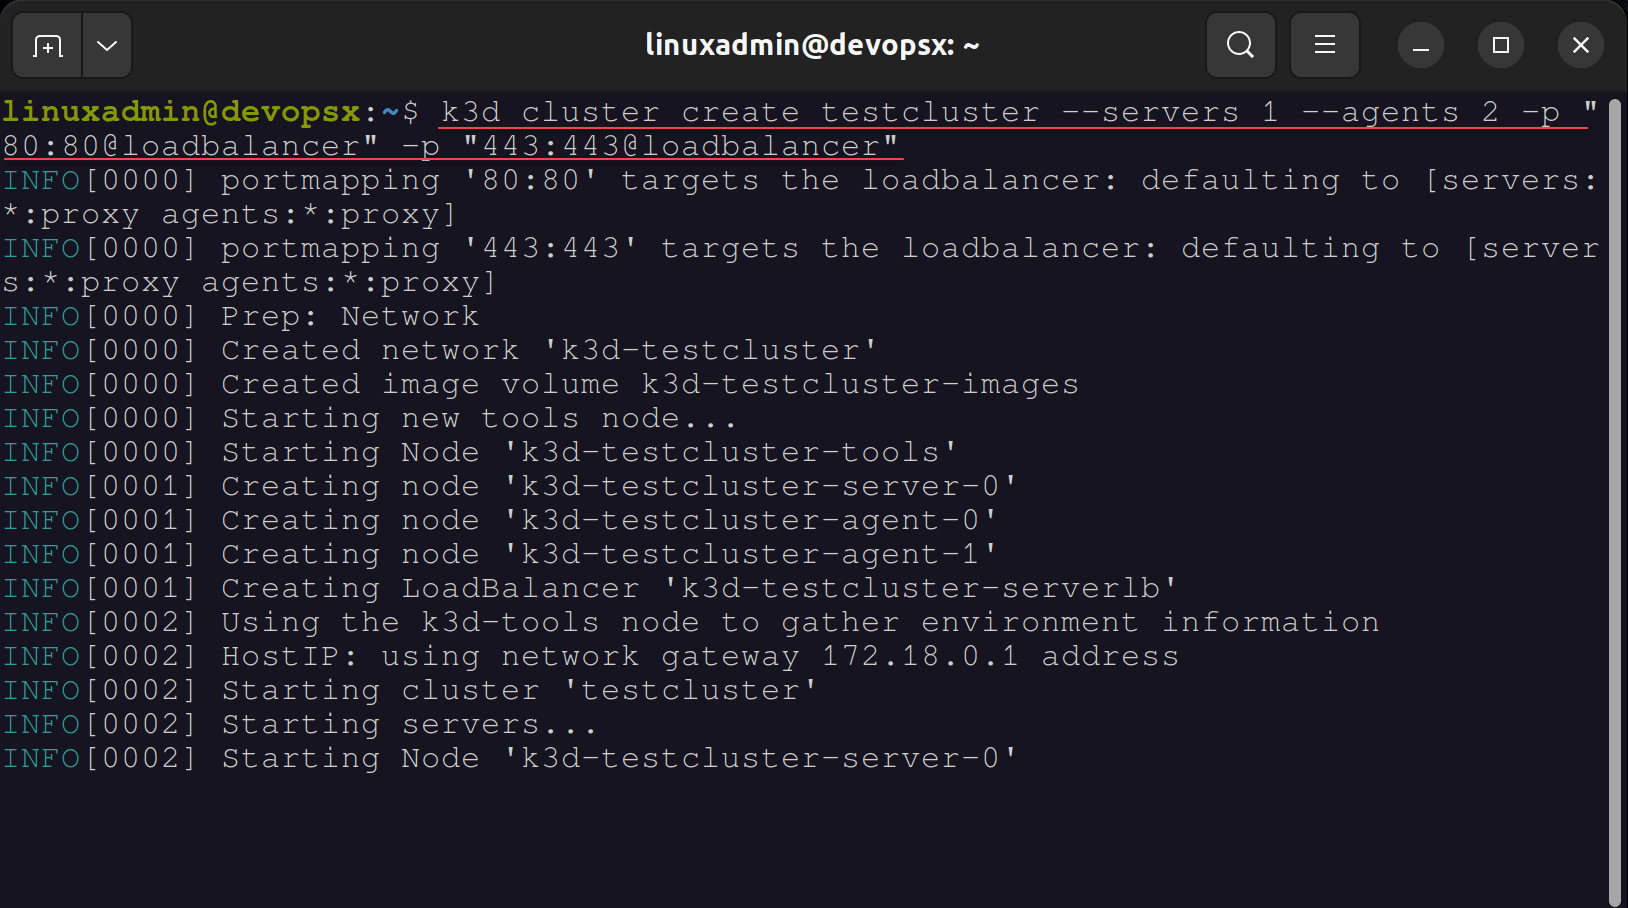
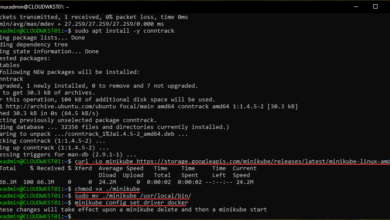
Let’s take a look and see what is required to enable the Traefik dashboard and put a basic configuration on your Traefik-enabled K3s cluster. First, we need to create a new K3s cluster using K3D. To do that, I used the following cluster creation command:
k3d cluster create testcluster --servers 1 --agents 2 -p "80:80@loadbalancer" -p "443:443@loadbalancer" The port mappings in the command allow enabling 80 and 443 for handling HTTP and HTTPS requests when using Traefik. In the above command, we create the cluster with 1 control (server) node and 2 worker (agent) nodes.
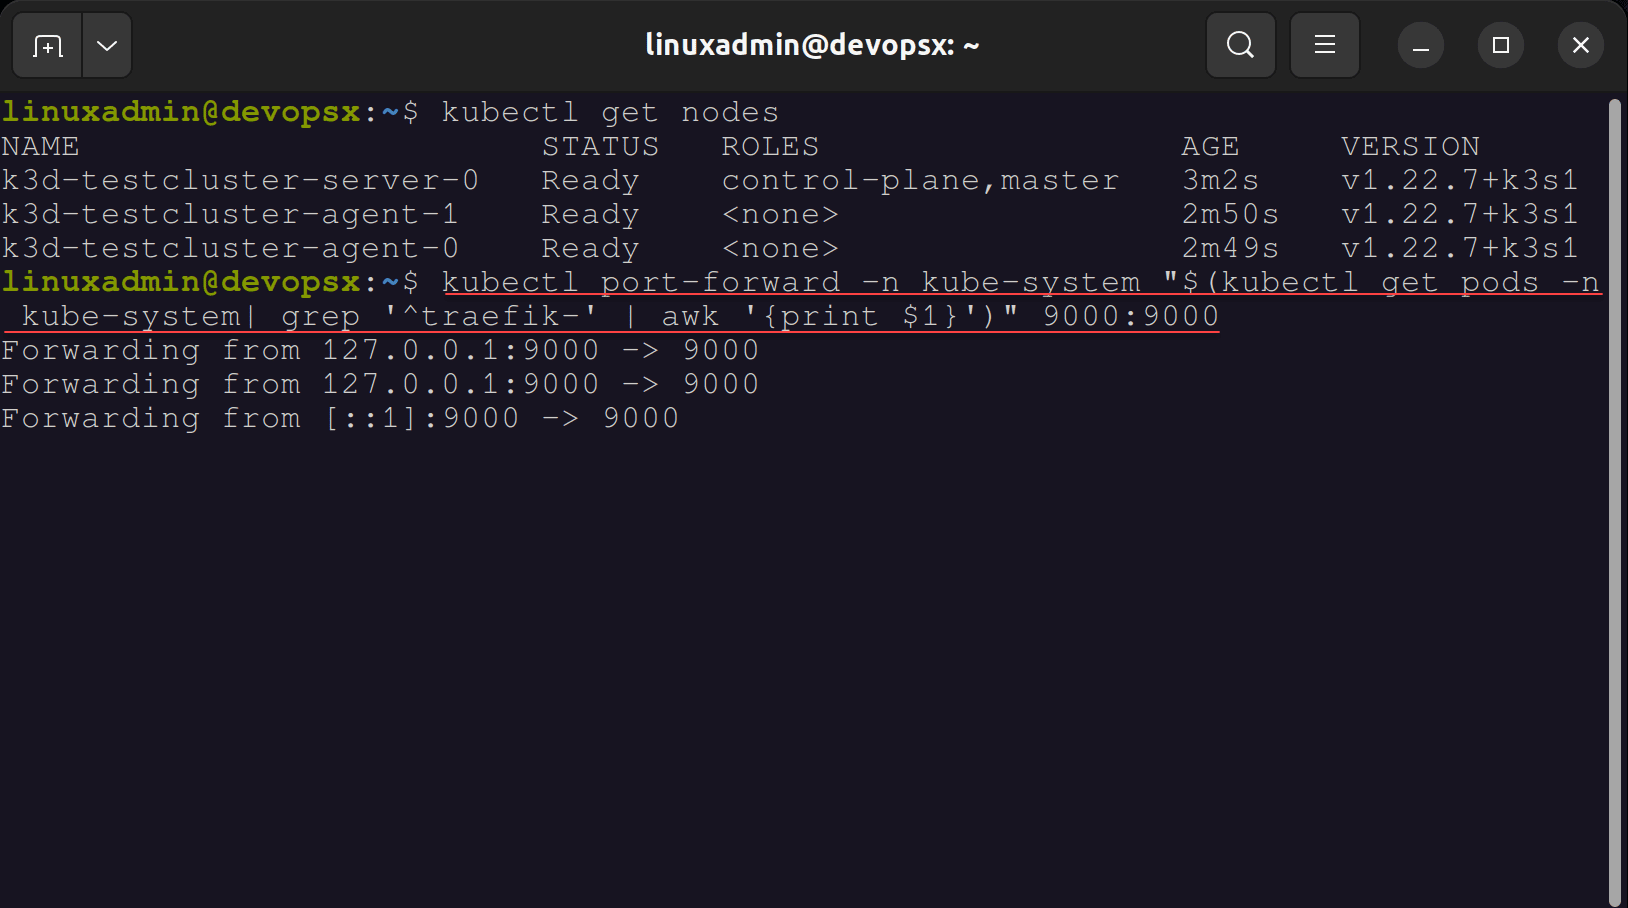
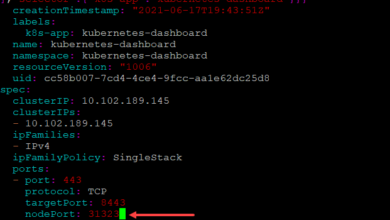
After we have created the K3s cluster with the K3D utility, we need to create a simple port forward to forward traffic to the Traefik dashboard. To do this, you need to use the following command:
kubectl port-forward -n kube-system “$(kubectl get pods -n kube-system| grep ‘^traefik-‘ | awk ‘{print $1}’)” 9000:9000 Forwarding from 127.0.0.1:9000 -> 9000
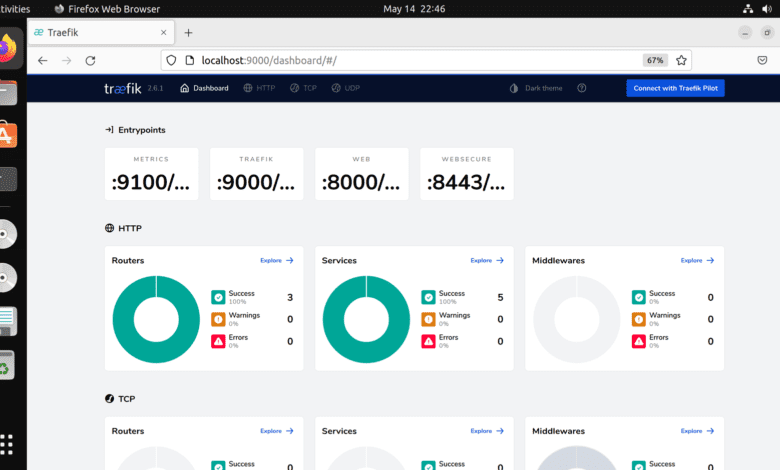
To access the Traefik dashboard, browse to the following URL. ***Note*** the trailing slash is important and needed or you will get an error 404.
http://localhost:9000/dashboard/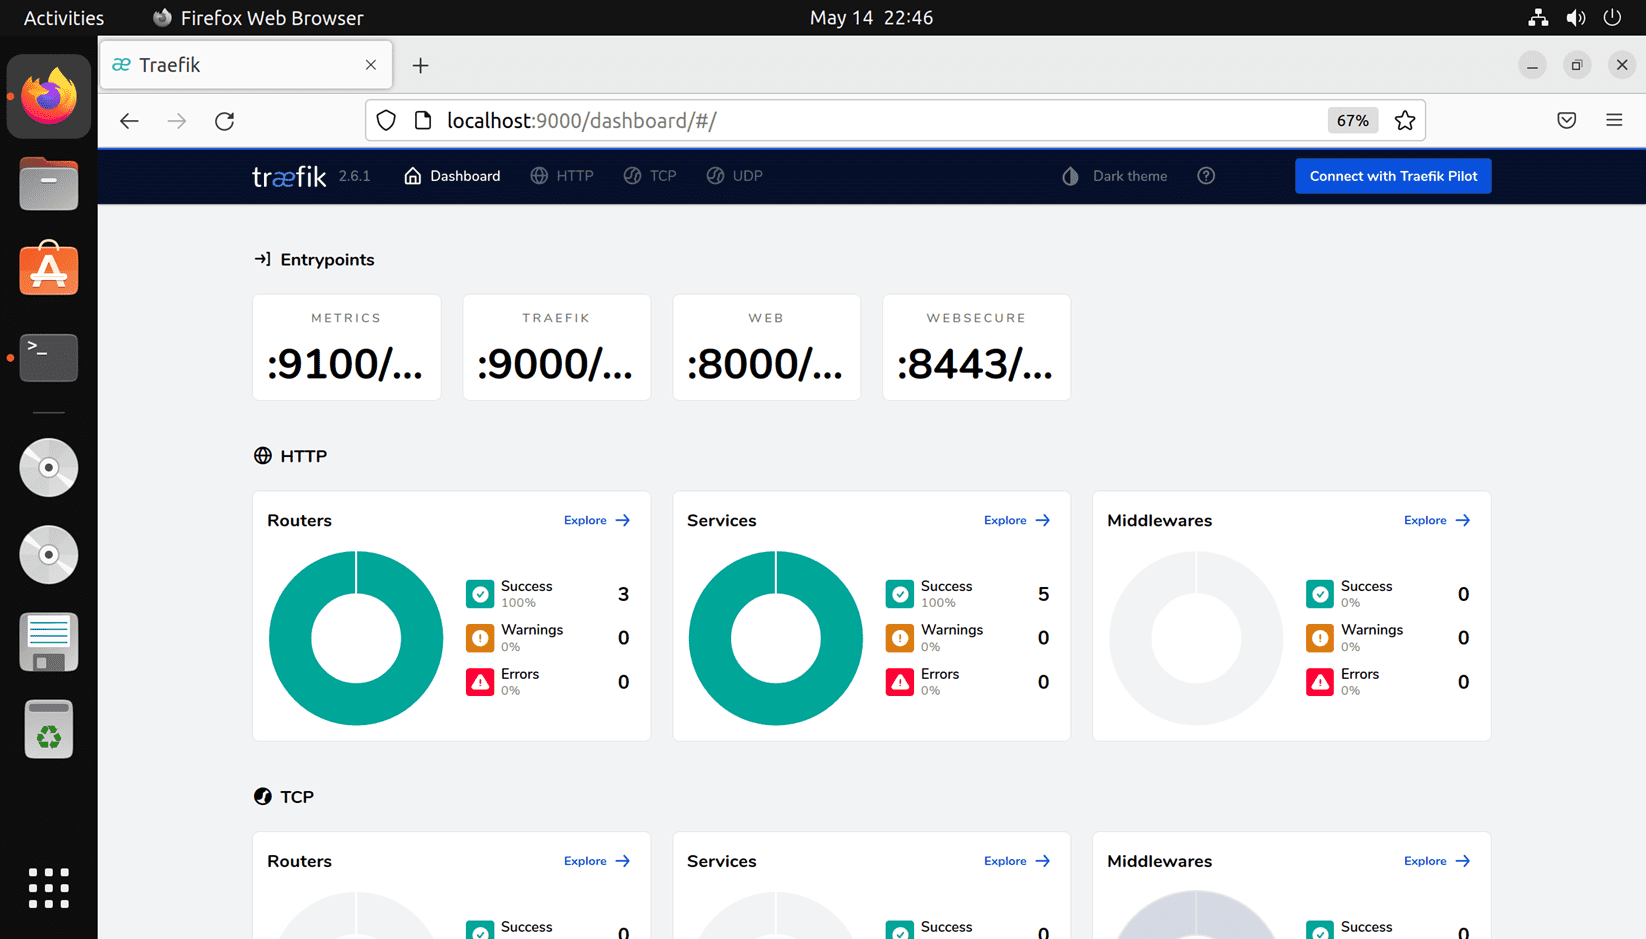
At this point, you can start setting up your services within the Traefik dashboard for ingress control to your Kubernetes cluster. The great thing about running the solution inside K3s is it provides a great way to learn the solution quickly and easily in a lab environment.
K3s Traefik Dashboard FAQs
- What is Traefik? Traffic is a powerful Kubernetes ingress controller that can handle incoming connection requests to various applications and services running in your Kubernetes cluster. It offers a modern load balancer, API gateway, Kubernetes ingress, and service mesh, whether you are using the enterprise or free offerings.
- What is K3s? K3s is a tiny Kubernetes offering from Rancher that provides an extremely small footprint Kubernetes distribution that is great for labs, learning, and even production deployments. It is small enough to run on Raspberry Pi hardware.
- What is Kubernetes? Kubernetes is a Kubernetes orchestration platform that helps solve many challenges with running containerized workloads in business-critical production environments. Kubernetes helps to provide availability and scalability in running containers.
- What is ingress? When running pods in Kubernetes, you have to have a way to get connectivity to the internal Pods. This is one of the challenges with Kubernetes, as there are many ways to expose internal Pods and their services to end-users. These include using a Load balancer, NodePort, and ClusterIP. Ingress controllers are the preferred way to expose services in production environments. Ingress controllers are essentially a unique load balancer option that abstracts the application traffic trouting and bridges the Kubernetes services with external ones. Ingress controllers provide load balancing between the Kubernetes pods, egress traffic management, and they monitor the pods running in Kubernetes to update load-balancing when pods are deployed or removed.
Wrapping Up
Enabling the K3s Traefik Dashboard and configuring it to service the ingress functionality is fairly straightforward. Hopefully the quick tutorial shown will help any who want to play around with Traefik along with K3s can easily get this enabled in their environment.


This is a terrible idea. You should never expose the API insecurely. I was expecting a guide on how to use cert-manager to create a valid certificate and expose the dashboard via Traefik itself, so middlewares can be attached.
Dylan,
Thanks for the comment! Definitely, you should always use SSL in production environments. This is a guide to simply get started learning Traefik and taking a look at the built-in dashboard. But good callout, you want to use SSL for prod environments.
Brandon
Any idea why the dashboard is showing different http and https ports (namely 8000 & 8443)?
Martynas, thanks for the comment and reaching out! Let’s take this conversation to the forums if that sounds good. Can you sign up there and we can discuss?
Brandon