The K3s lightweight Kubernetes distribution is a great Kubernetes distribution across many different use cases. I have been using K3s in the home lab for various purposes. How can you get a K3s dashboard up and running once you have your K3s cluster running? This quick post will look at K3s dashboard install and configuration easily with Portainer.
Portainer – Easy and simple to install K3s dashboard
I have been writing a lot lately about Kubernetes and various tools and utilities to easily spin up Kubernetes clusters, including management and configuration. If you are working with any Kubernetes environment, including K3s, Portainer is an easy way to have a robust K3s dashboard that provides a wealth of information about your K3s Kubernetes cluster at your fingertips.
Portainer provides K3s dashboard information that provides information, including but not limited to the following:
- CPU
- Memory
- Nodes
- Labels
- Taints
- Applications running
- Events
With little effort, you can install Portainer on your K3s cluster or any other Kubernetes cluster and quickly have visibility to many areas of your Kubernetes cluster. Let’s look at how to install Portainer as a K3s dashboard, and then we will take a look at different components of the K3s dashboard.
Install Portainer in K3s Kubernetes
The process of installing Portainer inside your K3s Kubernetes cluster as a K3s dashboard is straightforward Portainer documentation provides the command to install using a simple YAML file exposed via NodePort. Just follow the documentation to install Portainer on Kubernetes using the method you want to use for deployment. I am using the YAML installation method to spin up Portainer using NodePort.
kubectl apply -n portainer -f https://raw.githubusercontent.com/portainer/k8s/master/deploy/manifests/portainer/portainer.yamlK3s dashboard using Portainer
Now, let’s take a look at the various aspects of the K3s dashboard using Portainer. As mentioned above, the Portainer dashboard features give great visibility into your Kubernetes cluster, including resource usage for your nodes, services running, event logs, and other extremely valuable health information.
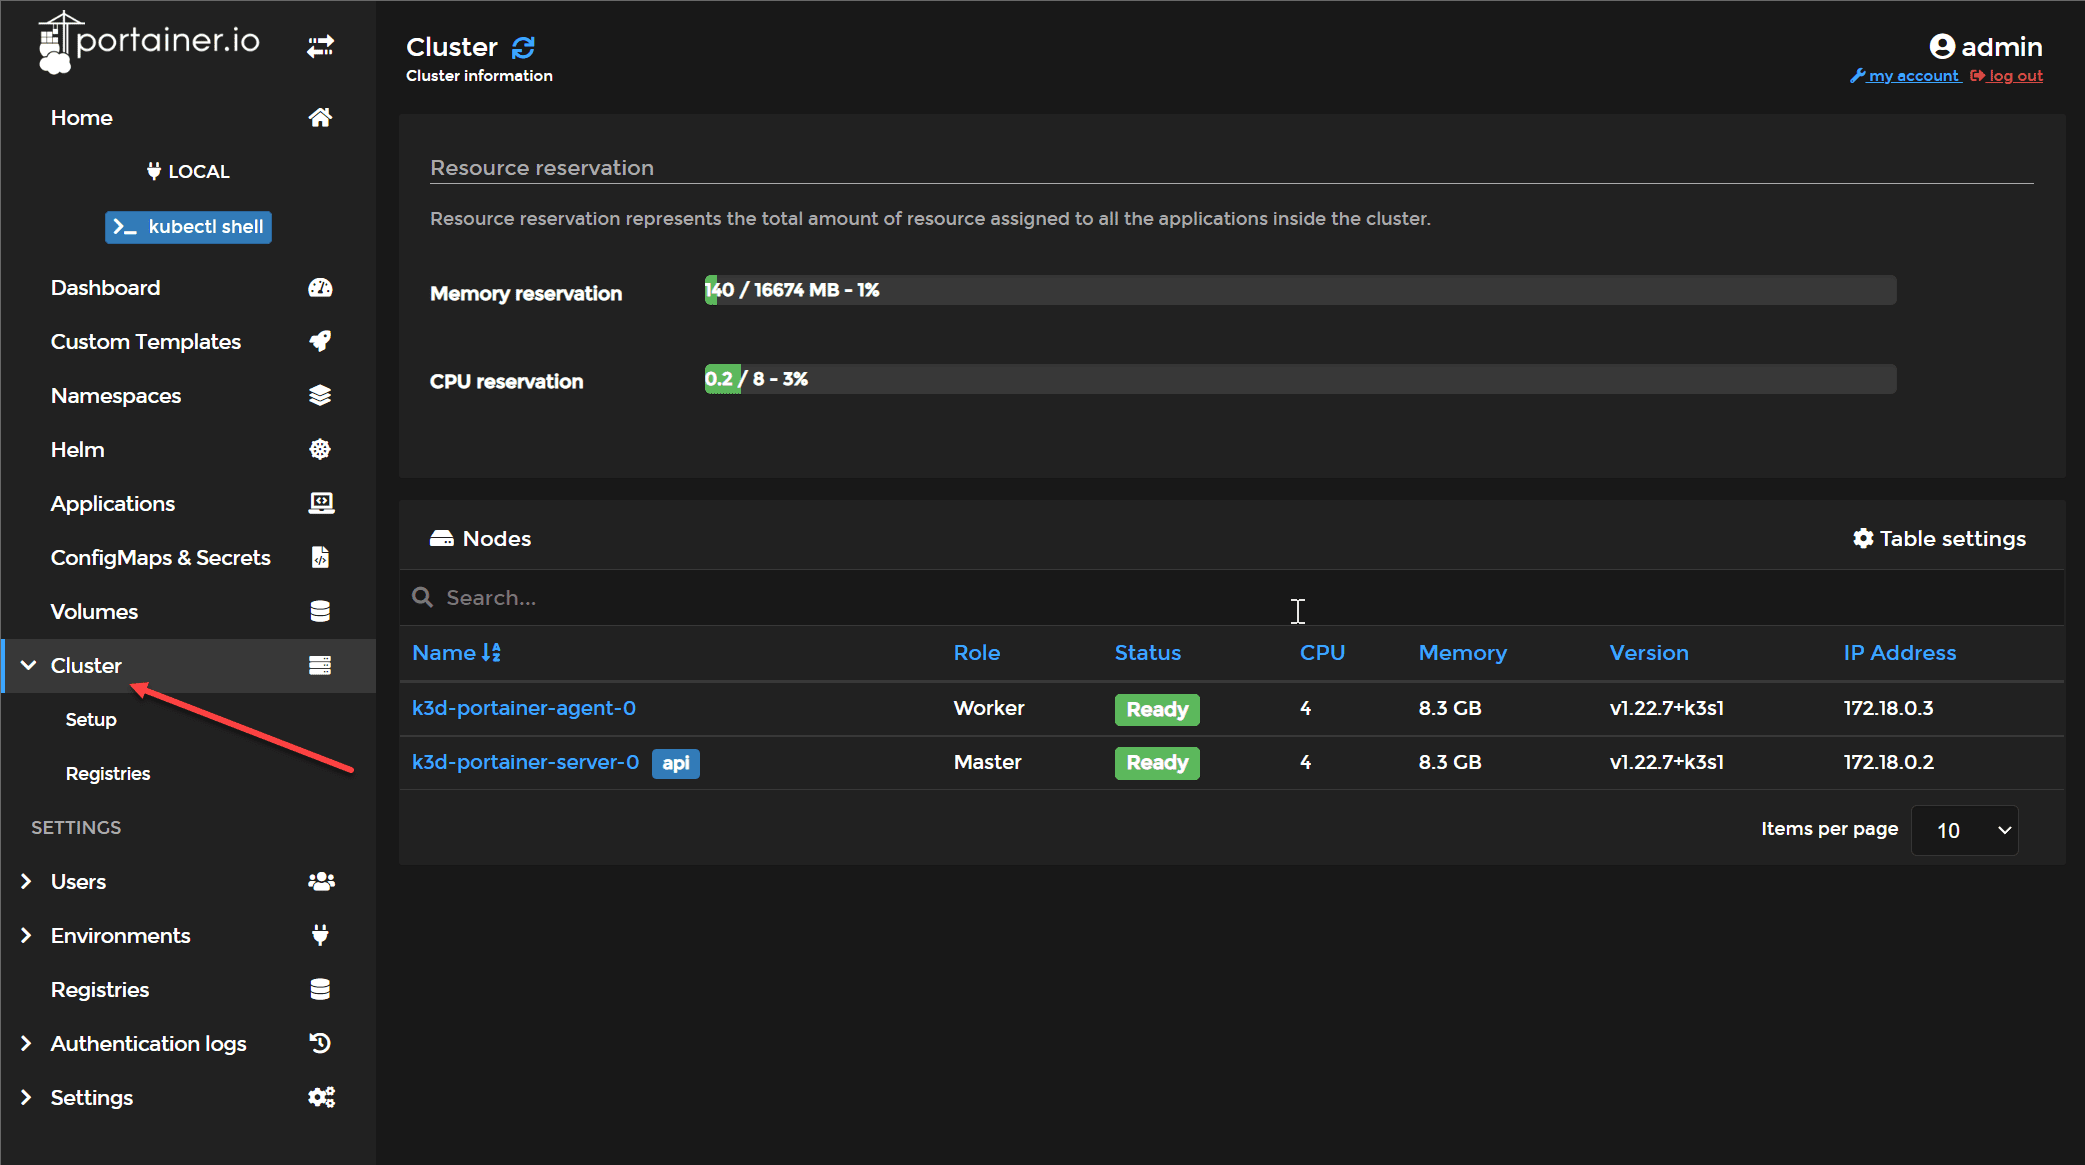
Below, if you click the Cluster menu, you will see health metrics, such as memory reservation and CPU utilization. As you can see below, the K3s dashboard with Portainer shows the nodes in your Kubernetes cluster, their role, status, memory, version, and IP address information.
Below, in the Table settings, you can turn on auto-refresh if you want the statistics to be refreshed automatically while you have the K3s dashboard pulled up. Also, note the Search field. If you have multiple nodes and clusters, you can search for a specific node in the view.
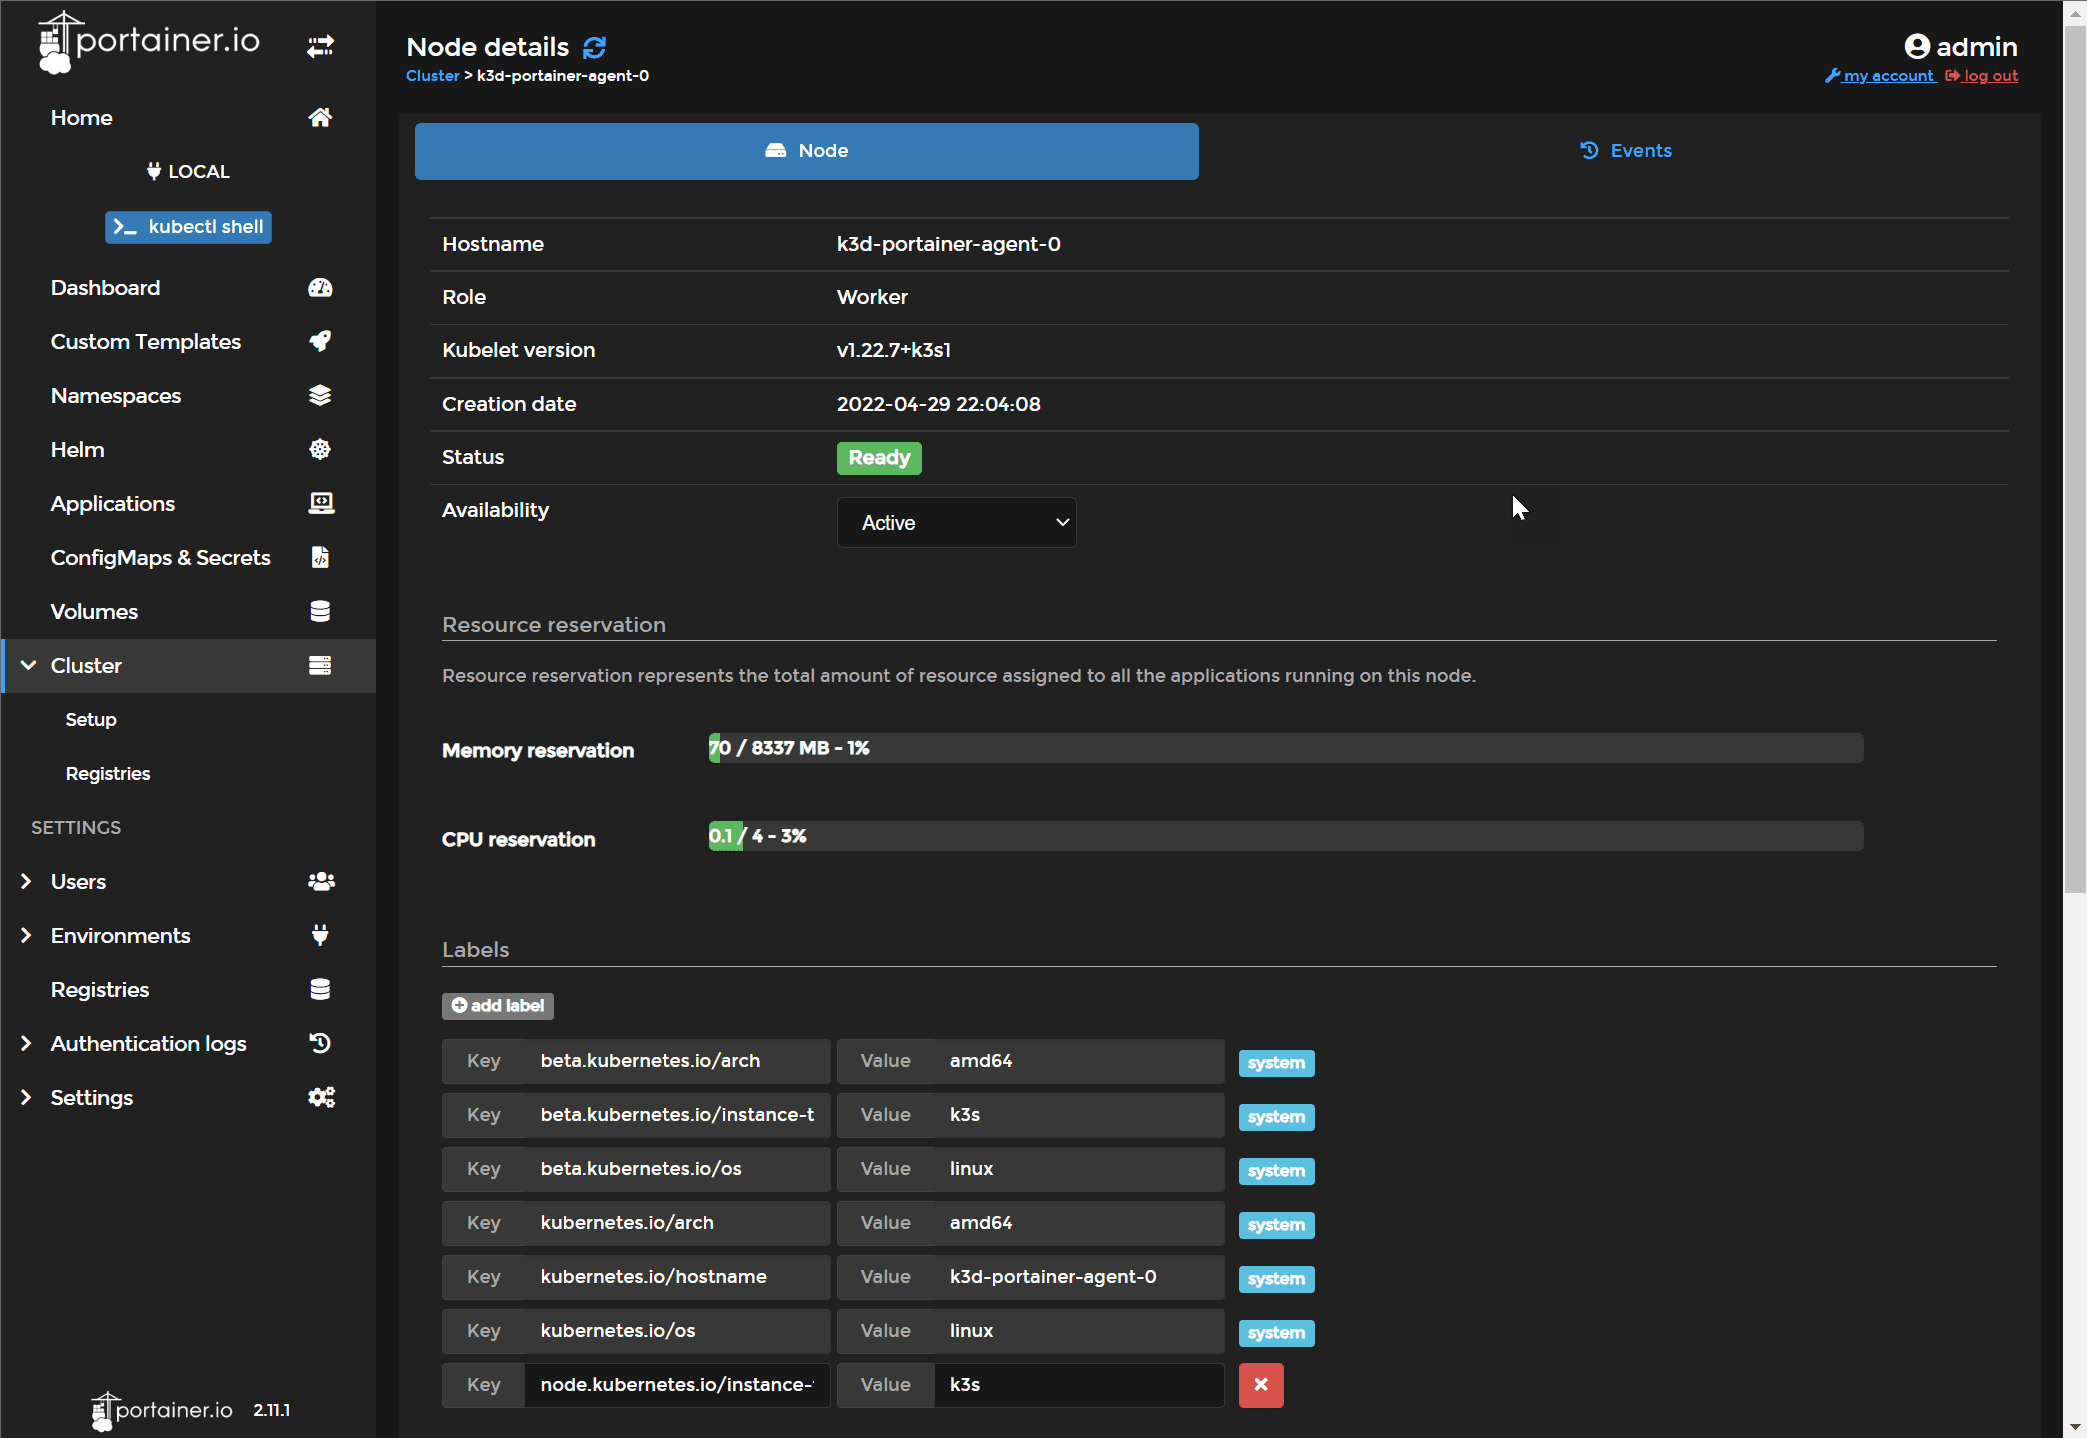
If you click one of the K3s nodes, you will be taken first to the Node screen. This allows you to drill into the details of each individual nodes in the K3s cluster. Note the following information:
- Hostname – the name of the node in the K3s cluster
- role – What role is held by the node? Is it a control plane node or a worker node?
- Kubelet version – The version of the kubelet
- Creation date – When the node was created
- Availability – Is the node available for scheduling?
- Memory reservation – shows the memory reservation for the node
- CPU reservation – shows the CPU reservation for the node
- Labels – labels assigned to the node
- Key-value pairs in the keystone
This screen is more than informational as you can control the node’s availability. Note the Availability dropdown. You can drop down the menu and select Active, Paused, Drain to control the node’s state.
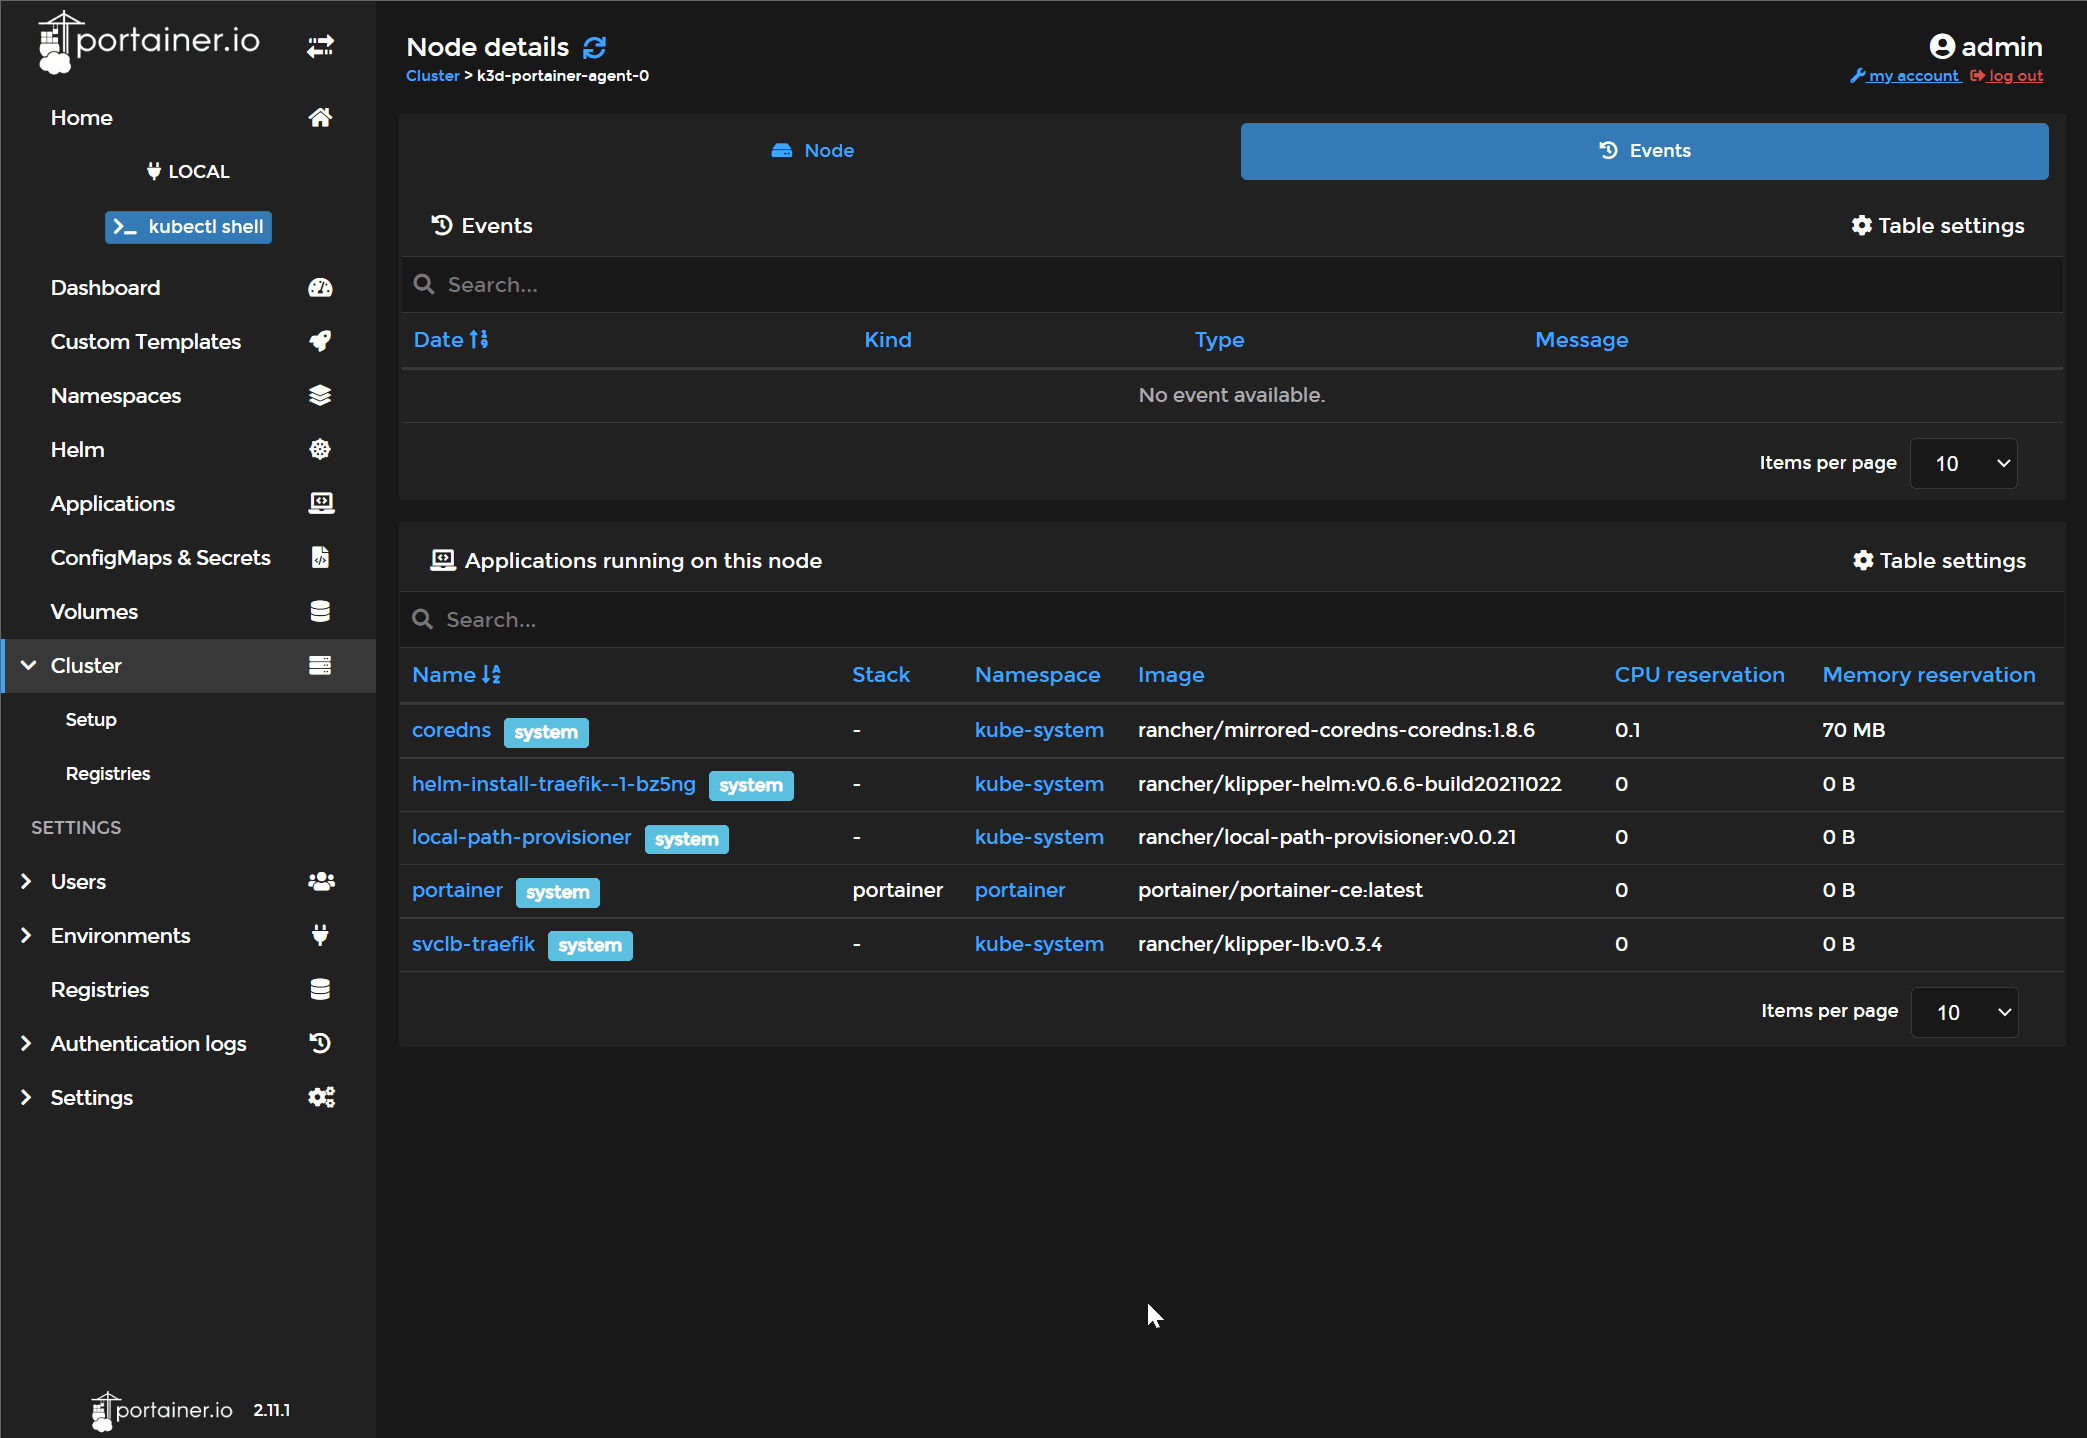
If you note, there is also an Events tab for each node. You can quickly view events for your Kubernetes nodes with the events tab. I don’t have any events showing for the newly created Kubernetes cluster. However, using the K3s dashboard with Portainer, you can easily access these.
Also, on the Events tab, you can see the applications running on this node. It allows you to see the applications running on your worker nodes with detailed information. These include:
- Name – The name of the application
- Stack – The stack
- Namespace – The Kubernetes namespace where the application is running
- Image – The application image
- CPU reservation – CPU reservation information
- Memory reservation – Memory reservation information
K3s dashboard FAQs
- Why do you need a K3s dashboard? Having a dashboard for your K3s Kubernetes installation allows you to easily see great information regarding the health, operational status, and other information for the cluster, including applications, resources, events, and other configuration information.
- What is Portainer? Portainer is an open-source solution allowing you to easily create a K3s dashboard showing information for your Kubernetes cluster. It is not just for K3s. You can use Portainer with any other Kubernetes distribution as well.
- Is Portainer free? Yes. Portainer is a free, open-source solution that is easy to download and deploy in your Kubernetes cluster.
- What information can you see in a K3s dashboard? You can see information like CPU, memory, node information, roles, applications, events,
Video showing how to install K3s
Other resources
- Kubernetes Bare Metal Load Balancer configuration with Nginx
- Create Kubernetes Cluster with Rancher and VMware vSphere
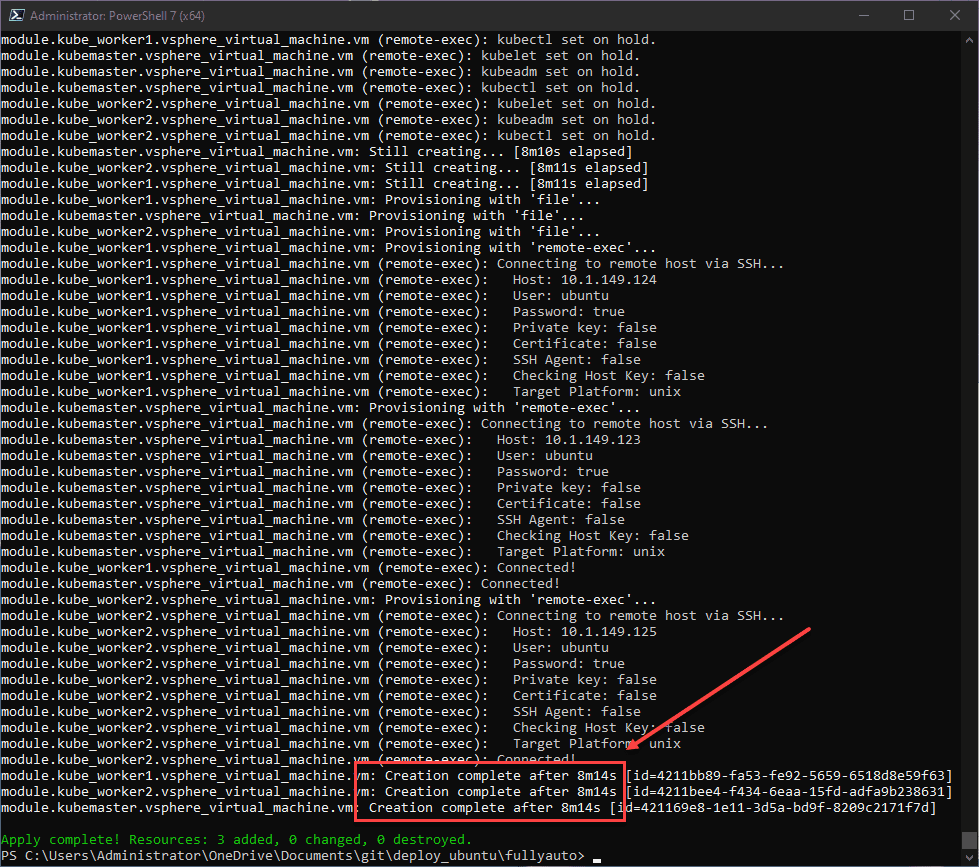
- Terraform vSphere Kubernetes automated lab build in 8 minutes
- Install Kubernetes in Windows using Tanzu Community Edition
- How to install Portainer on Ubuntu 22.04 and Upgrade existing installations
Wrapping Up
Hopefully, you have found this walkthrough of K3s dashboard installation and configuration using Portainer useful. As shown, Portainer is an open-source and freely available solution to create a quick K3s dashboard or dashboard for any other Kubernetes distribution. It gives quick visibility to resources, applications, events, and health information, and allows controlling the state of the K3s nodes, allowing you to pause or drain nodes.
Google is updating how articles are shown. Don’t miss our leading home lab and tech content, written by humans, by setting Virtualization Howto as a preferred source.
About The Author


There is no mention of how to access or setup access to Portainer once installed
To expose via NodePort, Portainer will be available on port 30777 for HTTP and 30779 for HTTPS). You can use the IP address of the workers or controller
Thank you Murtuza,
Brandon