Monitoring performance and health in a VMware vSphere environment is a critical task for vSphere administrators. Especially in larger environments, it can be a real challenge to keep a handle on overall vSphere environment health. Then there are other concerns such as the recent Meltdown and Spectre vulnerabilities. How do you keep up with which hosts and virtual machines need patching? We have covered Opvizor VMware Performance Analyzer before and found it to be an extremely powerful and intuitive tool to use in checking VMware vSphere performance and analyzing potential hotspots in the environment. It allows quickly getting an overview of key performance indicators in the environment so administrators can be proactive instead of reactive. Today really cools news from Opvizor – Opvizor VMware Performance Analyzer 4.8.0 Released New Features. The release notes include a lot of new features, bug fixes, and improvements. Let’s take a look.
Opvizor VMware Performance Analyzer 4.8.0 Release Notes
This is a huge release for Opvizor including many new features. Some of the official goodies contained in this release:
Data Crawling Improvements:
- Improved multi-threading support (starting 4 vCPU and higher for large environments)
- Integration with ESXTOP
- New metrics added (NUMA, CPU, Microcode, and ESXi patch level)
- Extended support for movement of VMs including renaming, VMs, cluster or or migration
- vCenter bug avoidance
- NetApp ONTAP 9.3 and NetApp OCUM 7.3
- OS collectors added (Windows, Linux and MS SQL)
Dashboard
- Meltdown and Spectre dashboard included with update indicators and performance changes due to patching
- New Dashboards for VM and ESXi host troubleshooting
- New help features contained in the VMware dashboards
- Visualization bug fixes
Other Improvements
- Admin interface changes
- Active Directory configuration and Active Directory group support for various roles
- Appliance logging enhancements
- Logging changes
- Grafana engine is now 4.6.3
- Heatmap plugin added
- Out of memory detection
- Bug fixes and improvements
As shown above, there are a tremendous amount of improvements and additions to this release, including help with this year’s hot topic – Meltdown and Spectre.
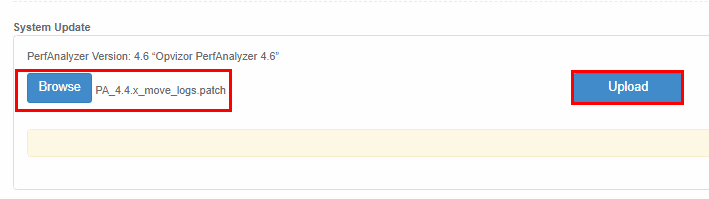
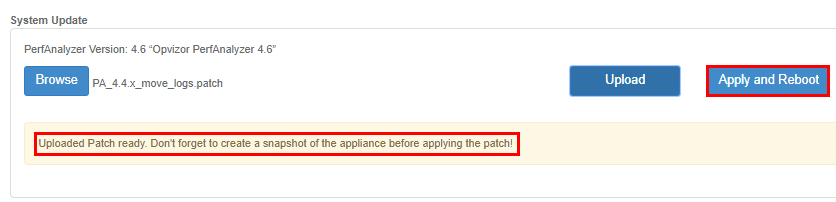
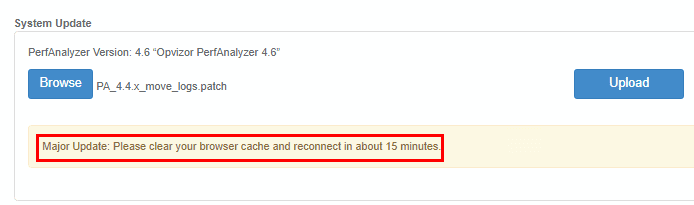
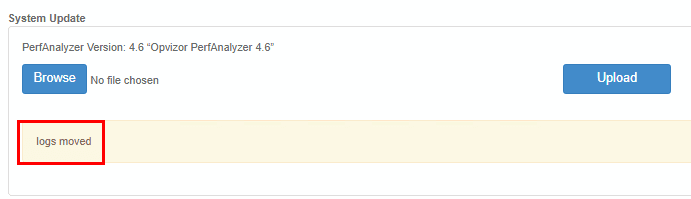
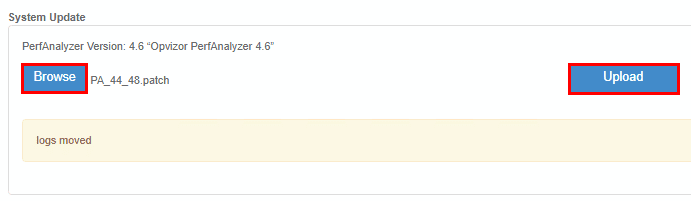
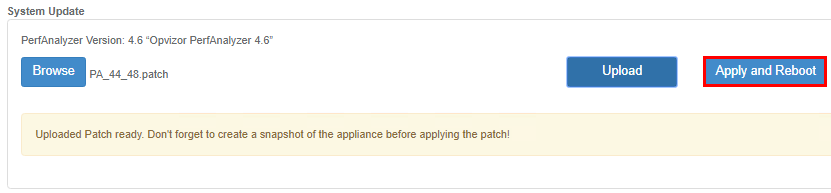
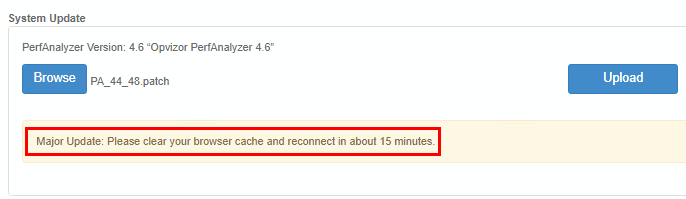
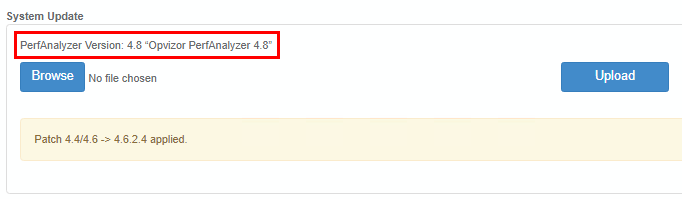
Upgrading the Opvizor Perrformance Analyzer Appliance
The upgrade process for those already running Opvizor Performance Analyzer is very straightforward and includes copying update files to the appliance and running the upgrade. There will be a couple of reboots during the process.
Opvizor VMware Performance Analyzer 4.8.0 Released New Features including Spectre and Meltdown Dashboard
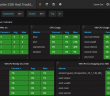
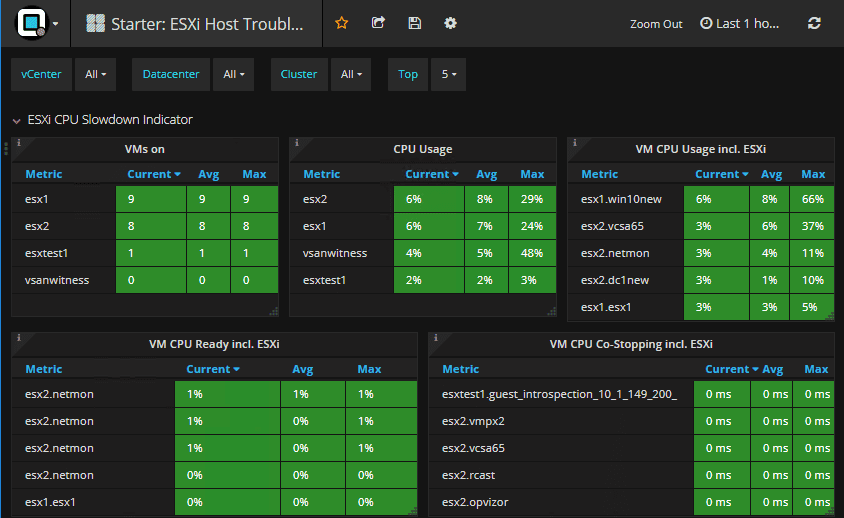
There are a lot of new features packed into the Opvizor Performance Analyzer 4.8.0 dashboards including the Starter: ESXi Host Troubleshooting dashboard. There are great metrics here that are polled to determine “slowness” indicators – a great way of troubleshooting from the ESXi host side.
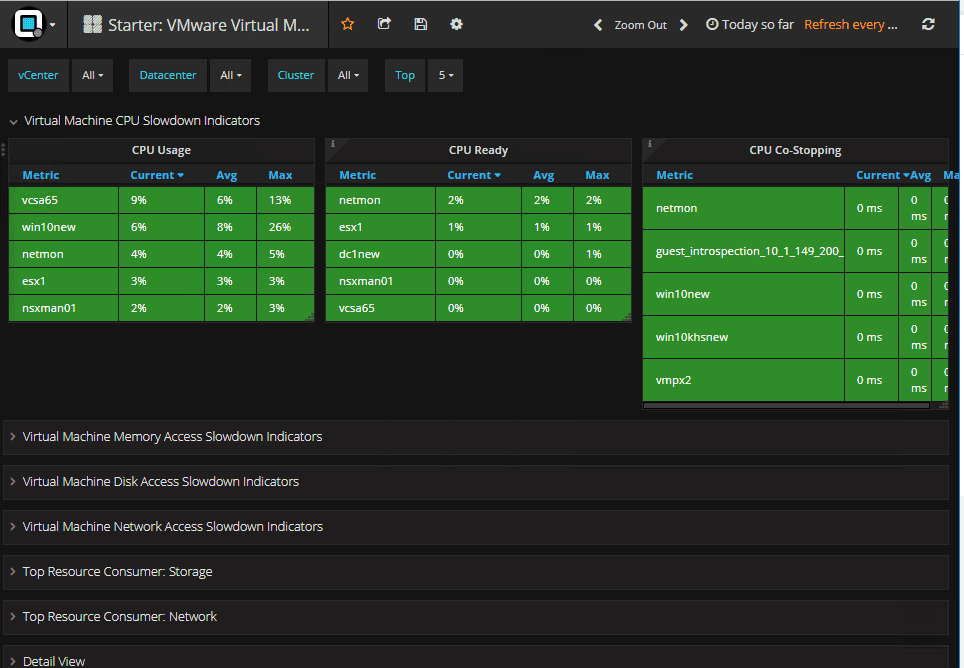
Additionally, a new Starter VMware Virtual Machine dashboard is a great look at key performance indicators from the virtual machine side with real time updates in a “Christmas tree” fashion with green being everything is healthy and red indicating problems. Similar to the ESXi indicators, the starter virtual machine dashboard provides similar “slowdown” indicators which give valuable insights into where issues may be from the virtual machine side of things.
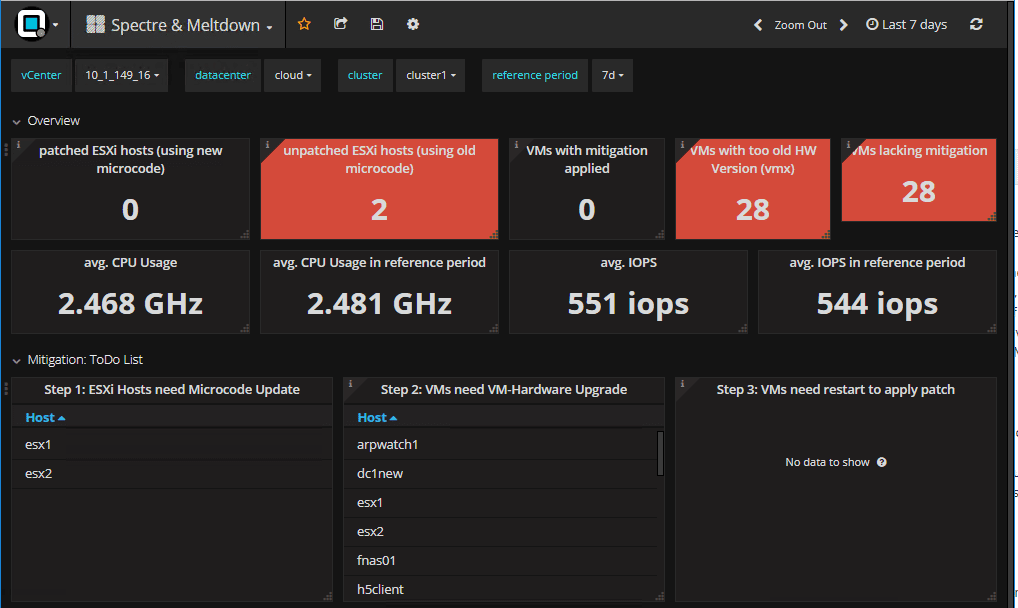
There seemingly hasn’t been any bigger news event than Spectre and Meltdown have been in 2018. Keeping up with the patches, hosts with patches, virtual machines in need of OS patches, can be a nightmare. The new release of Opvizor Performance Analyzer 4.8.0 has you covered with a new Spectre & Meltdown dashboard. The dashboard allows quickly seeing which hosts and VMs are in need of patches or a pending reboot to apply patches.
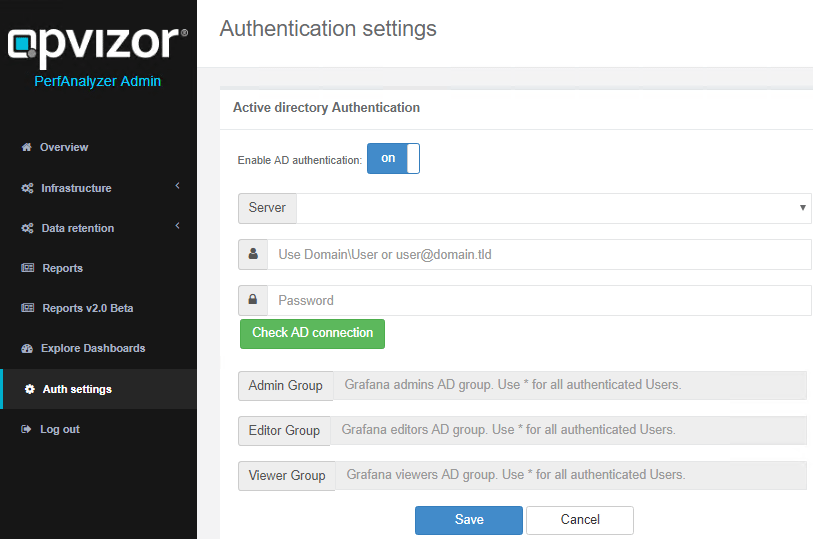
A great new feature with this release of Opvizor Performance Analyzer 4.8.0 is integration with Microsoft Active Directory. This allows utilizing AD groups with various roles in Opvizor for assigning privileges to users. This allows organizations to maintain a centralize authentication scheme that follows their currently defined password policies, etc.
Thoughts
If you are looking for an extremely full featured, powerful, and capable VMware vSphere monitoring solution, Opvizor Performance Analyzer provides tremendous functionality in an extremely intuitive (and beautiful) Graphana interface. What strikes you when you provision Opvizor is the quickness with which you can see hotspots in your vSphere environment by the way the dashboards present in the information. Even if you have never used the product before, it has a natural way about the interface of allowing you to easily get up to speed and intuitively find your way around the various dashboards. If you haven’t heard of Opvizor before, be sure to pull down the appliance and try the free 30 day trial. Also, if you already have the appliance up and running with a previous version, follow the steps here to download the patches and run the update.
More in this topic

Discuss this in the Community
Google is updating how articles are shown. Don’t miss our leading home lab and tech content, written by humans, by setting Virtualization Howto as a preferred source.
About The Author
